FANUC Series 30i-MODEL B, 31i-MODEL B, 32i-MODEL B. MAINTENANCE MANUAL - page 3
1.DISPLAY AND OPERATION
B-64485EN/01
[Unit of data] W
NOTE
This power consumption becomes a negative value during
regeneration of power such as reduction in servo axis speed.
Current actual power consumption of each spindle
Diagnosis
4902
Current actual power consumption of each spindle
[Data type] 2-word spindle
[Unit of data] W
NOTE
This power consumption becomes a negative value during
regeneration of power such as reduction in spindle speed.
Accumulated value of the total power consumption of all servo axes/spindles
Diagnosis
4910
Accumulated value of the total actual power consumption of all axes
Diagnosis
4911
Accumulated value of the total power consumption of all axes
Diagnosis
4912
Accumulated value of the total regenerated power of all axes
[Data type] 2-word
[Unit of data] 0.001kWh
NOTE
These values are accumulated after power-on.
Accumulated value of power consumption of each servo axis
Diagnosis
4920
Accumulated value of the actual power consumption of each servo axis
Diagnosis
4921
Accumulated value of the power consumption of each servo axis
Diagnosis
4922
Accumulated value of the regenerated power of each servo axis
[Data type] 2-word axis
[Unit of data] 0.001kWh
NOTE
These values are accumulated after power-on.
Accumulated value of power consumption of each spindle
Diagnosis
4930
Accumulated value of the actual power consumption of each spindle
Diagnosis
4931
Accumulated value of the power consumption of each spindle
Diagnosis
4932
Accumulated value of the regenerated power of each spindle
[Data type] 2-word spindle
[Unit of data] W
NOTE
These values are accumulated after power-on.
- 42 -
B-64485EN/01
1.DISPLAY AND OPERATION
Interpolation state
Diagnosis
5000
Smoothing mode
[Data type] Bit
NAME Interpolation state when "1" is indicated
Smooth IPL on When smooth interpolation G5.1 Q2 is specified and all conditions are satisfied, "1" is
indicated. The G5.1 Q2 command turns on AI contour control at the same time. Therefore,
the AI contour control mode signal AICC<Fn062.0> turns on and AICC1/AICC2 blinks
in the state display at the lower right of the screen.
SMOOTHING ON When nano smoothing G5.1 Q3 is specified and all conditions are satisfied, "1" is
indicated. The G5.1 Q3 command turns on AI contour control at the same time. Therefore,
the AI contour control mode signal AICC<Fn062.0> turns on and AICC1/AICC2 blinks
in the state display at the lower right of the screen.
3-dimensional machine position compensation
Diagnosis
5302
Compensation amount of 3-dimensional machine position compensation
[Data type] 2-word axis
[Unit of data] Detection unit
The compensation value of 3-dimensional machine position compensation is indicated.
Diagnosis data related to automatic phase synchronization for flexible
synchronous control
Diagnosis
5600
Error of automatic phase synchronization (group A)
Diagnosis
5601
Error of automatic phase synchronization (group B)
Diagnosis
5602
Error of automatic phase synchronization (group C)
Diagnosis
5603
Error of automatic phase synchronization (group D)
[Data type] Real path
[Unit of data] mm, inch, deg (machine unit)
Error between master axis and slave axis after executing automatic phase Synchronization
for flexible synchronous control is displayed.
This data is displayed in the path of slave axis in inter-path flexible synchronous control.
Diagnosis
5604
Maximum error of Automatic Phase Synchronization (group A)
Diagnosis
5605
Maximum error of Automatic Phase Synchronization (group B)
Diagnosis
5606
Maximum error of Automatic Phase Synchronization (group C)
Diagnosis
5607
Maximum error of Automatic Phase Synchronization (group D)
[Data type] Real path
[Unit of data] mm, inch, deg (machine unit)
Maximum error between master axis and slave axis after executing automatic phase
synchronization for flexible synchronous control is displayed.
This data is displayed in the path of slave axis in inter-path flexible synchronous control.
This data is cleared when automatic operation is started in auto mode.
This data is cleared when flexible synchronous control is started in manual mode.
- 43 -
1.DISPLAY AND OPERATION
B-64485EN/01
1.4
CNC STATE DISPLAY
-
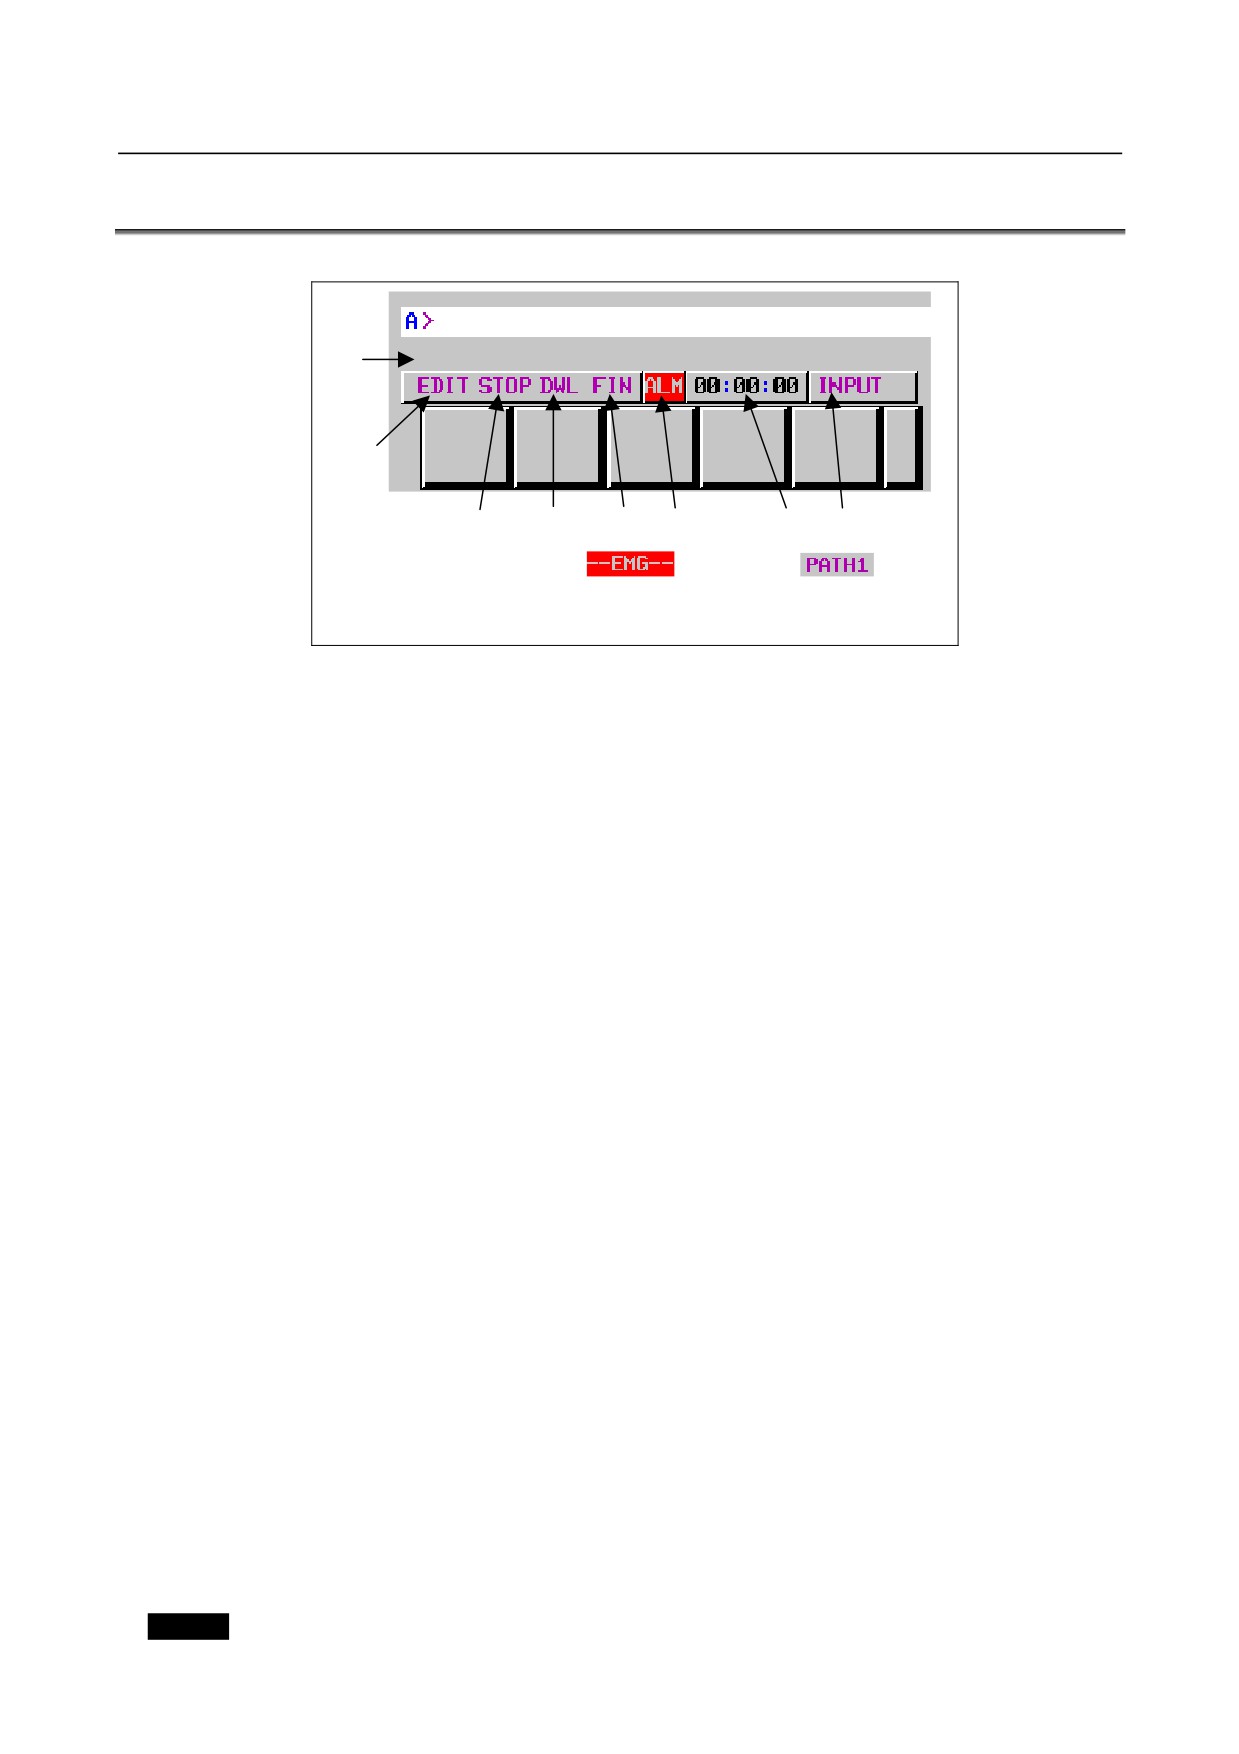
Description of each display
(9)
DATA IS OUT OF RANGE
(1)
(2)
(3)
(4)
(6)
(7)
(8)
(5) :
(10) :
(5) is displayed in the
(10) is displayed at the
area for (3) and (4).
position where (8) is
now displayed.
Fig. 1.4
(1) Current mode
MDI
: Manual data input, MDI operation
MEM : Automatic operation (memory operation)
RMT
: Automatic operation (DNC operation, or such like)
EDIT
: Memory editing
HND
: Manual handle feed
JOG
: Jog feed
INC
: Manual incremental feed
REF
: Manual reference position return
(2) Automatic operation status
****
: Reset (When the power is turned on or the state in which program execution has terminated and
automatic operation has terminated.)
STOP
: Automatic operation stop (The state in which one block has been executed and automatic
operation is stopped.)
HOLD : Feed hold (The state in which execution of one block has been interrupted and automatic
operation is stopped.)
STRT
: Automatic operation start-up (The state in which the system operates automatically)
MSTR : Manual numerical command start state (The state in which a manual numerical command is
being executed)
Alternatively, tool retract and recover operation state (The state in which a recover operation
and repositioning operation are being performed)
(3) Axis moving status/dwell status
MTN
: Indicates that the axis is moving.
DWL
: Indicates the dwell state.
***
: Indicates a state other than the above.
(4) State in which an auxiliary function is being executed
FIN
: Indicates the state in which an auxiliary function is being executed. (Waiting for the complete
signal from the PMC)
***
: Indicates a state other than the above.
(5) Emergency stop or reset status
--EMG--
: Indicates emergency stop.(Blinks in reversed display.)
- 44 -
B-64485EN/01
1.DISPLAY AND OPERATION
--RESET-- : Indicates that the reset signal is being received.
(6) Alarm status
ALM
: Indicates that an alarm is issued. (Blinks in reversed display.)
BAT
: Indicates that the voltage of the lithium battery (the backup battery of the CNC) has decreased.
(Blinks in reversed display.)
APC
: Indicates that the voltage of the backup battery of the absolute pulse coder has decreased.
(Blinks in reversed display.)
FAN
: Indicates that the rotation speed of the fan has decreased. (Blinks in reversed display.)
Check the fan motor status display screen and replace the fan motors for which the rotation
speed is found to be decreased.
Space
: Indicates a state other than the above.
(7) Current time
hh : mm : ss
-
Hours, minutes, and seconds
(8) Program editing status
INPUT
: Indicates that data is being input.
OUTPUT
: Indicates that data is being output.
SEARCH
: Indicates that a search is being performed.
EDIT
: Indicates that another editing operation is being performed (insertion, modification, etc.)
LSK
: Indicates that labels are skipped when data is input.
RSTR
: Indicates that the program is being restarted
COMPARE : Indicates that a data comparison is being made.
OFST
: Indicates that the tool length compensation amount measurement mode is set
(for the machining center system) or that the tool length compensation amount write mode
is set (for the lathe system).
WOFS
: Indicates that the workpiece origin offset amount measurement mode is set.
AICC1
: Indicates that operation is being performed in the AI contour control I mode.
AICC2
: Indicates that operation is being performed in the AI contour control II mode.
MEM-CHK : Indicates that a program memory check is being made.
WSFT
: Indicates that the workpiece shift amount write mode is set.
LEN
: Indicates that the active offset value change mode (tool length offset value of the M series)
is set.
RAD
: Indicates that the active offset value change mode (tool radius compensation amount of the
M series) is set.
WZR
: Indicates that the active offset value change mode (workpiece origin offset value) is set.
TOFS
: Indicates that the active offset value change mode (tool offset value of the M series) is set.
OFSX
: Indicates that the active offset value change mode (X-axis tool offset value of the T series)
is set.
OFSZ
: Indicates that the active offset value change mode (Z-axis tool offset value of the T series)
is set.
OFSY
: Indicates that the active offset value change mode (Y-axis tool offset value of the T series).
TCP
: Indicates that operation is being performed in the tool center point control.
TWP
: Indicates that operation is being performed in the tilted working plane command mode.
Space
: Indicates that no editing operation is being performed.
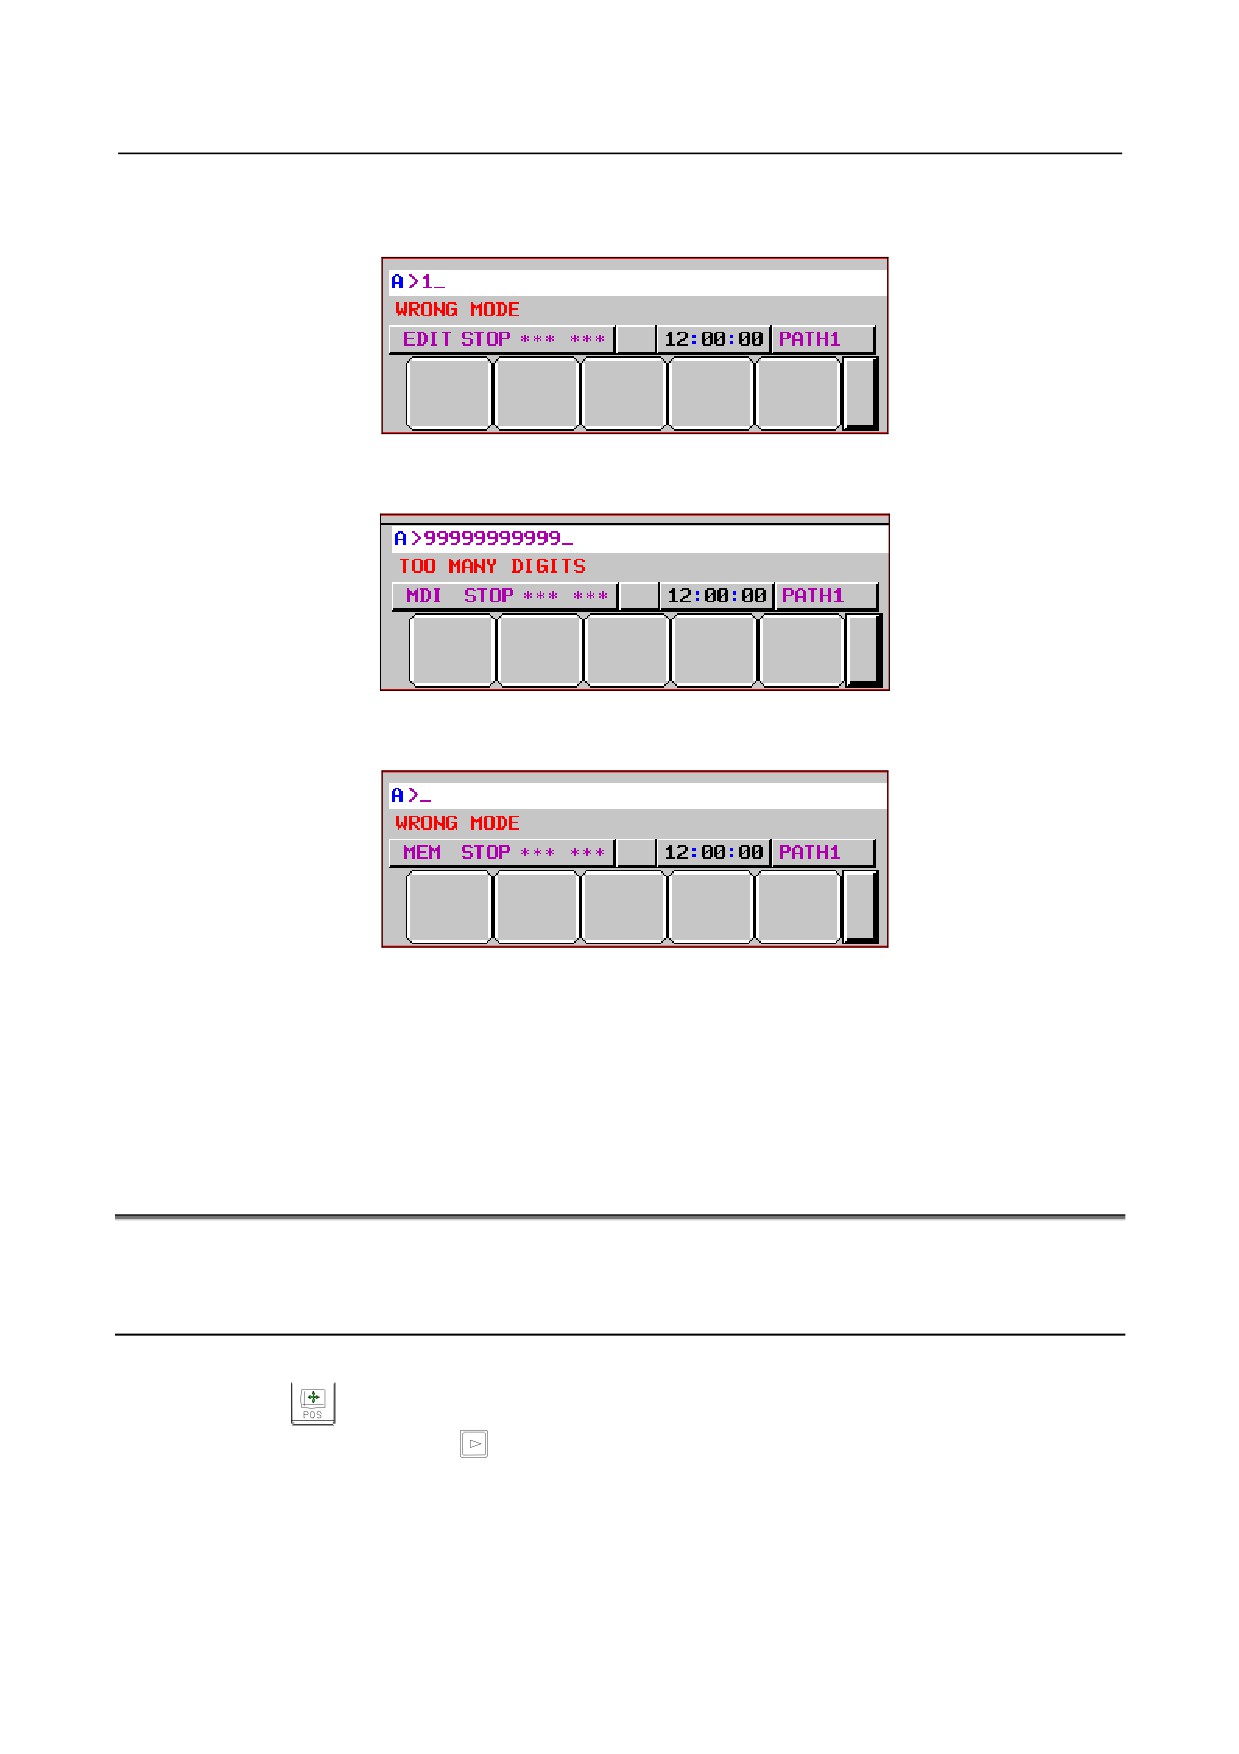
(9) Warning for data setting or input/output operation
When invalid data is entered (wrong format, value out of range, etc.), when input is disabled (wrong
mode, write disabled, etc.), or when input/output operation is incorrect (wrong mode, etc.), a warning
message is displayed. When the RS232-C communication port is being used, “CANNOT USE I/O
DEVICE” is displayed.
In this case, the CNC does not accept the setting or input/output operation (retry the operation according
to the message).
- 45 -
1.DISPLAY AND OPERATION
B-64485EN/01
Example 1)
When a parameter is entered
Example 2)
When a parameter is entered
Example 3)
When a parameter is output to an external input/output device
(10) Tool post name
The number of a path whose status is indicated is displayed.
PATH1
:
Indicates that the status being indicated is for path 1.
Other names can be used depending on the settings of parameters 3141 to 3147.
The tool post name is displayed at the position where (8) is now displayed.
While the program is edited, (8) is displayed.
1.5
OPERATING MONITOR
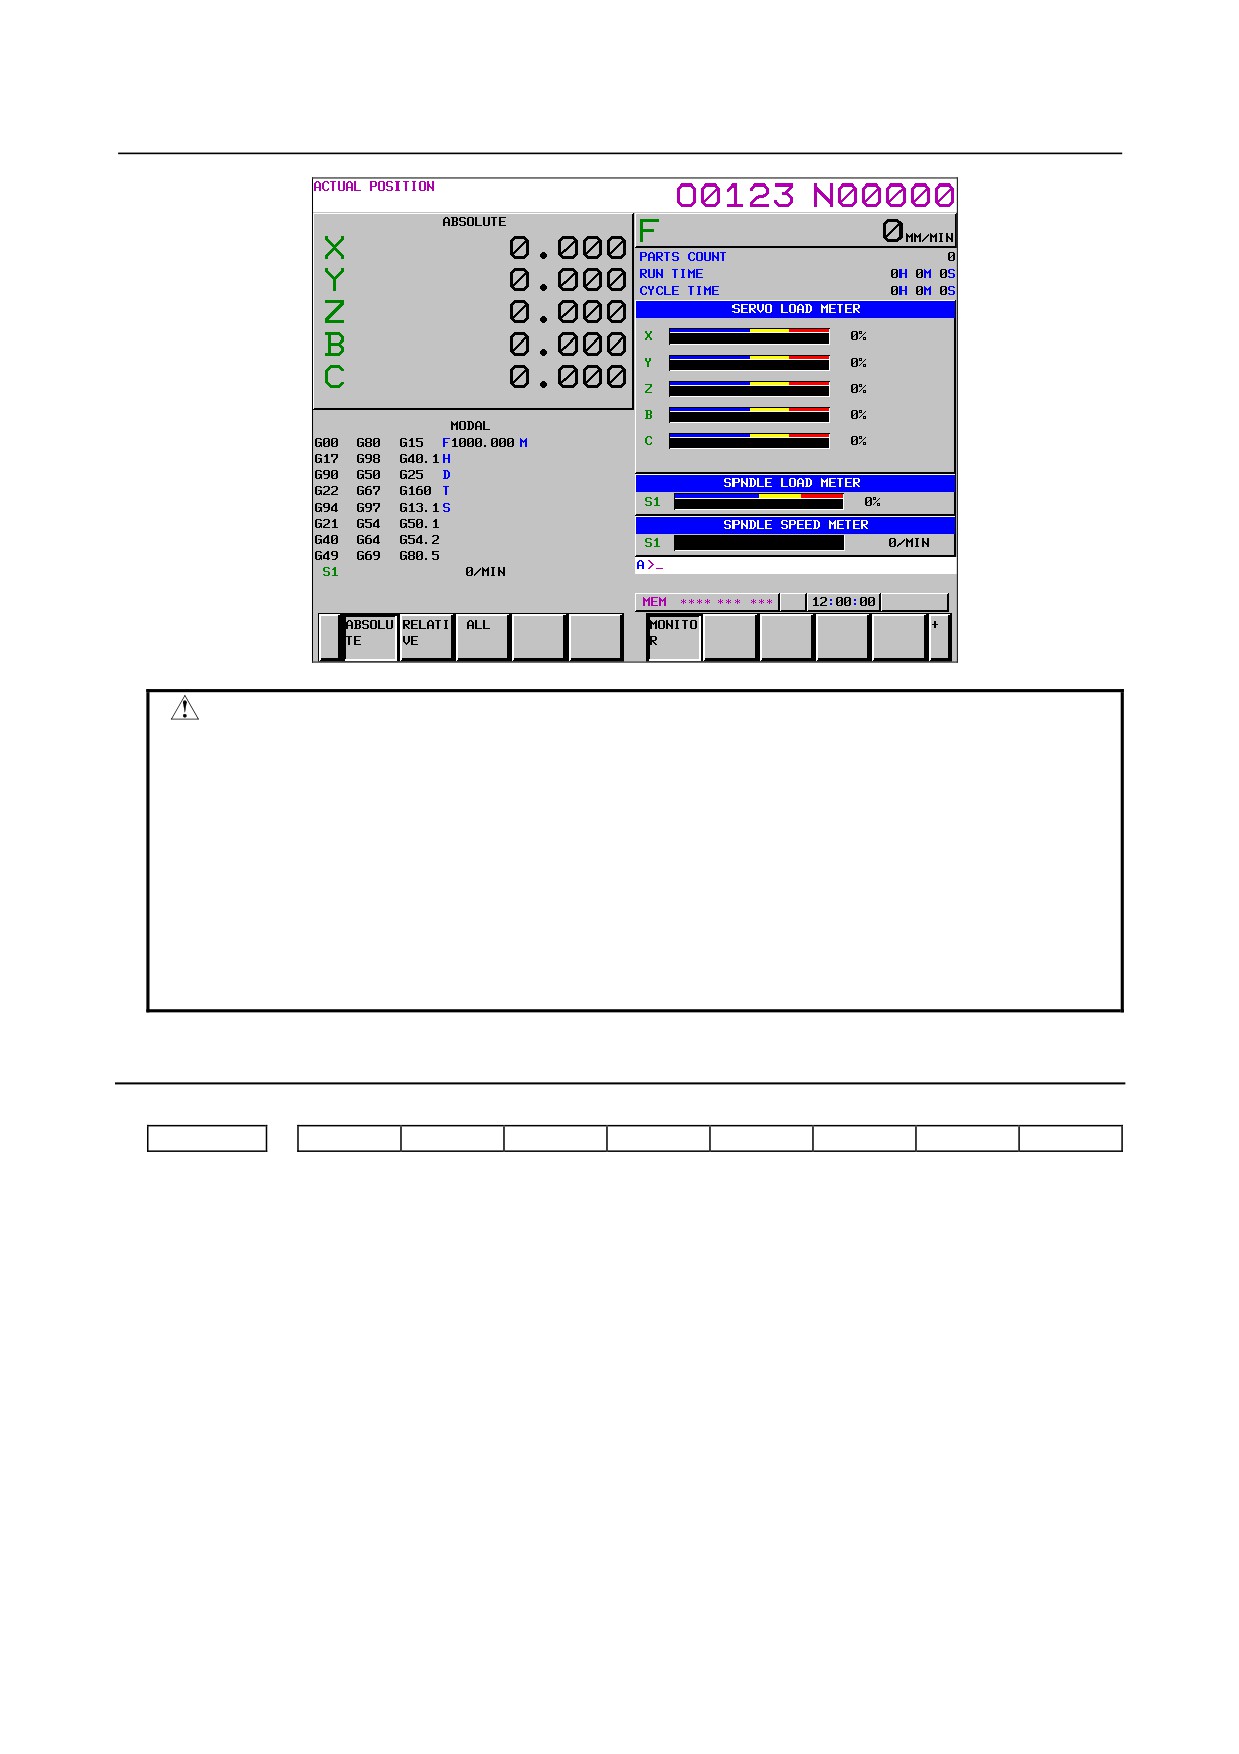
Load meter of the servo axis and the serial spindle and the speed meter can be displayed.
1.5.1
Display Method
1
Set a parameter to display operating monitor. (Bit 5 (OPM) of parameter No.3111)
2
Press the
key to display the position display screen.
3
Press continuous menu key
, then soft key [MONITOR] is displayed.
4
Press the soft key [MONITOR], then the operating monitor screen is displayed.
- 46 -
B-64485EN/01
1.DISPLAY AND OPERATION
CAUTION
1 The bar graph for the load meter shows load up to 200%.
2 The bar graph for the speed meter shows the ratio of the current spindle speed
to the maximum spindle speed (100%). Although the speed meter normally
indicates the speed of the spindle motor, it can also be used to indicate the
speed of the spindle by setting bit 6 (OPS) of parameter 3111 to 1.
3 The servo axes for their load meters are displayed are set to parameter No.
3151 to 3153. If parameters 3151 to 3153 are all zero, the load meter of the
basic axes are displayed.
4 When high precision spindle speed control is enabled, these values are rounded
off to nearest integers.
1.5.2
Parameters
#7
#6
#5
#4
#3
#2
#1
#0
3111
OPS
OPM
[Input type] Setting input
[Data type] Bit path
#5 OPM Operating monitor
0: Not displayed
1: Displayed
#6 OPS The speedometer on the operating monitor screen indicates:
0: Spindle motor speed
1: Spindle speed
- 47 -

1.DISPLAY AND OPERATION
B-64485EN/01
1.6
WAVEFORM DIAGNOSIS DISPLAY
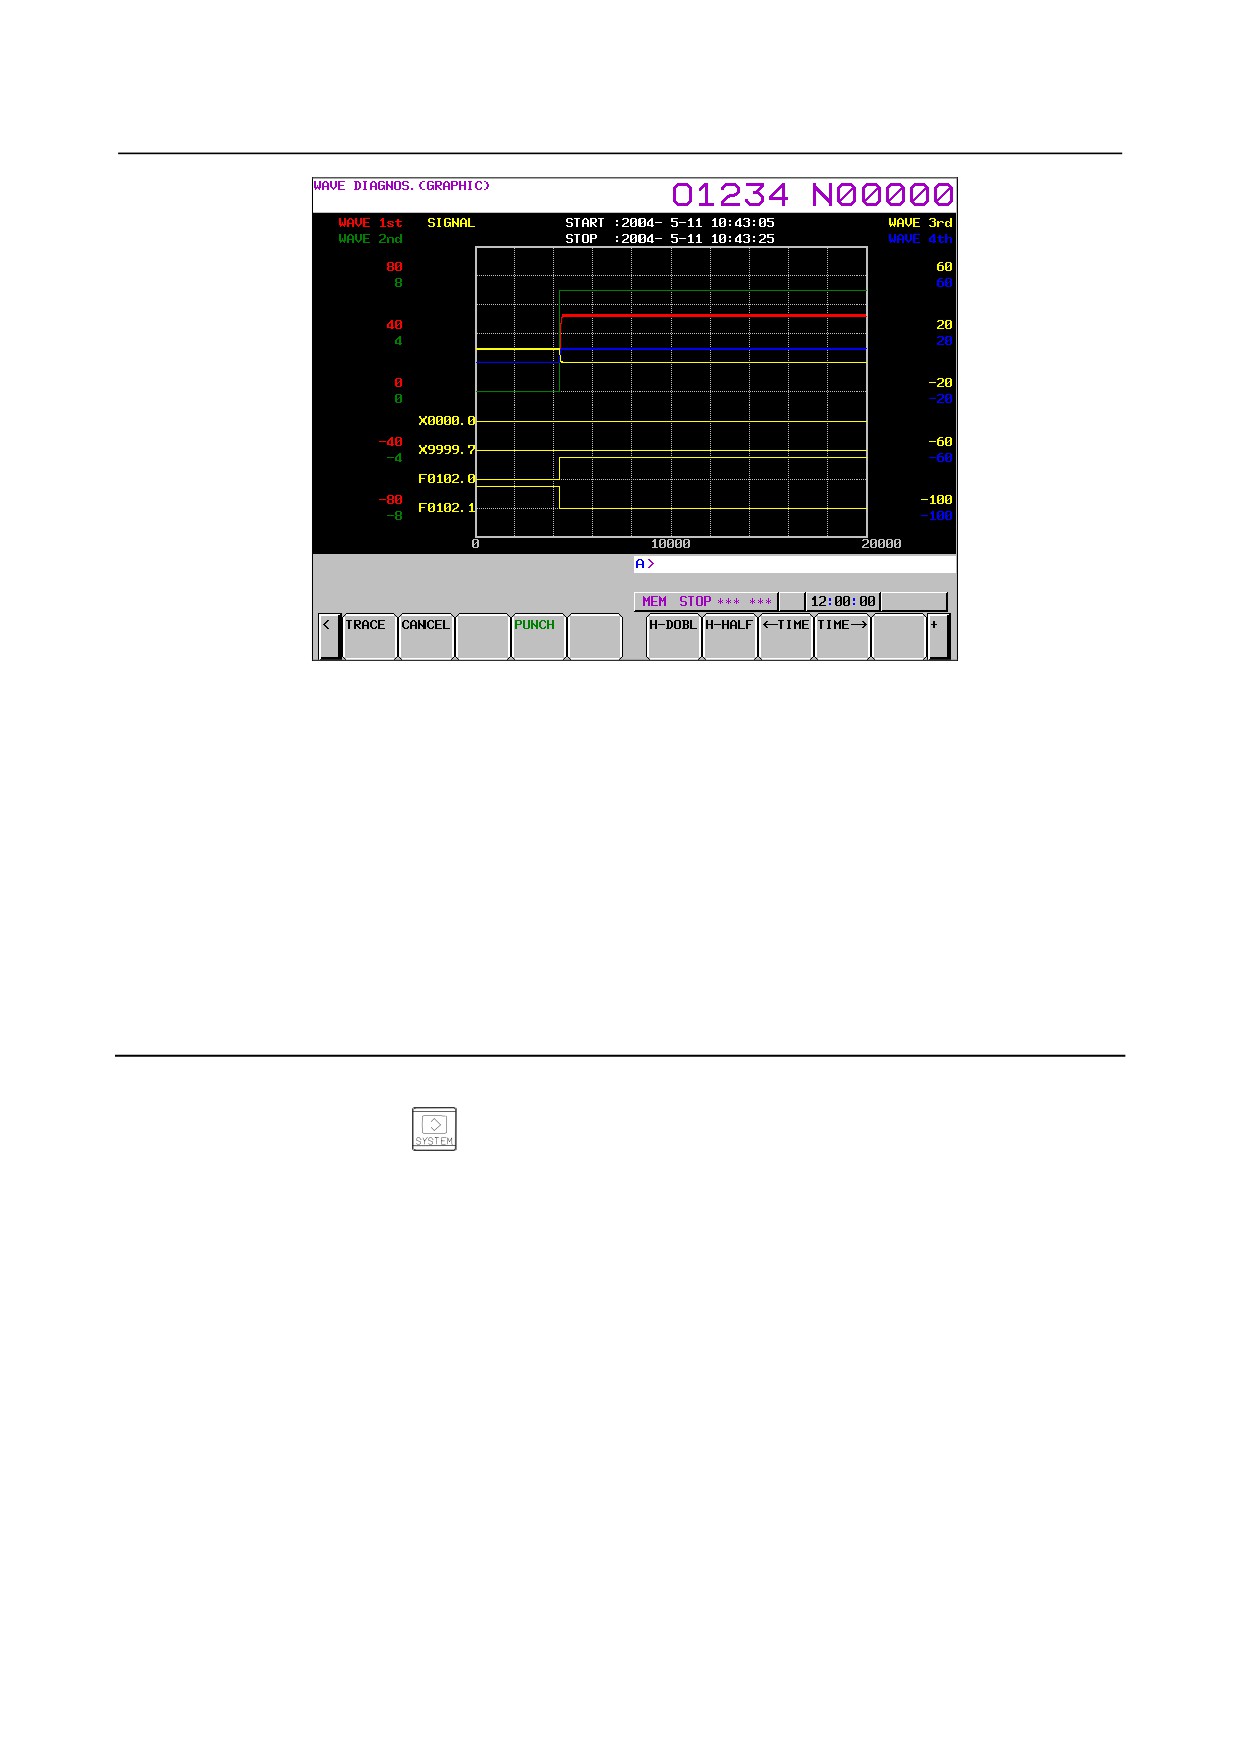
The waveform diagnosis display function traces values of data such as servo positional deviation amount,
torque, and machine signals and plots and displays a graph representing changes in the traced data. This
function facilitates servo motor and spindle motor adjustment and fault location when
trouble
has
occurred.
The waveform diagnosis function can trace the following data:
(1) Servo-related data
•
Positional deviation amount
•
Pulse amount after distribution
•
Torque amount (actual current)
•
Pulse amount after acceleration/deceleration
•
Current command value
•
Heat simulation data
•
Composite speed of all axes
(2) Spindle-related data
•
Speed of each spindle
•
Load meter value
•
Difference in spindle-converted positional deviation during rigid tapping
(3) Machine signal
•
ON/OFF state of the external I/O signal specified by a signal address
Up to four servo and spindle data items or up to 32 signals can be traced at the same time.
Data can be traced under the following three conditions:
(1) Data is acquired at any point of time.
(2) Data immediately after a specified event is acquired.
(3) Data immediately before a specified event is acquired.
In condition (1), the time to end tracing can be delayed by a specified time. This allows data before and
after the occurrence of an event can be acquired.
Traced data can be output to an external input/output device.
1.6.1
Waveform Diagnosis Graph Screen
1
Press the function key
2
Pressing the soft key [W.DGNS] displays a screen as shown below.
3
Pressing the operation soft key [(OPRT)] displays the following soft keys:
- 48 -
B-64485EN/01
1.DISPLAY AND OPERATION
-
Servo and spindle data
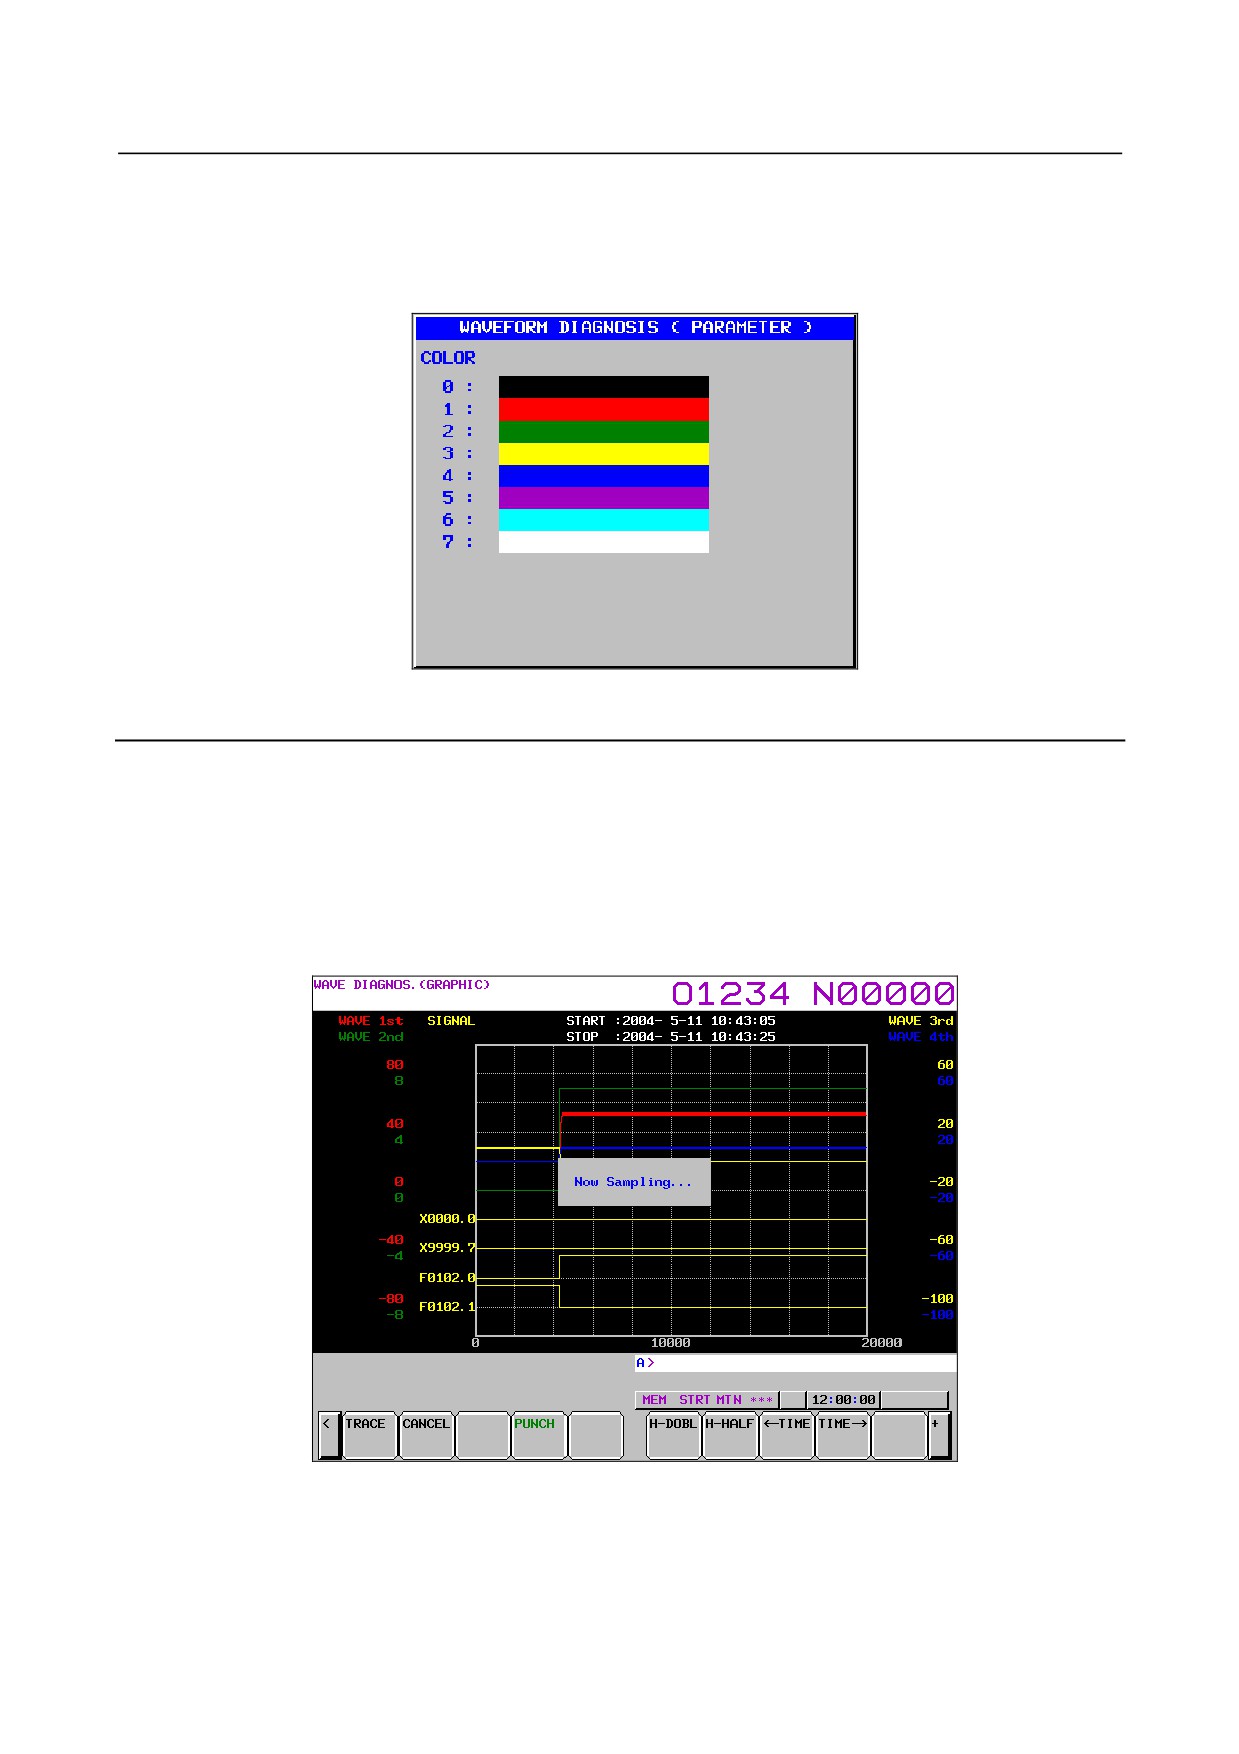
Each waveform is drawn in a specified color. The numbers and colors of the first and second waveforms
are indicated in the upper left part, and the numbers and colors of the third and fourth waveforms are
indicated in the upper right part.
-
I/O signals
When displayed over the waveforms of servo and spindle data, up to four I/O signals are plotted in the
lower half of the screen.
In this case, the addresses of the plotted signals are indicated in the second column on the left side.
When only signal data is displayed, up to nine signals are plotted in the entire screen.
The addresses of the plotted signals are indicated in the first column on the left side.
1.6.2
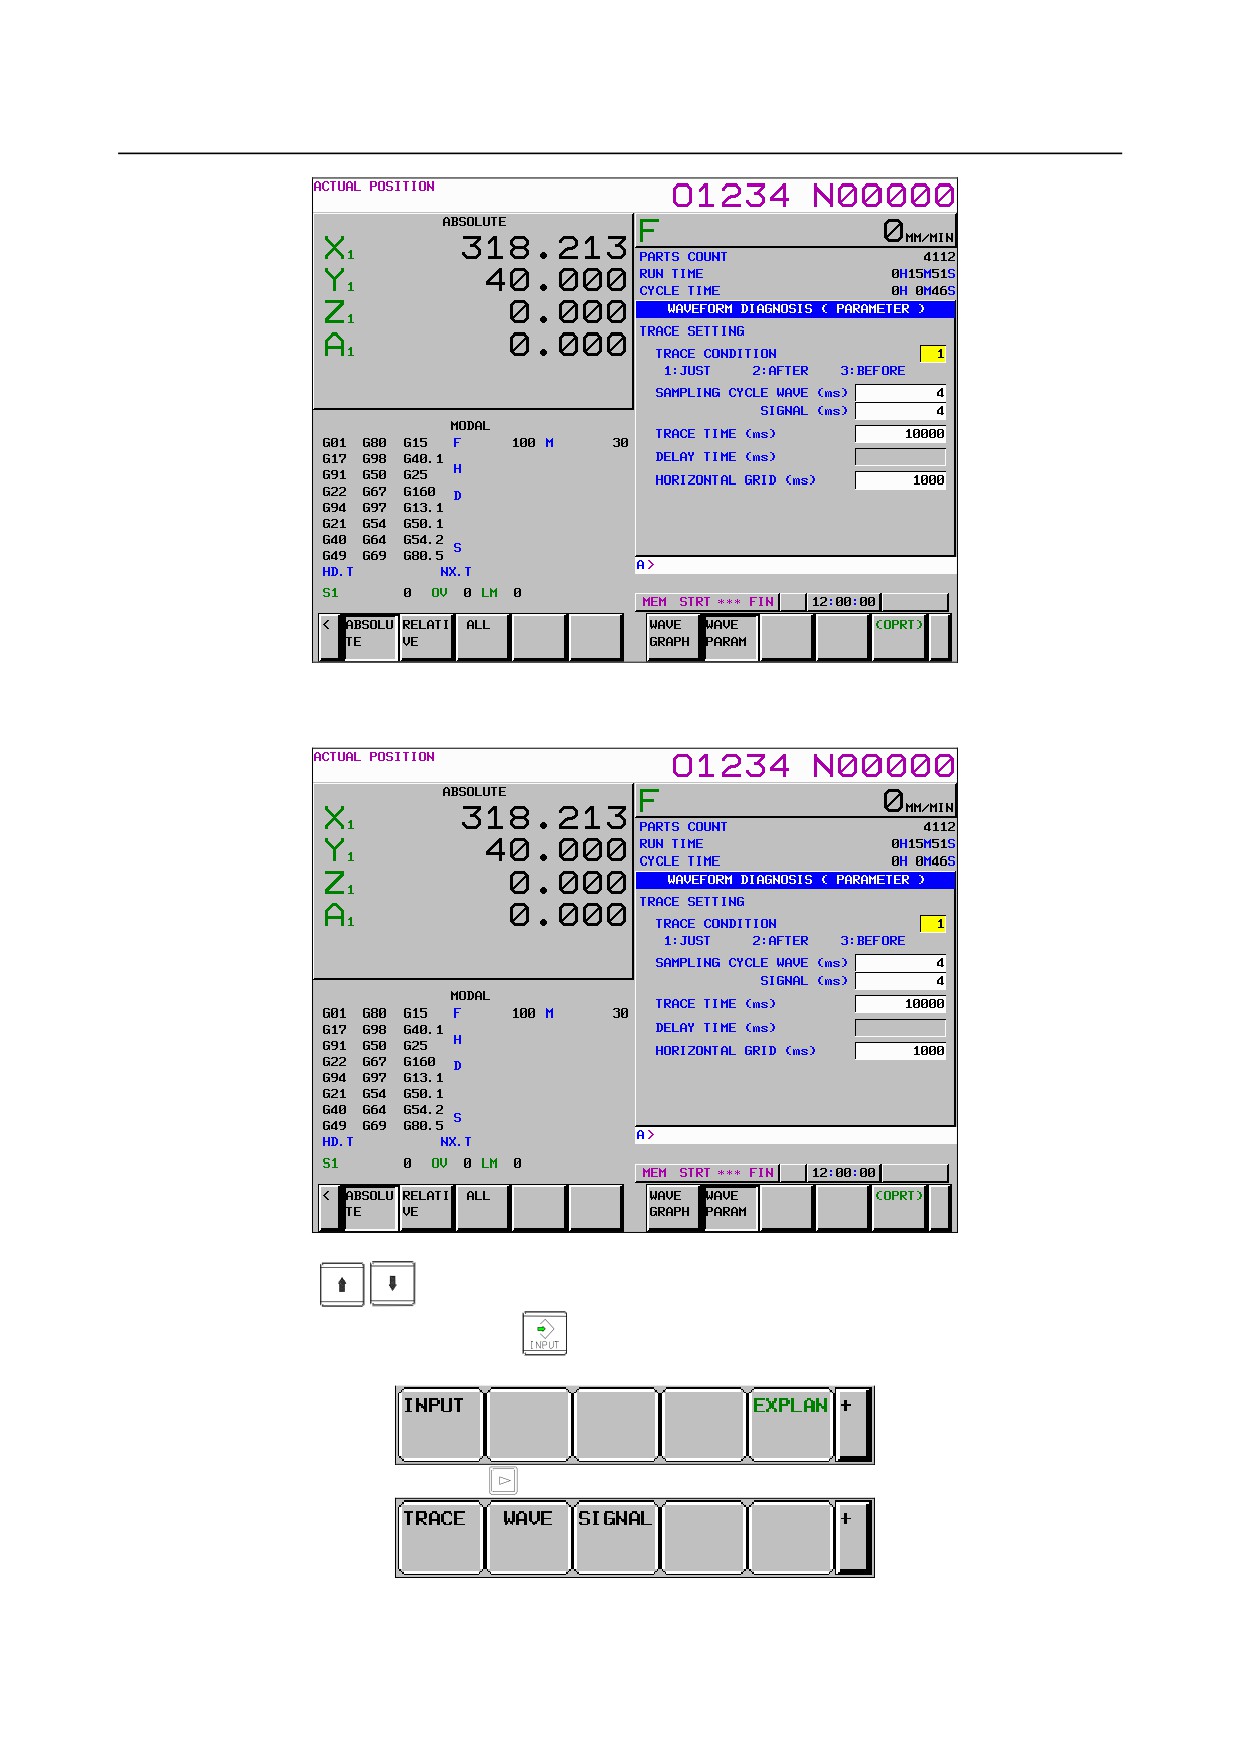
Waveform Diagnosis Parameter Screen
Display
1
Press the function key
2
Press the soft key [W.DGNS].
3
Pressing the soft key [PARAME] displays the waveform diagnosis parameter screen.
- 49 -
1.DISPLAY AND OPERATION
B-64485EN/01
Editing
1
Follow the steps explained in "Display" to display the screen.
2
Pressing the
cursor keys moves the cursor on the screen.
3
Press numeric keys, then press the
MDI key or soft key [INPUT] to set the entered value.
4
Press the [(OPRT)] operation soft key to display the following operation soft keys:
Pressing continuous menu key
displays the following soft keys:
Pressing [TRACE] displays the trace setting screen of the waveform diagnosis parameter screen.
Pressing [WAVE] displays the waveform setting screen of the waveform diagnosis parameter screen.
- 50 -
B-64485EN/01
1.DISPLAY AND OPERATION
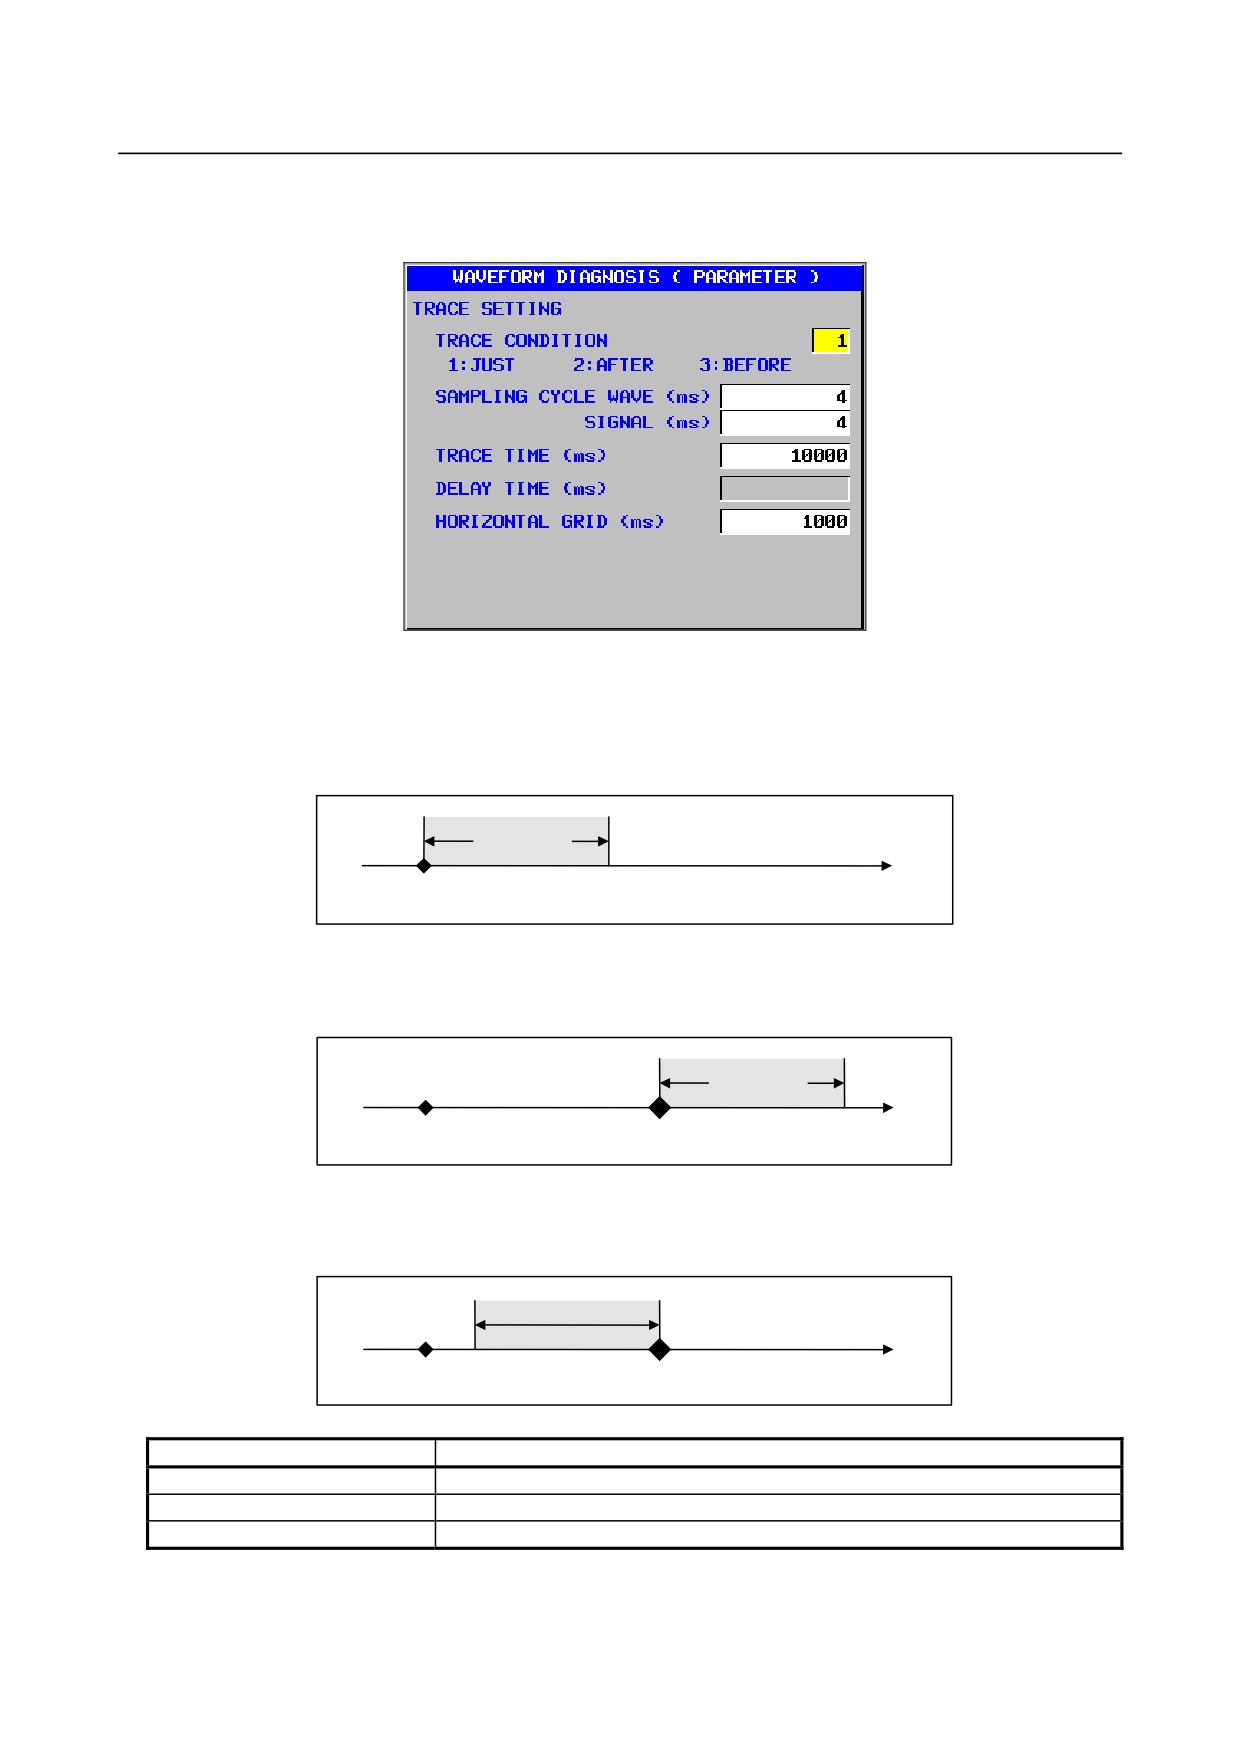
Pressing [SIGNAL] displays the signal setting screen of the waveform diagnosis parameter screen.
Trace setting
-
Trace condition
One of the following three trace conditions can be selected to start and end tracing:
Type 1 (1: JUST)
Data is traced only for a specified period of time immediately after the soft key [TRACE] is pressed.
Trace time
Time
[TRACE] pressed
Type 2 (2: AFTER)
When the soft key [TRACE] has been pressed, data is traced only for a specified period of
time
immediately after a specified trigger event occurs.
Trace time
Time
[TRACE] pressed
Event occurs
Type 3 (3: BEFORE)
When the soft key [TRACE] has been pressed, data is traced only for a specified period of
time
immediately before a specified trigger event occurs.
Trace time
Time
Event occurs
[TRACE] pressed
Setting
Trace condition
1
Type 1
2
Type 2
3
Type 3
- 51 -
1.DISPLAY AND OPERATION
B-64485EN/01
-
Sampling cycle
Set the sampling cycle period for waveforms and the sampling cycle for signals as follows:
Type
Setting
Waveform
Multiple of 2 ranging from 2 ms to 4096 ms
Signal
Multiple of 2 ranging from 2 ms to 4096 ms
-
Trace time
Set the period for tracing data.
The trace time specifies a period of time during which tracing is to be performed for waveforms and
signals. If the trace period is insufficient, increase the sampling cycle, or decrease the measurement items.
Approximately 32700 points of data can be traced. One point is used for each sampling cycle of one
channel. For signal measurement, one channel is used regardless of the number of signals measured at the
same time.
When one channel of waveform is traced with a sampling cycle of 4 ms, tracing can be performed for 130
s.
When one channel of waveform is traced with a sampling cycle of 4096 ms, tracing can be performed for
37 hours.
Valid data range:
2 to 133939200
Unit of data:
msec
Example of maximum trace time determined by the sampling cycle and the number of channels
No. of channels
1ch
4ch + signal
Cycle
2 ms
65 s
13 s
4 ms
130 s
26 s
8 ms
261 s
52 s
4096 ms
37 hours and 12 minutes
7 hours and 26 minutes
-
Delay time
When type 3 is selected as the trace condition, the end of tracing can be delayed by a specified time after
the occurrence of an event.
Valid data range: 0 to 65528 (in 8-ms increments)
Unit of data: ms
NOTE
If the input numeric value is not a multiple of 8 ms, the value is rounded off to the
nearest multiple of 8 ms.
-
Graduation unit on the horizontal axis
Set an increment per graduation on the horizontal axis.
Valid data range : 1 to 100000000
Unit of data : ms
- 52 -
B-64485EN/01
1.DISPLAY AND OPERATION
Trigger setting
-
Trigger type
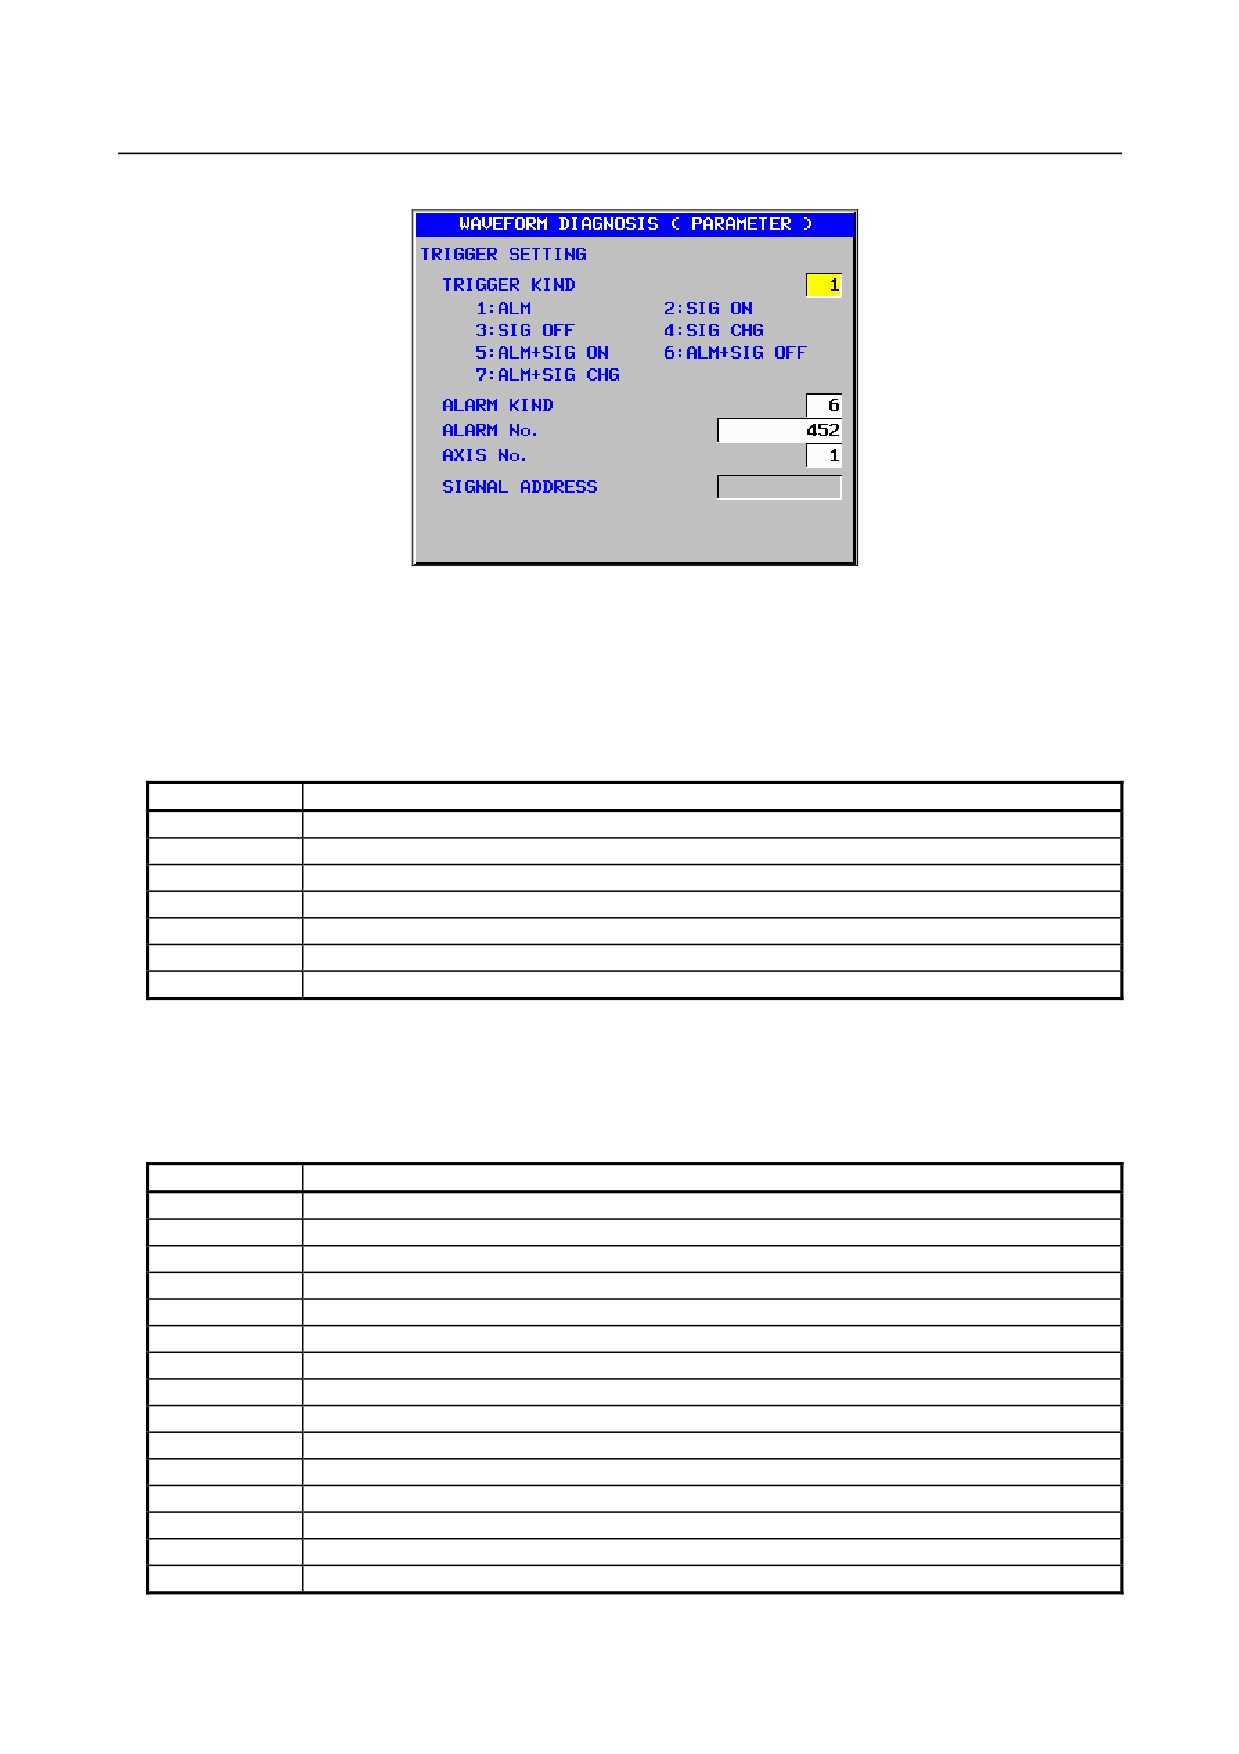
If you specify the occurrence of an event as a trigger when selecting a trace condition in the trace setting
of the waveform diagnosis parameter screen (2: AFTER or 3: BEFORE is specified as the trace condition),
set the type of the trigger.
If
2 (AFTER) is selected as the trace condition, tracing starts when a set trigger event occurs. If 3
(BEFORE) is selected as the trace condition, tracing ends when the trigger event occurs.
Setting
Trigger type
1
Alarms only
2
A specified signal is turned on.
3
A specified signal is turned off.
4
The status of a specified signal changes.
5
An alarm is issued, or a specified signal is turned on.
6
An alarm is issued, or a specified signal is turned off.
7
An alarm is issued, or the status of a specified signal changes.
-
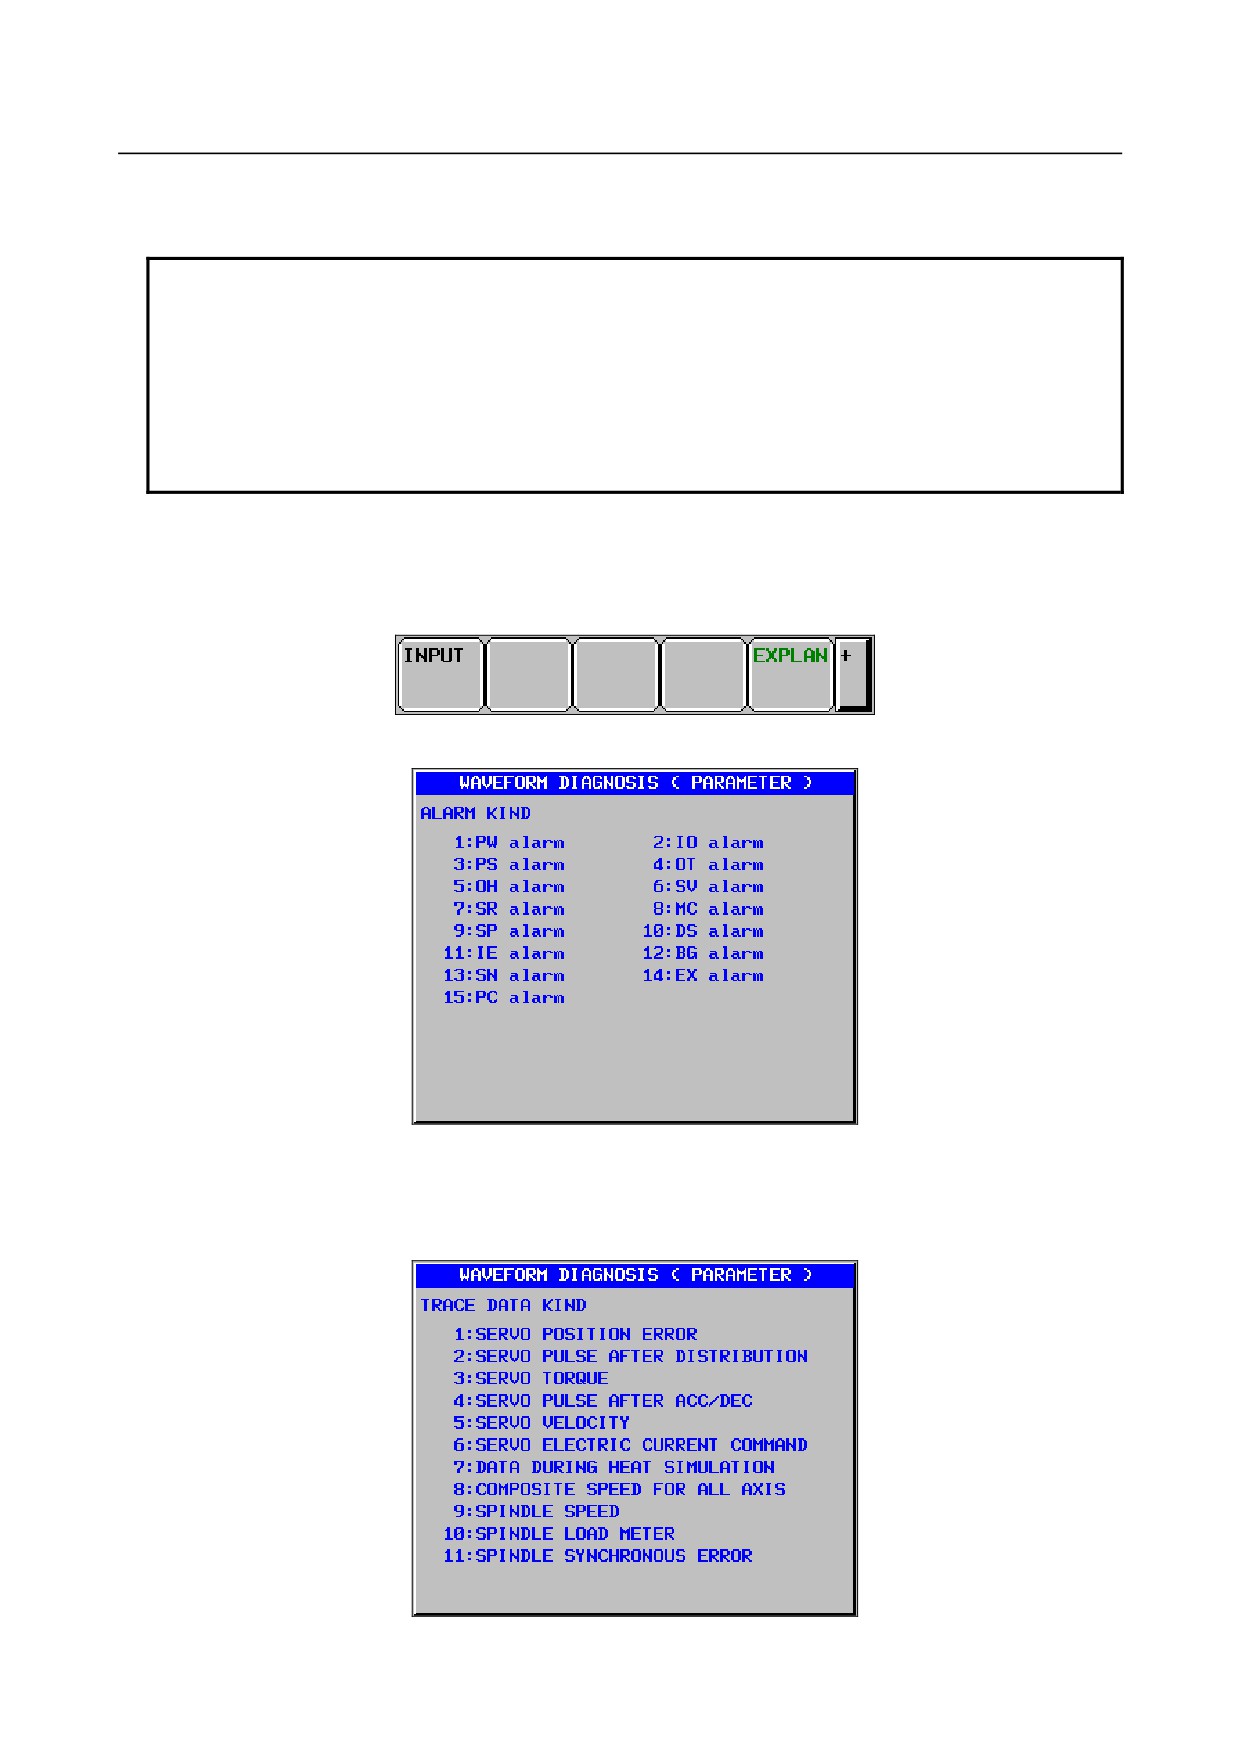
Alarm type
When the issuance of an alarm is specified as a trigger in the setting of the trigger type (the trigger type is
set to 1, 5, 6, or 7), set the type of alarms used as a trigger as listed in the table below. When a particular
alarm type is not to be specified, use alarm signal AL as the trigger.
Setting
Alarm type
1
PW alarms
2
IO alarms
3
PS alarms
4
OT alarms
5
OH alarms
6
SV alarms
7
SR alarms
8
MC alarms
9
SP alarms
10
DS alarms
11
IE alarms
12
BG alarms
13
SN alarms
14
EX alarms
15
PC alarms
- 53 -
1.DISPLAY AND OPERATION
B-64485EN/01
-
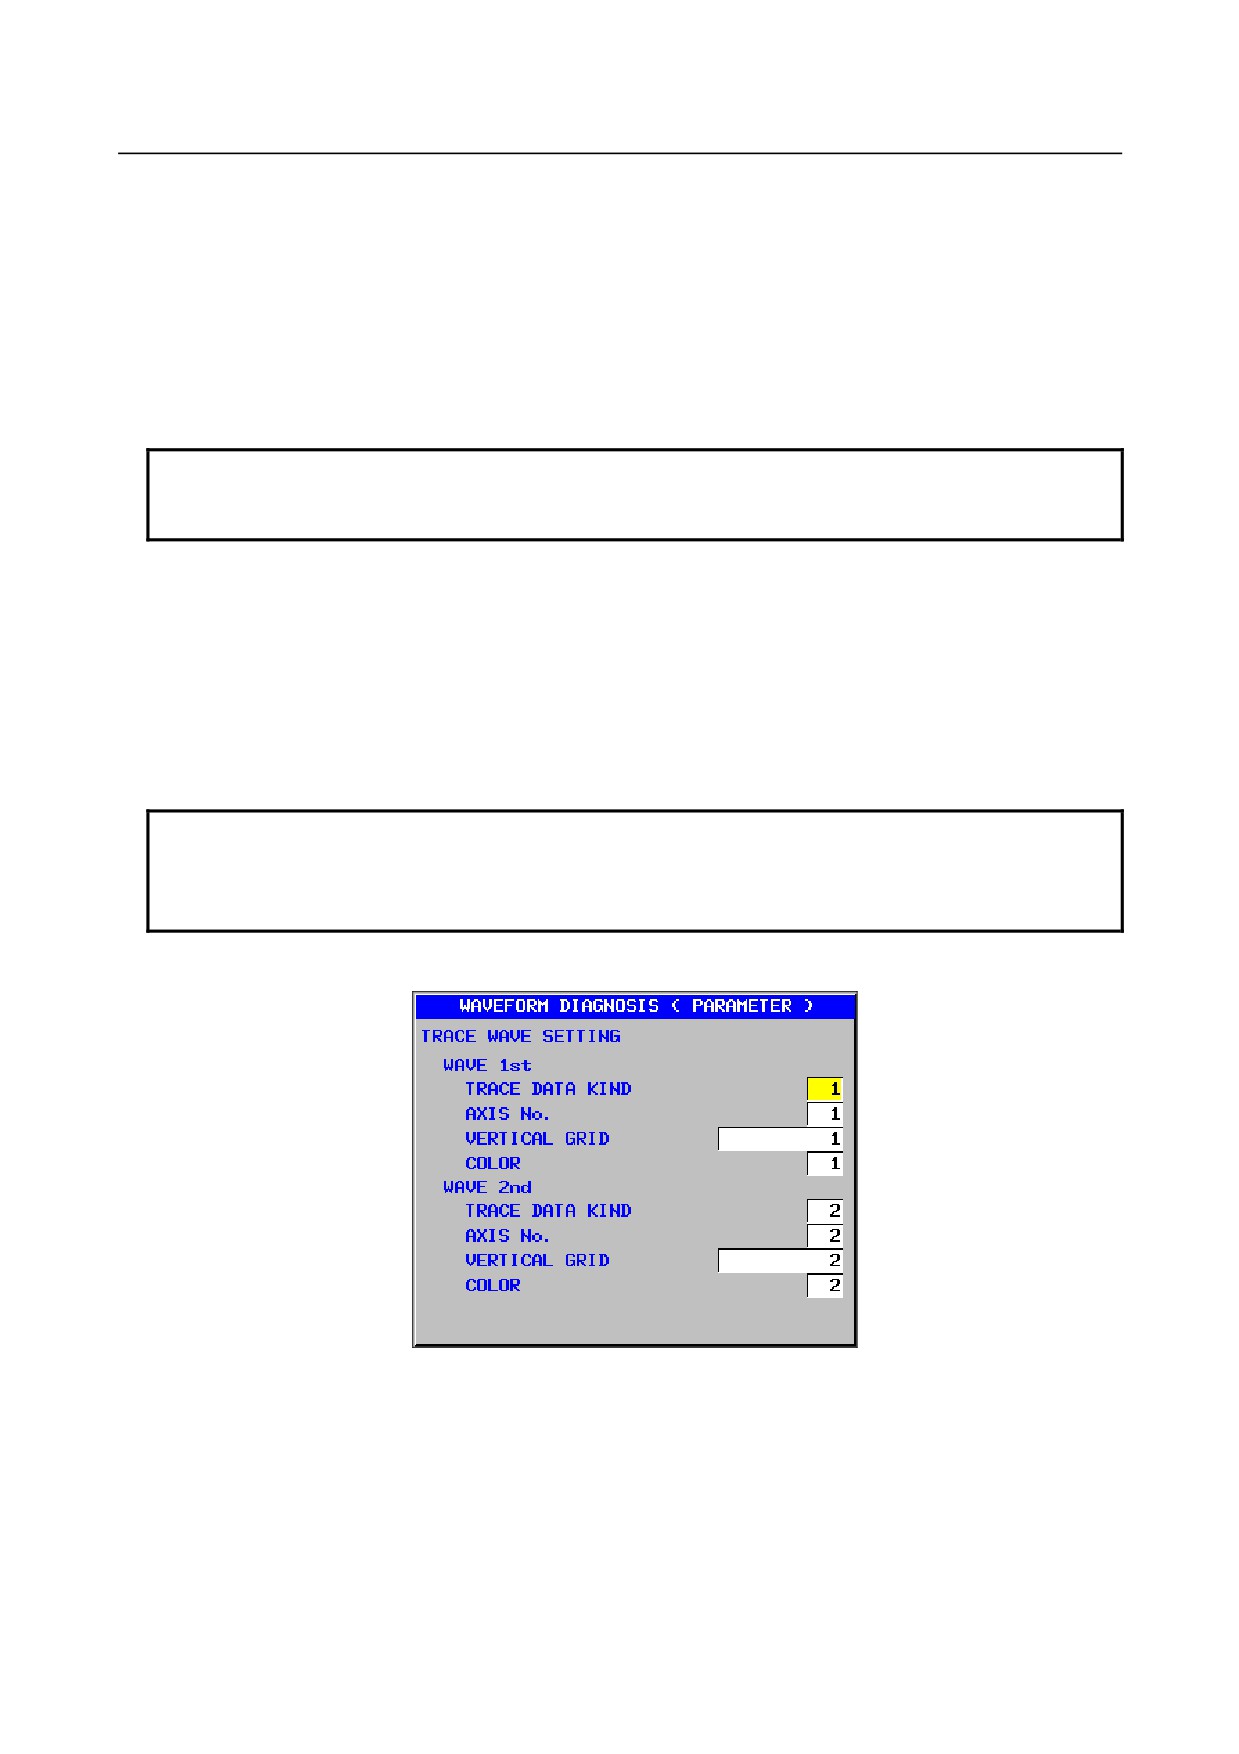
Alarm No.
If 6 (SV alarms) or 9 (SP alarms) is specified as the alarm type, specify the target alarm number with an
integer from 1 to 9999.
To specify all alarm numbers as the alarm target, set -1.
-
Axis No.
If 6 (SV alarms) or 9 (SP alarms) is specified as the alarm type, specify the target axis for the alarm with
an axis number.
To set all axes as the alarm target, set -1.
NOTE
For multi-axis control, the axis number must be an absolute axis number instead
of a relative axis number in each path.
-
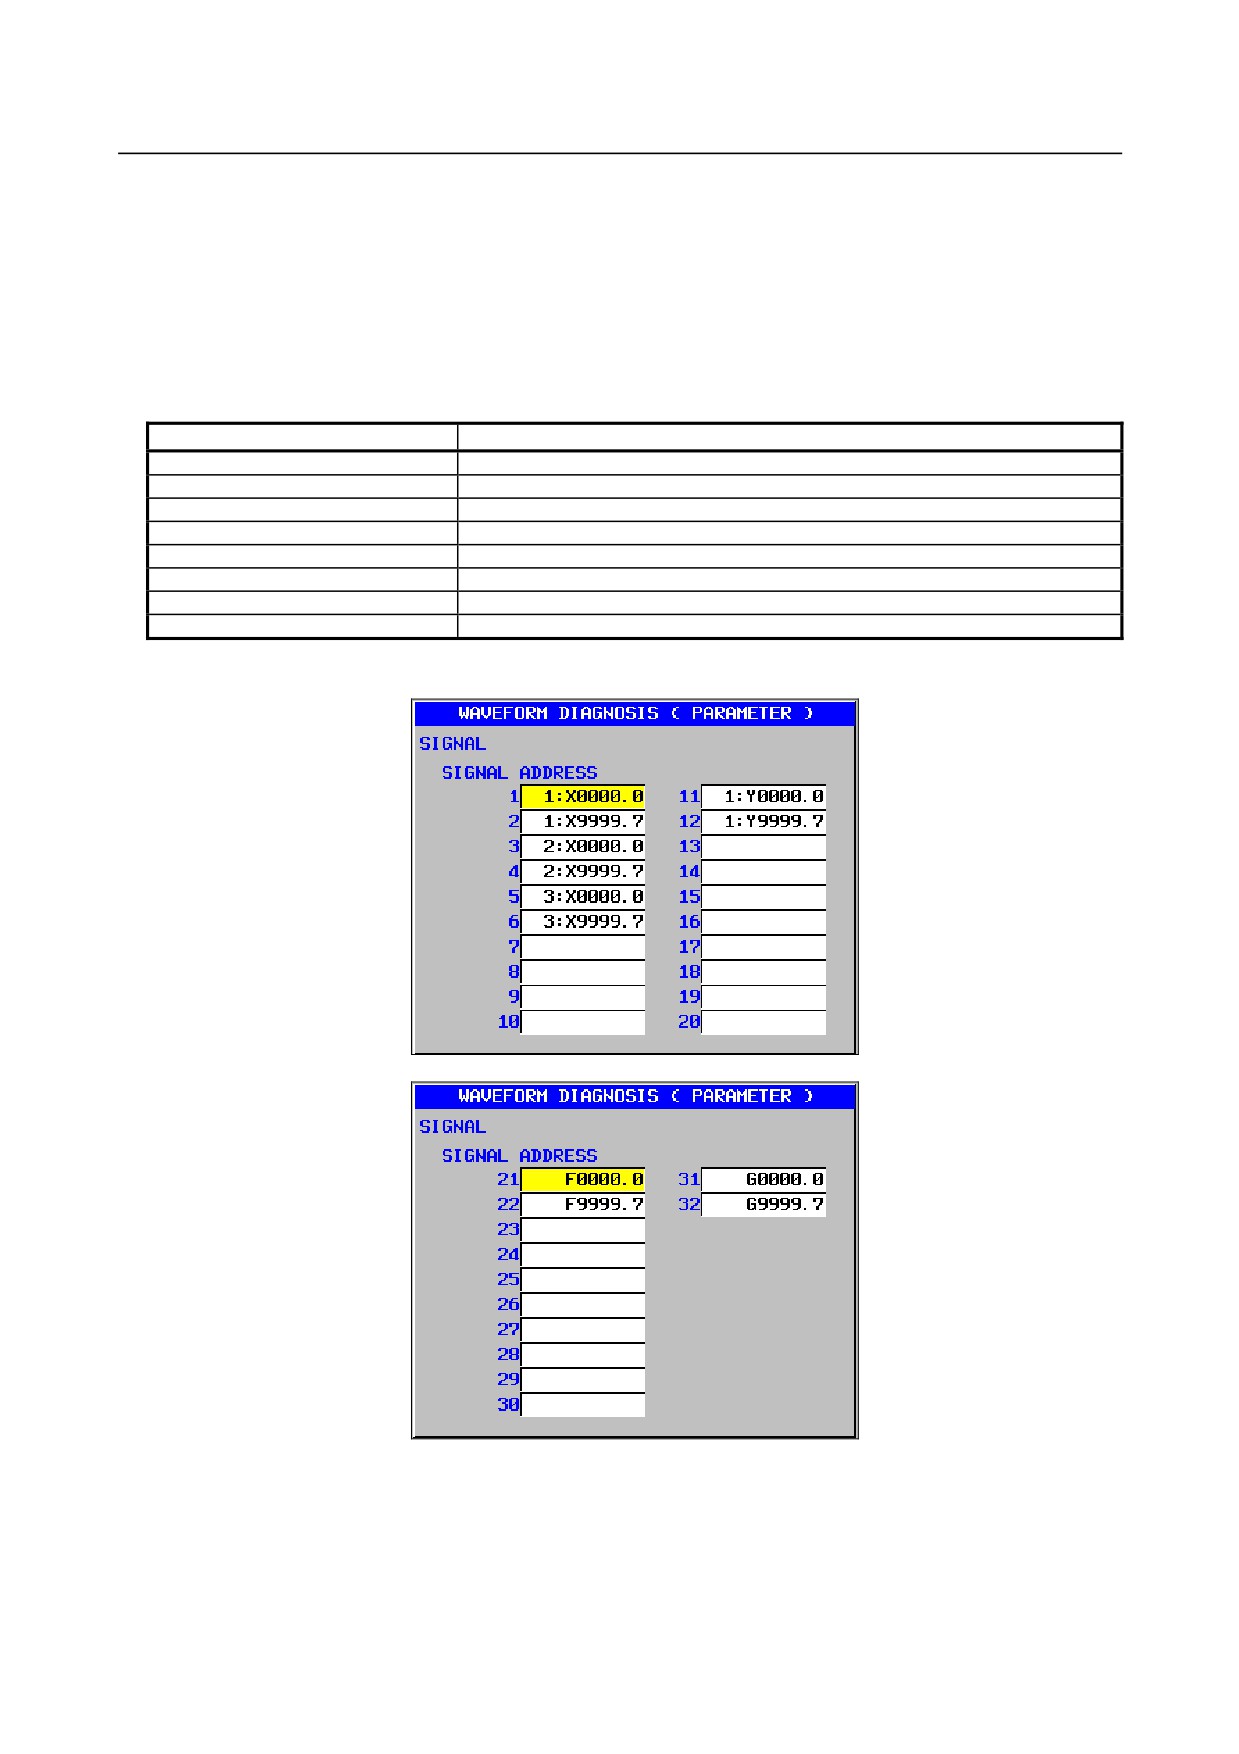
Signal address
When use of a signal as a trigger is specified for the trigger type (the trigger type is set to 2, 3, 4, 5, 6, or
7), enter the address of the signal used as the trigger.
With a multi-path PMC, an address on a PMC path is set by specifying the path number together with the
address.
Example: 2:F0001.1
As shown in the above example, set a PMC path number plus a colon (:) plus an address. With the
standard PMC, which has just one path, no path number needs to be specified.
NOTE
1 For PMC path numbers, refer to "Multi-Path PMC Function" in "FANUC Series
30i-MODEL B PMC Programming Manual" (B-64513EN).
2 If the keyboard used does not have the ":" key, use ";" or "/" instead of ":".
Waveform setting
- 54 -
B-64485EN/01
1.DISPLAY AND OPERATION
-
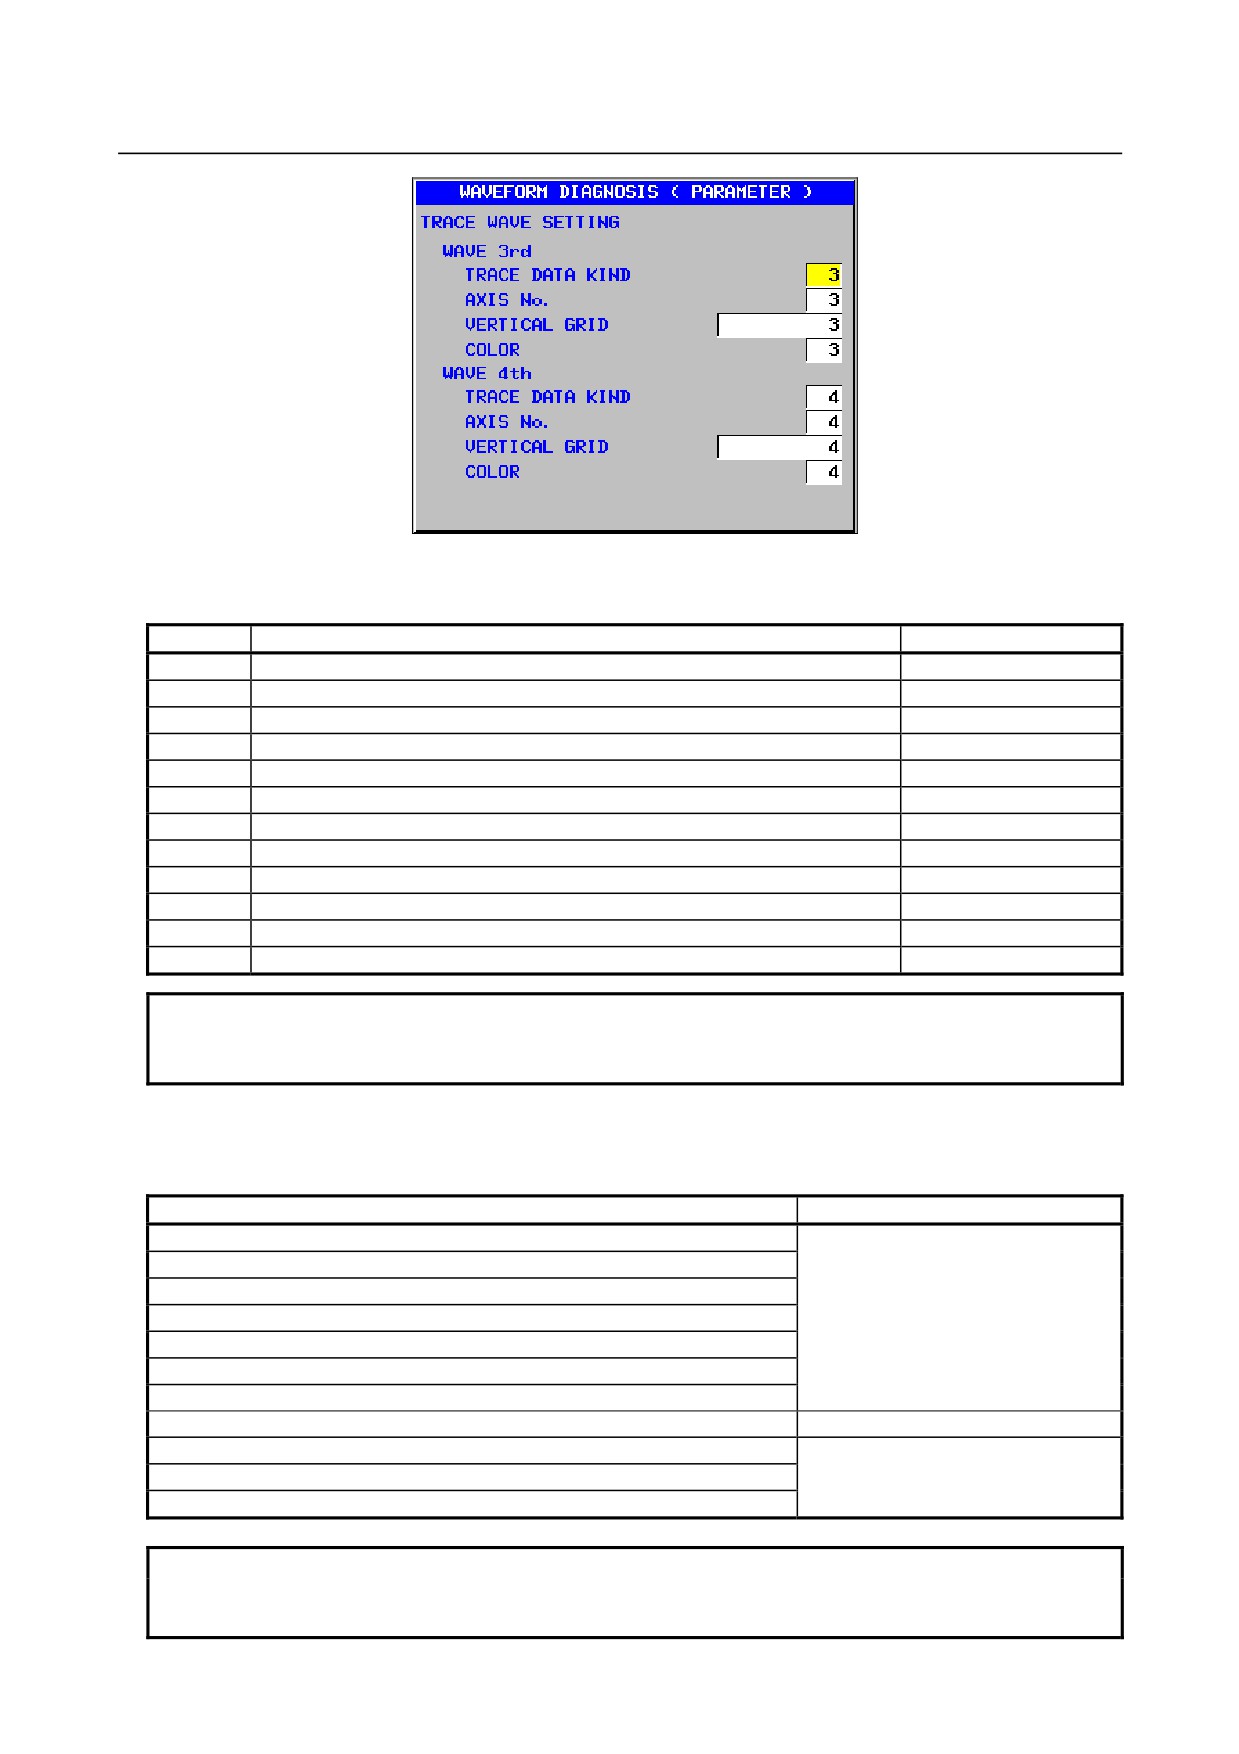
Trace data type
Set the type number of data to be traced as listed below:
Setting
Type
Unit
0
(Not traced)
1
Servo positional deviation
Pulse (detection unit)
2
Servo pulses after distribution
Pulse (detection unit)
3
Servo torque (actual current)
%
4
Servo pulses after acceleration/deceleration
Pulse (detection unit)
5
Actual servo speed
min-1
6
Servo current command value
%
7
Servo heat simulation data
%
8
Composite speed of all axes
mm/min or min-1
9
Spindle speed
min-1
10
Spindle load meter
%
11
Difference in spindle-converted positional deviation during rigid tapping
Pulse (detection unit)
NOTE
The servo torque (actual current) and current command value are represented
by percentages to parameter No. 2086 (rated current).
-
Axis number/path number
Specify an axis number or path number according to the type of data to be traced as follows:
Type
Setting
Servo positional deviation
Controlled axis number (1 to 32)
Servo pulses after distribution
Servo torque (actual current)
Servo pulses after acceleration/deceleration
Actual servo speed
Servo current command value
Servo heat simulation data
Composite speed of all axes
Path number (1 to 10)
Spindle speed
Controlled spindle number (1 to 8)
Spindle load meter
Difference in spindle-converted positional deviation during rigid tapping
NOTE
For multi-axis control, the axis number must be an absolute axis number instead
of a relative axis number in each path.
- 55 -
1.DISPLAY AND OPERATION
B-64485EN/01
-
Graduation unit on the axis
Set an increment per graduation on the vertical axis. This setting is valid for servo and spindle data.
Valid data range :
1 to 100000000
-
Waveform color
Set the number of a color to be used for drawing the waveform as listed below. The numbers represent
associated system colors.
Setting
Default drawing color(Associated system color)
0
Black (Data display color)
1
Red (Alarm display color)
2
Green (Title display color)
3
Yellow (Cursor display color)
4
Blue (Subtitle display color)
5
Purple (Input key display color)
6
Blue (Color selection window bar display color)
7
White (Background color for specifiable data)
Signal setting
-
Signal setting
When the ON/OFF state of an input/output signal is to be traced, set the address of the signal.
With a multi-path PMC, an address on a PMC path is set by specifying the path number together with the
address.
Example: 2:F0001.1
- 56 -
B-64485EN/01
1.DISPLAY AND OPERATION
As shown in the above example, set a PMC path number plus a colon (:) plus an address. With the
standard PMC, which has just one path, no path number needs to be specified.
NOTE
1 For PMC path numbers, refer to "Multi-Path PMC Function" in "PMC
Programming Manual" (B-64513EN).
2 If the keyboard used does not have the ":" key, use ";" or "/" instead of ":".
3 For signal data, even when just one signal address is input in an address 1 to
32, one channel is used.
4 When tracing is not performed, enter 0.
5 Up to 32 signals can be measured at the same time.
Guide to selecting items
-
Alarm type
1
When the soft key [(OPRT)] is pressed with the cursor positioned at the alarm type in the trigger
setting, the soft key [EXPLAIN] appears.
2
Pressing the soft key [EXPLAIN] displays a list of alarm types.
-
Data type
1
When the soft key [(OPRT)] is pressed with the cursor positioned at the trace data type in the trace
waveform setting, the soft key [EXPLAIN] appears.
2
Pressing the soft key [EXPLAIN] displays a list of trace data types.
- 57 -
1.DISPLAY AND OPERATION
B-64485EN/01
-
Waveform color
1
When the soft key [(OPRT)] is pressed with the cursor positioned at the waveform color in the trace
waveform setting, the soft key [EXPLAIN] appears.
2
Pressing the soft key [EXPLAIN] displays a list of waveform colors
1.6.3
Tracing Data
Starting tracing
1
Display the waveform diagnosis graph screen.
2
Press the soft key [TRACE] to start tracing.
"Now Sampling…" appears in the upper part of the screen. When tracing ends, the indication "Now
Sampling…" disappears.
Even when the screen display is changed to another screen, tracing continues.
Canceling tracing
When the soft key [CANCEL] is pressed during tracing, tracing stops.
- 58 -
B-64485EN/01
1.DISPLAY AND OPERATION
Moving, extending, and reducing a waveform
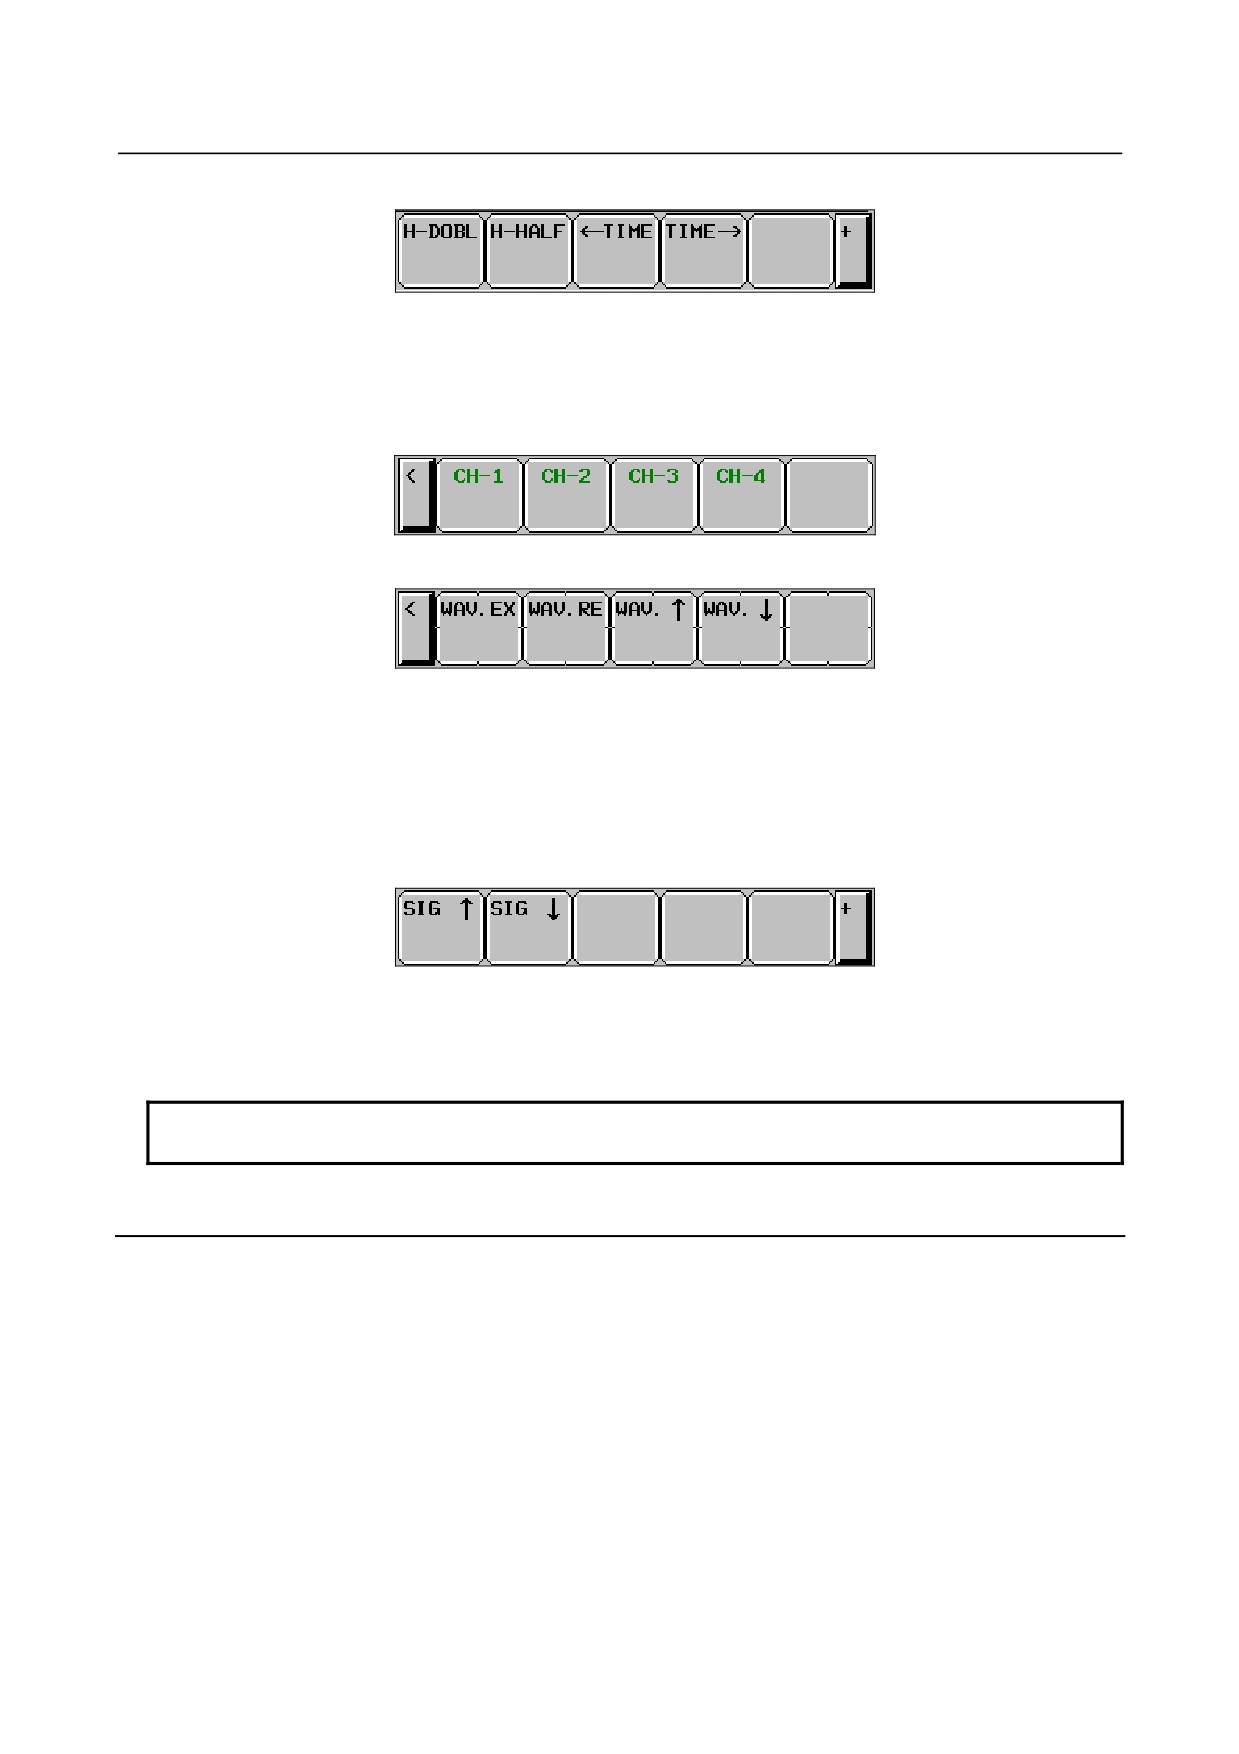
When soft key [H-DOBL] or [H-HALF] is pressed, the length of the time axis on one screen is extended
or reduced, respectively.
When a waveform cannot fit in one screen, the time axis can be moved by pressing soft key [←TIME] or
[TIME→].
Furthermore, pressing [CH-1], [CH-2], [CH-3], or [CH-4], a submenu appears.
When soft key [WAVE.EX] or [WAVE.RE] is pressed, the length of the time axis on one screen is
extended or reduced, respectively. The graduation unit on the horizontal axis, which is a parameter, also
changes automatically.
The graduation unit changes from 1 to 2 to 5 to 10 to 20 to 50 to 100, and so on.
When soft key [WAVE.↑] or [WAVE.↓] is pressed, each waveform of servo and spindle data can be
moved upward or downward.
Displaying signal data
Up to 32 signals can be measured at the same time. Up to nine signals can be displayed at the same time if
only signal data is displayed, or up to four signals can be displayed if signal data is displayed over
waveforms.
When soft key [SIG.↑] or [SIG.↓] is pressed, the currently displayed signals are changed.
NOTE
Signal data cannot be moved.
1.6.4
Outputting Data
Waveform diagnosis data can be output to an input/output device.
Specifying a format
When outputting data, you can select one of the two formats, which are the FS16i compatible format
(called the 16 compatible format hereinafter) and the FS30i format (called the 30 format hereinafter). If
bit 0 (IOF) of parameter No. 10600 is set to 0, the 30 format is selected; if bit 0 (IOF) of parameter No.
10600 is set to 1, the 16 compatible format is selected.
Output format
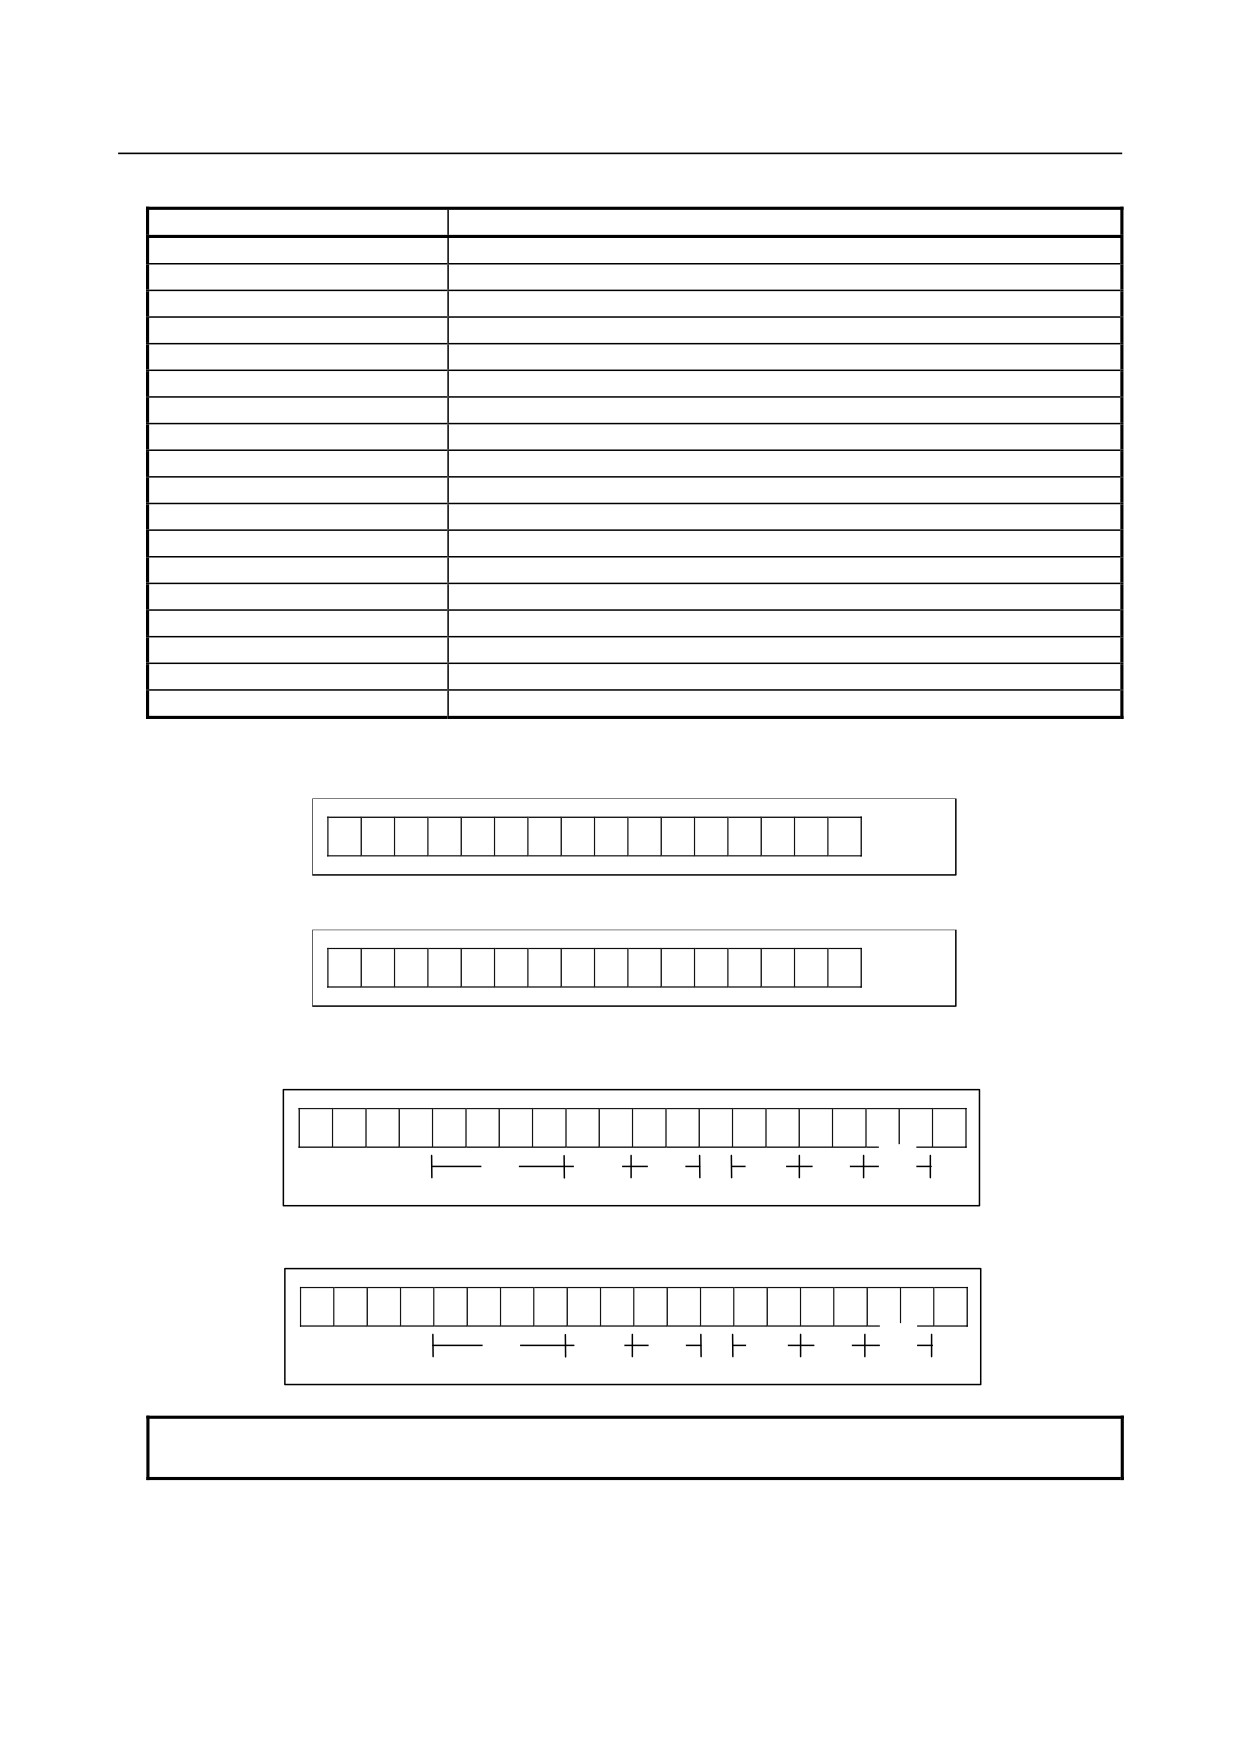
Traced data is input or output as a text file with the following format:
- 59 -
1.DISPLAY AND OPERATION
B-64485EN/01
-
Identifiers
Identifier word (T)
Meaning
T0/T1
Header
T60
Servo positional deviation
T61
Servo pulses after distribution
T62
Servo torque (actual current)
T63
Actual servo speed
T64
Servo current command value
T65
Servo heat simulation data
T68
Measurement item
T69
Date and time (start of measurement)
T70
Servo pulses after acceleration/deceleration
T75
Composite speed of all axes
T80
Spindle speed
T81
Spindle load meter
T82
Difference in spindle-converted positional deviation during rigid tapping
T90
Measurement period (waveform)
T91
Measurement period (signal)
T92
Date and time (end of measurement)
T98
Signal data
(1)
Header
30 format
T
1
C
W
A
V
E
D
I
A
G
N
O
S
;
16 compatible format
T
0
C
W
A
V
E
D
I
A
G
N
O
S
;
(2)
Date and time of start/end of tracing
-
Starting date and time
T
6
9
D
,
;
Year
Month
Day
Hour
Min
Sec
-
Ending date and time
T
9
2
D
,
*
*
*
*
;
Year
Month
Day
Hour
Min
Sec
NOTE
The ending date and time is output only in the 30 format.
- 60 -
B-64485EN/01
1.DISPLAY AND OPERATION
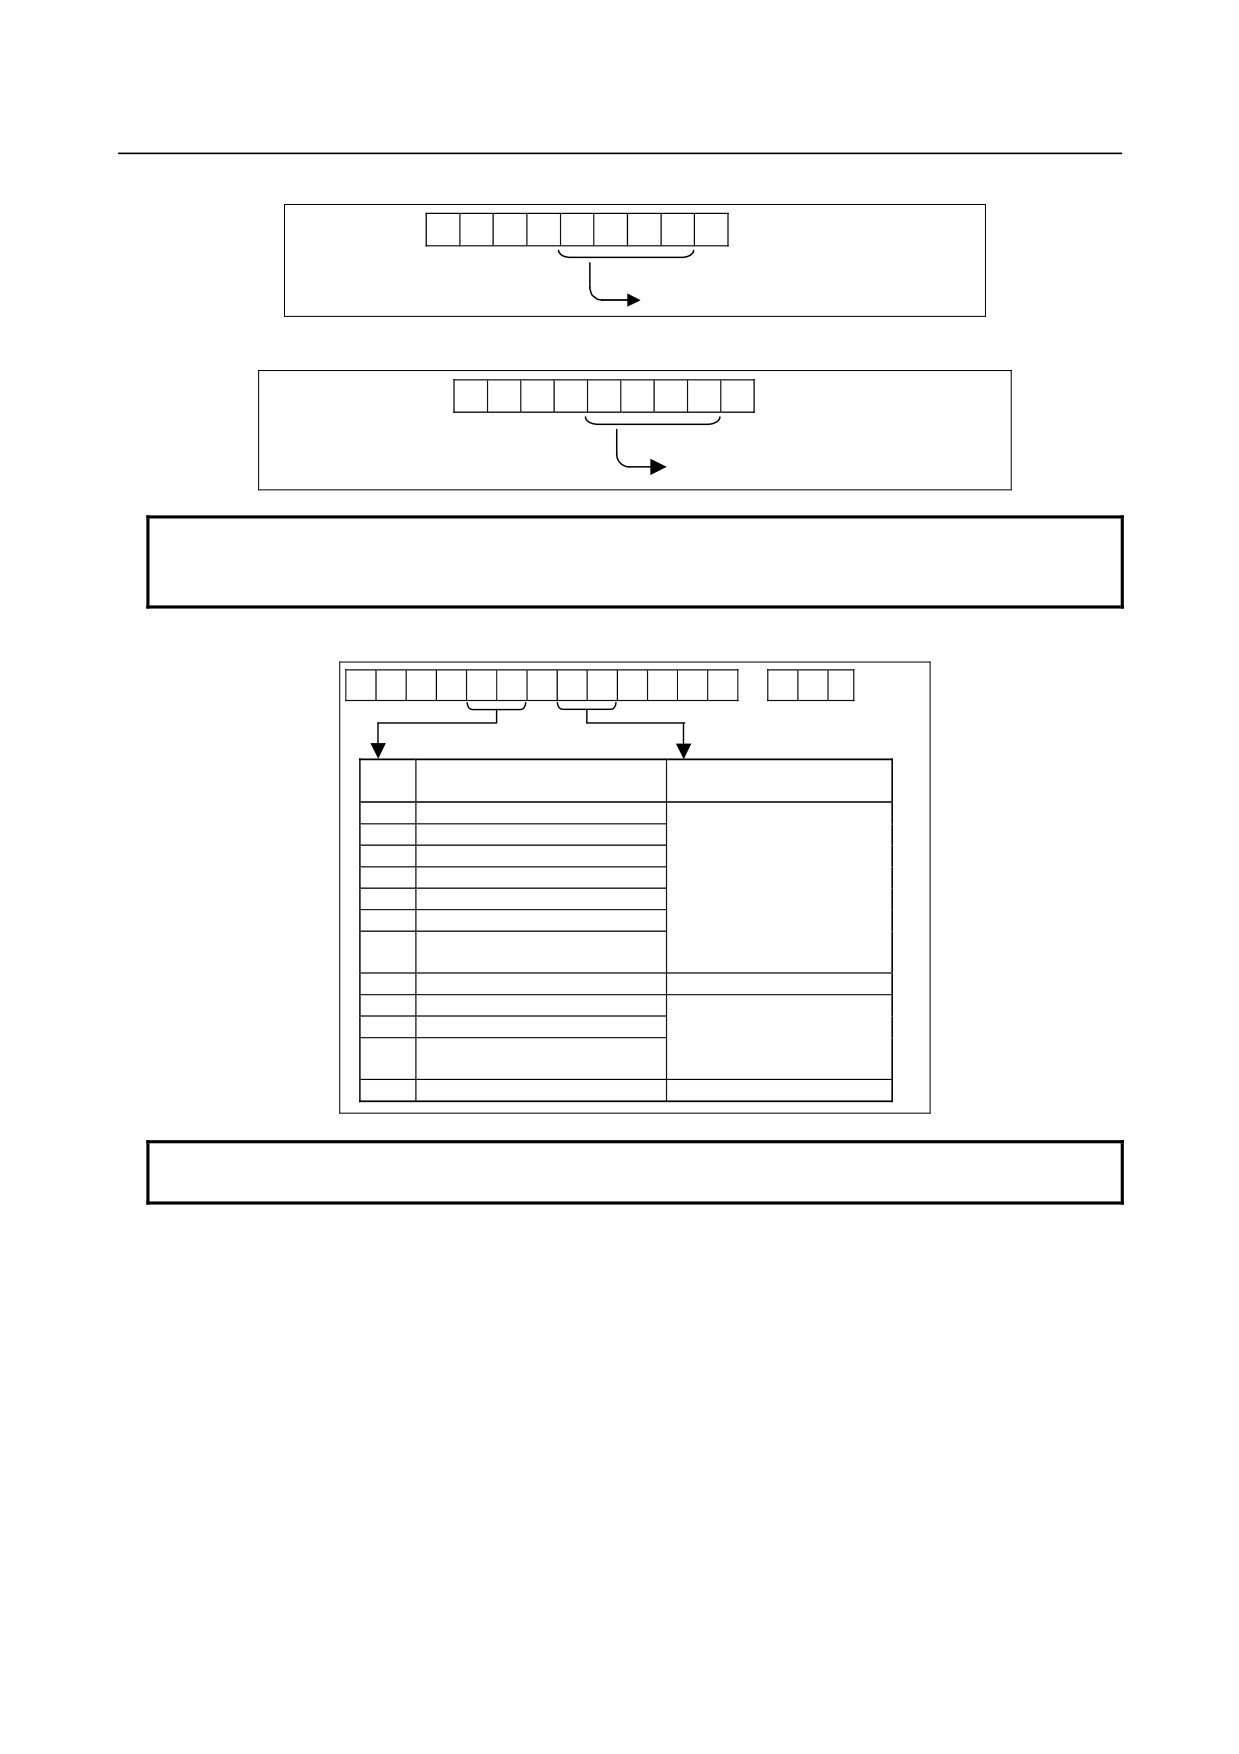
(3) Waveform sampling cycle
T
9
0
D
;
Waveform sampling cycle
(4) Signal sampling cycle
T
9
1
D
;
Signal sampling period
NOTE
The waveform sampling cycle and signal sampling cycle are output only in the
30 format.
(5) Selection items
T
6
8
P
D
,
,
~
;
Measurement item
Axis No./path
No./signal address
P0
Servo positional deviation
Controlled axis number
P1
Servo pulses after distribution
(1 to 32)
P2
Servo torque
P3
Actual servo speed
P4
Servo current command value
P5
Servo heat simulation data
P6
Servo pulses after
acceleration/deceleration
P10
Composite speed of all axes
Path number (1 to 10)
P20
Spindle speed
Controlled spindle
P21
Spindle load meter
number
P22
Difference in spindle-convert
(1 to 8)
positional deviation
P30
Signal
Signal address
NOTE
Items P6 to P30 are output only in the 30 format.
- 61 -
1.DISPLAY AND OPERATION
B-64485EN/01
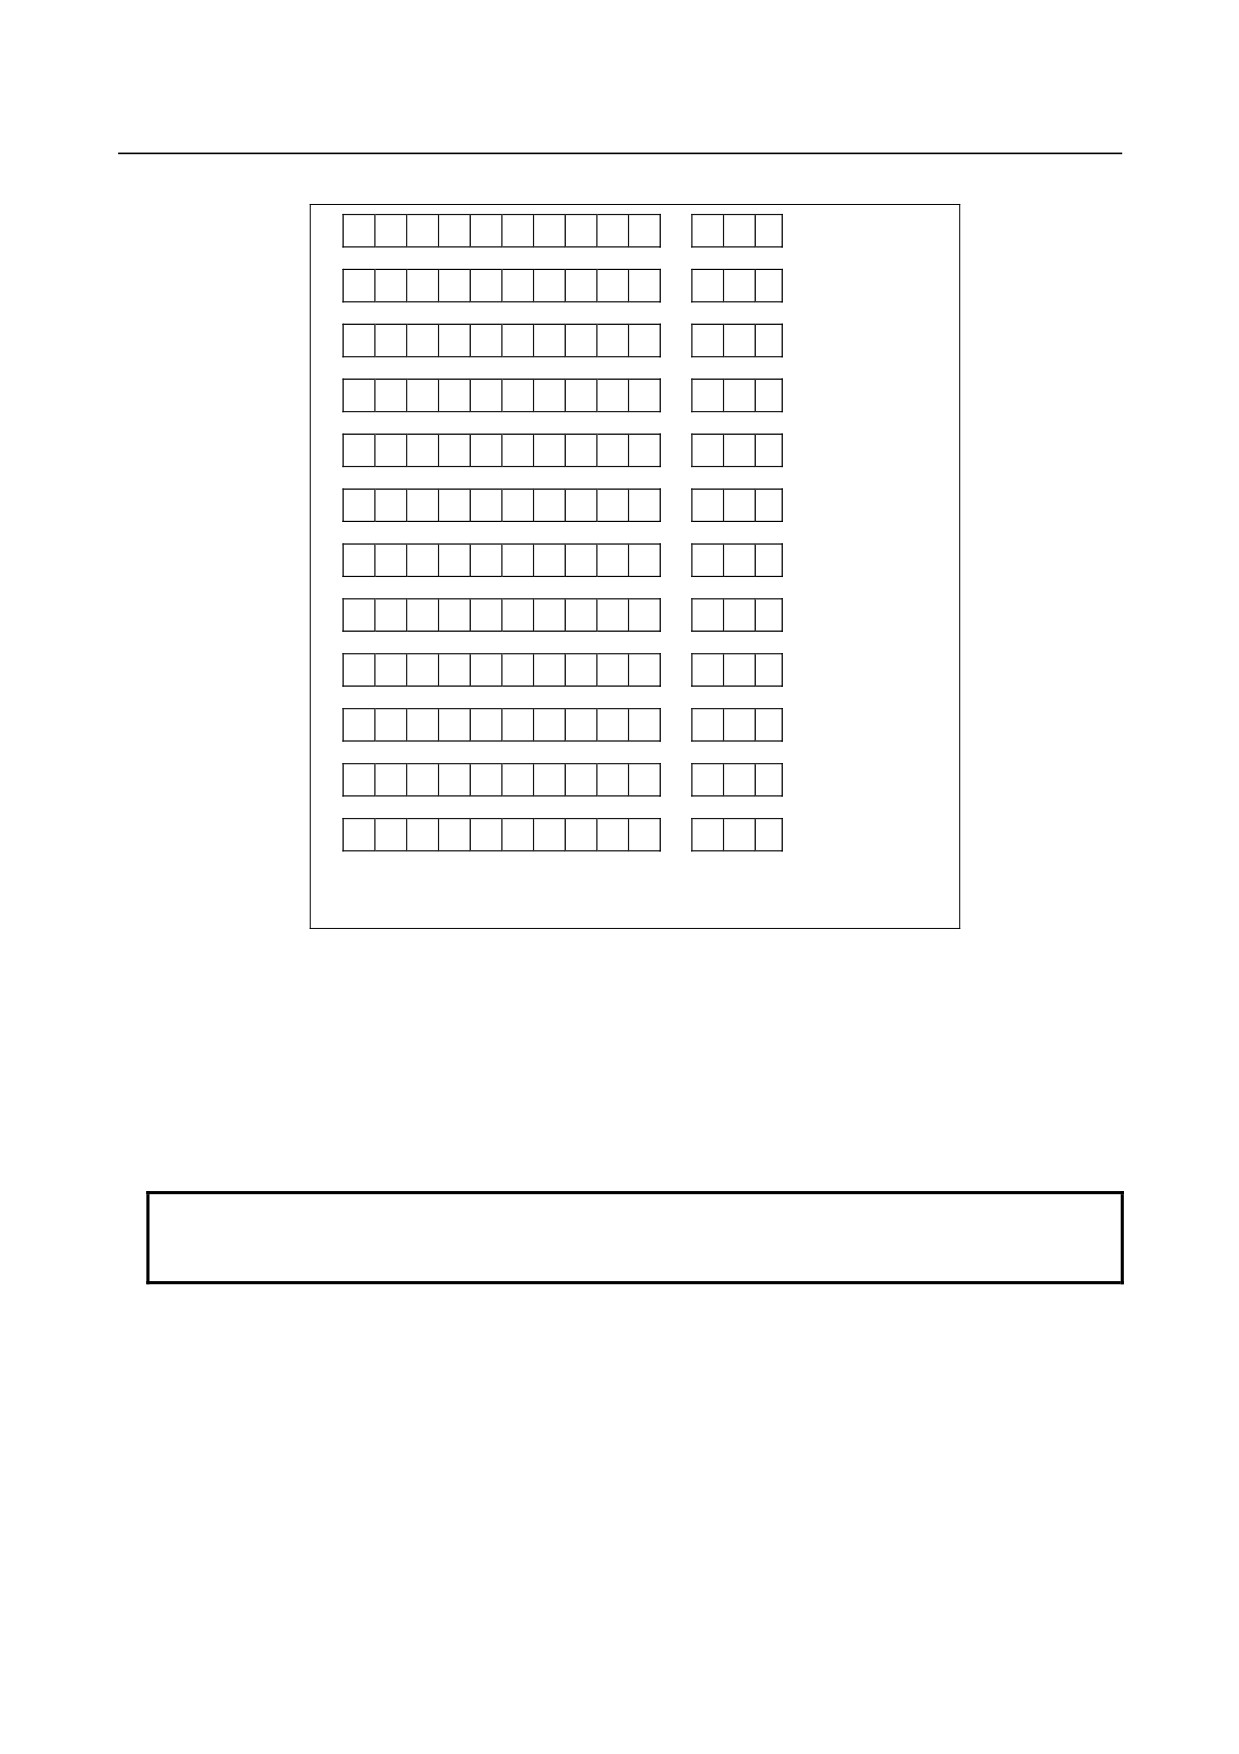
(6) Waveform diagnosis data
T
6
0
D
,
,
~
;
T
6
1
D
,
,
~
;
T
6
2
D
,
,
~
;
T
6
3
D
,
,
~
;
T
6
4
D
,
,
~
;
T
6
5
D
,
,
~
;
T
7
0
D
,
,
~
;
T
7
5
D
,
,
~
;
T
8
0
D
,
,
~
;
T
8
1
D
,
,
~
;
T
8
2
D
,
,
~
;
T
9
8
D
,
,
~
;
D** ~ ** : Waveform diagnosis data × No. of axes/No. of
paths/No. of signals
Blocks are output in the following order:
Header
(16 compatible/30 format)
Date and time (start of measurement)
(16 compatible/30 format)
Date and time (end of measurement)
(30 format only)
Waveform measurement period
(30 format only)
Signal measurement period
(30 format only)
Selection item
(16 compatible/30 format)
Waveform diagnosis data
(16 compatible/30 format)
NOTE
Signal data of waveform diagnosis data is output after all waveform data is
output.
- 62 -
B-64485EN/01
1.DISPLAY AND OPERATION
-
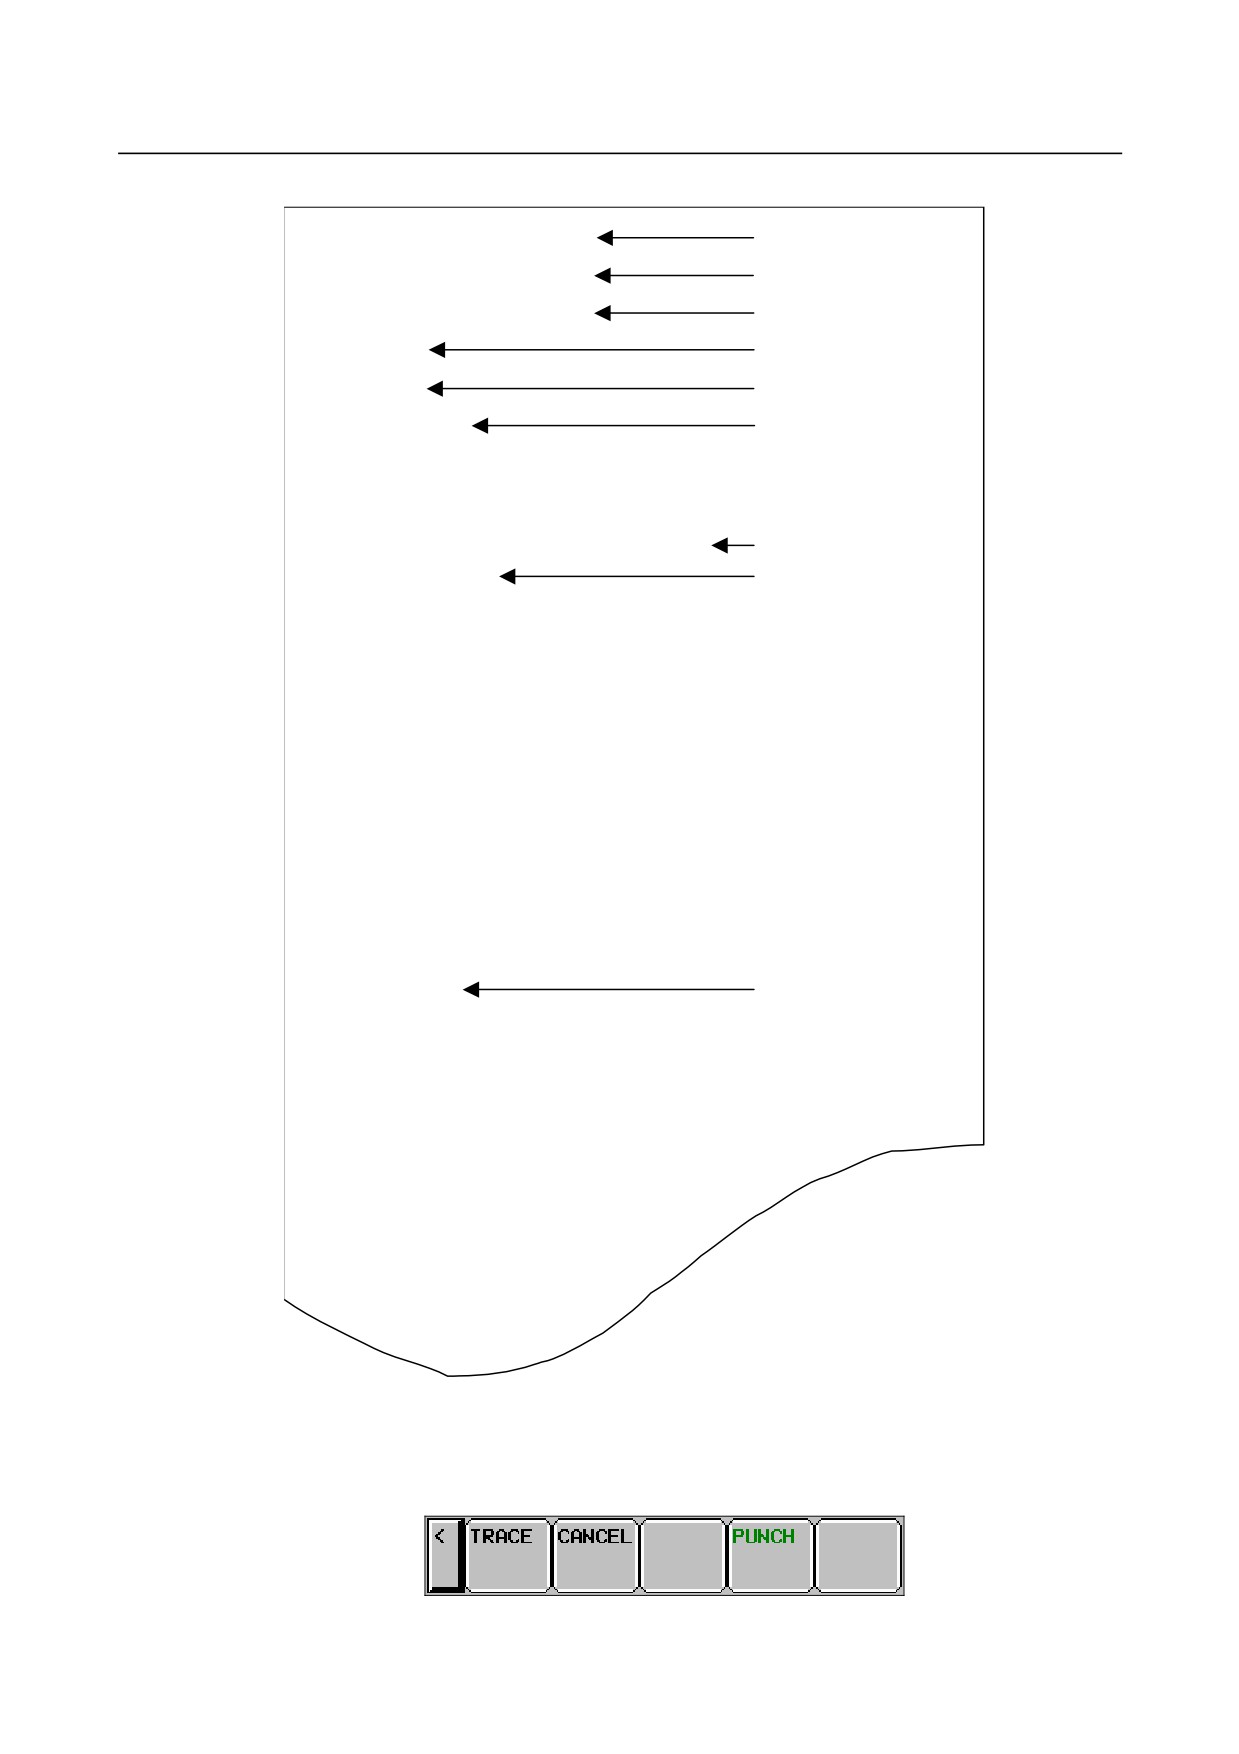
Sample file
T01WAVE DIAGNOSE
Header
T69D20040101,120125
Start time
T92D20040101,120130
End time
T90D2
Waveform period
T91D4
Signal period
T68P0D1,2
Measurement item/axis
T68P4D1
T68P10D1
T68P30DG0010.4,G0010.5,G0010.6
Measurement item/signal
T60D643,6420
Waveform data
T64D270
T75D1855
T60D673,6451
T64D265
T75D1855
T60D702,6480
T64D268
T75D1855
:
T75D1855
T98D0,0,1
Signal data
T98D0,0,1
T98D0,0,1
:
Outputting a file
1
Display the waveform diagnosis graph screen.
2
When the [(OPRT)] operation soft key is pressed, soft keys are displayed in the following operation
selection state:
- 63 -
1.DISPLAY AND OPERATION
B-64485EN/01
3
Change the mode to the EDIT mode.
4
Enter a file name in the key-in buffer, and press the soft key [PUNCH]. If no file name is input, the
file name is assumed to be WAVE-DGN.TXT by default.
5
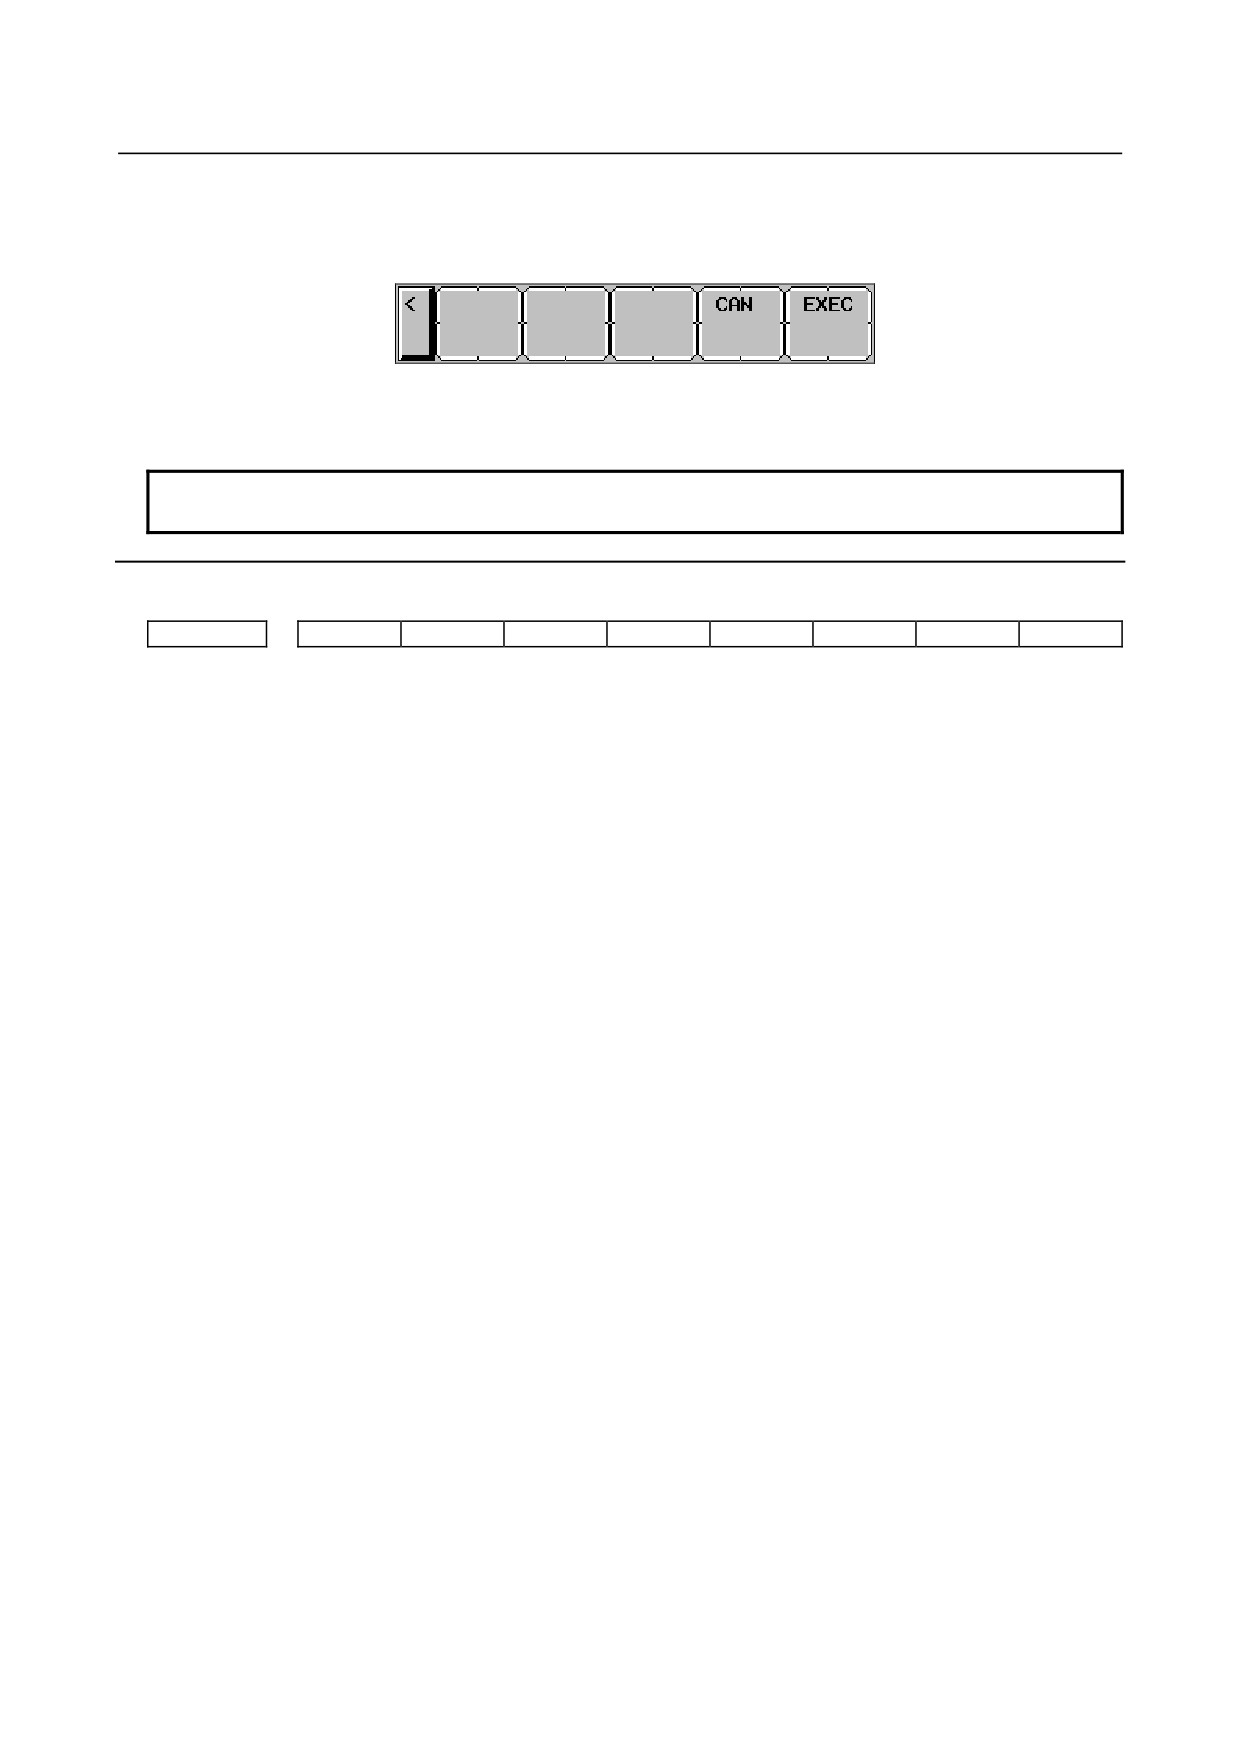
Press the soft key [EXEC] shown below to start outputting data:
6
When data output ends, or when the soft key [CAN] is pressed, the initial operation selection state is
restored.
NOTE
While data is being traced, data output is not allowed.
Parameter
#7
#6
#5
#4
#3
#2
#1
#0
10600
IOF
[Input type] Parameter input
[Type of data] Bit
#0 IOF The output format used for waveform diagnosis is:
0:
30i /31i /32i format (30 format).
1:
16i /18i /21i format (16 compatible format).
- 64 -
B-64485EN/01
1.DISPLAY AND OPERATION
1.7
COLOR SETTING SCREEN
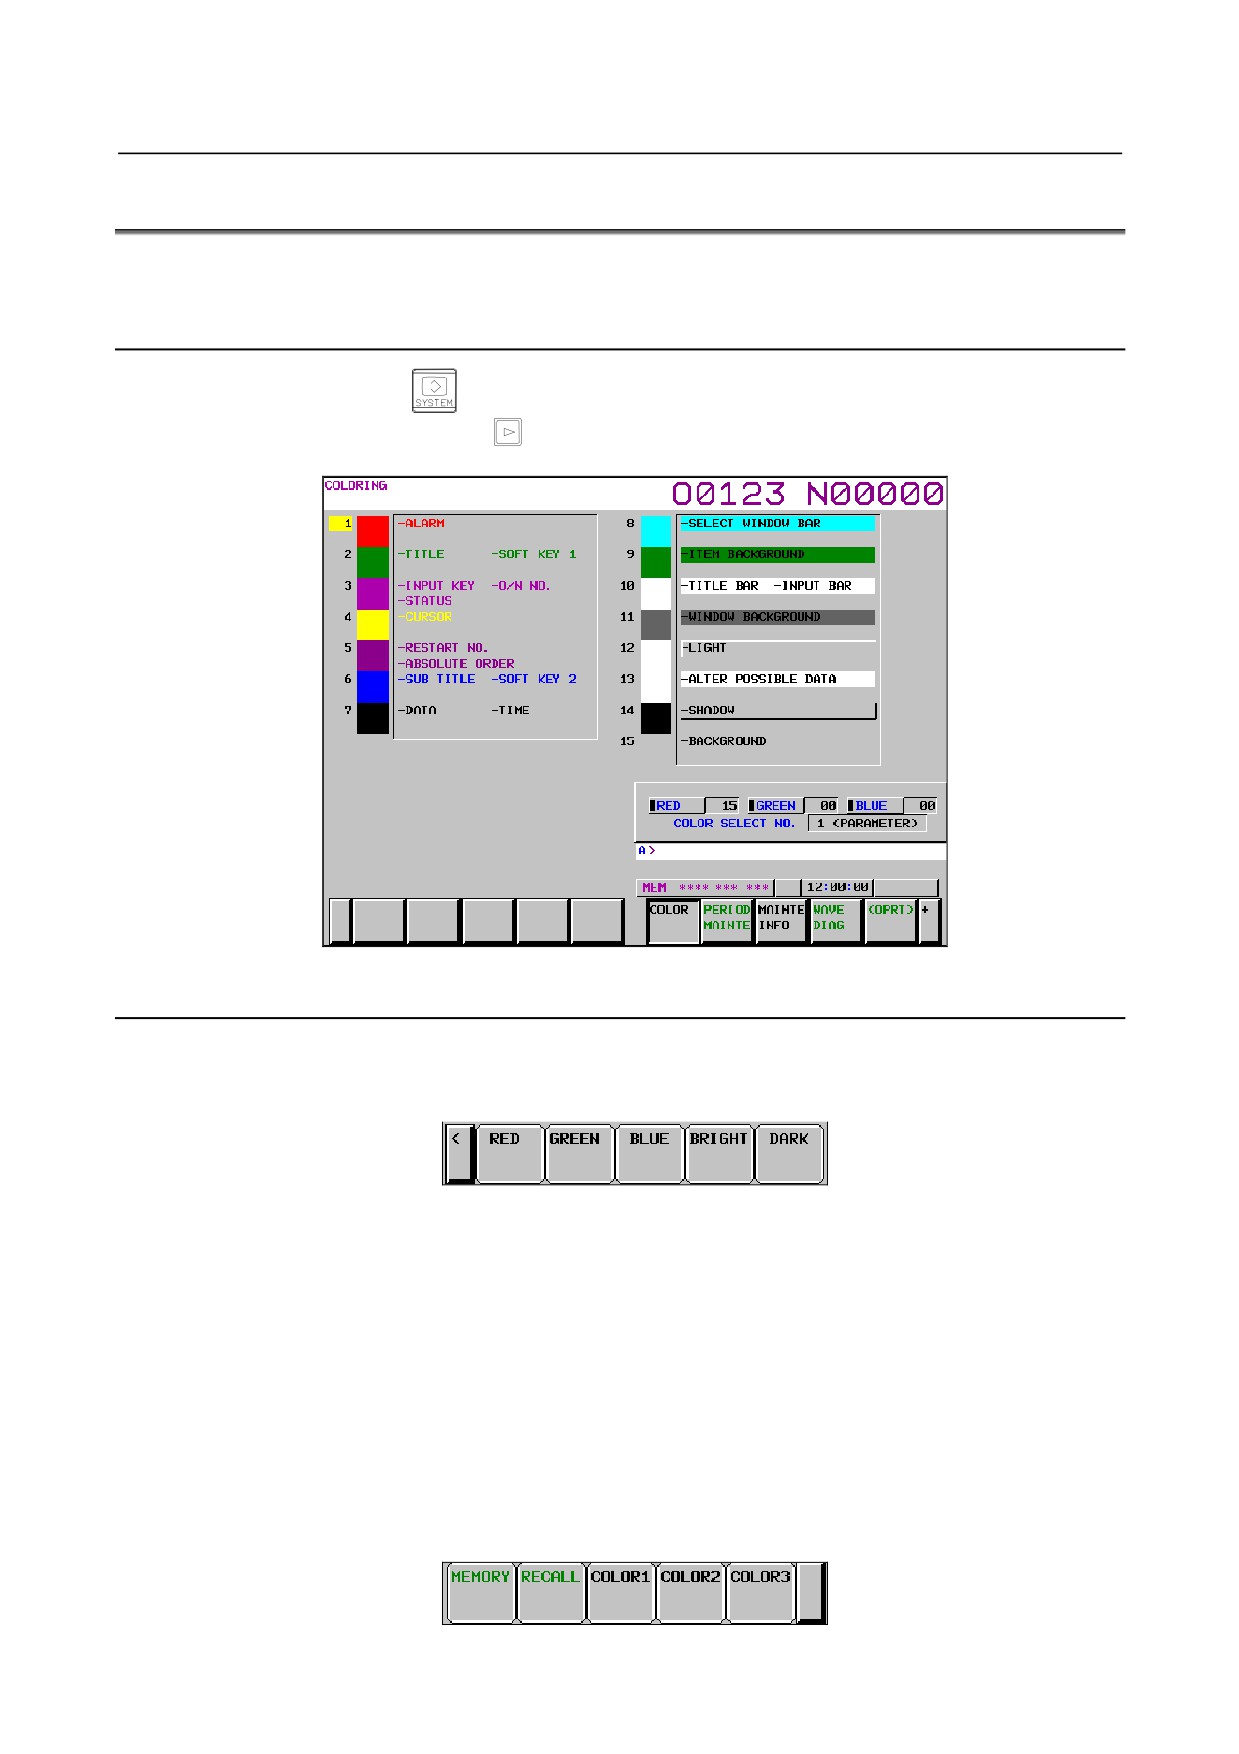
On the color setting screen, the colors of the VGA screen can be set.
1.7.1
Screen Display
1
Press the function key
2
Press the continuous menu key
several times until the soft key [COLOR] is displayed.
3
Pressing the soft key [COLOR] displays the color setting screen.
1.7.2
Operations for Color Setting
Modification to color settings (color palette values)
1
Pressing the soft key [(OPRT)] displays the following operation soft keys:
2
Move the cursor to a color number whose color palette values are to be modified.
The current color palette values of the individual color elements are displayed.
3
Select a color element to be modified, with the soft key [RED], [GREEN], or [BLUE].
Multiple color elements can be selected at a time.
Each of the soft keys [RED], [GREEN], and [BLUE] toggles between selection and deselection each
time the soft key is pressed.
(The soft keys [RED], [GREEN], and [BLUE], when not displayed, can be displayed by pressing the
rightmost soft key.)
4
By pressing the operation soft key [BRIGHT] or [DARK], modify the brightness of the selected
color element.
Storing color settings (color palette values)
Set color palette values can be stored.
- 65 -
1.DISPLAY AND OPERATION
B-64485EN/01
1
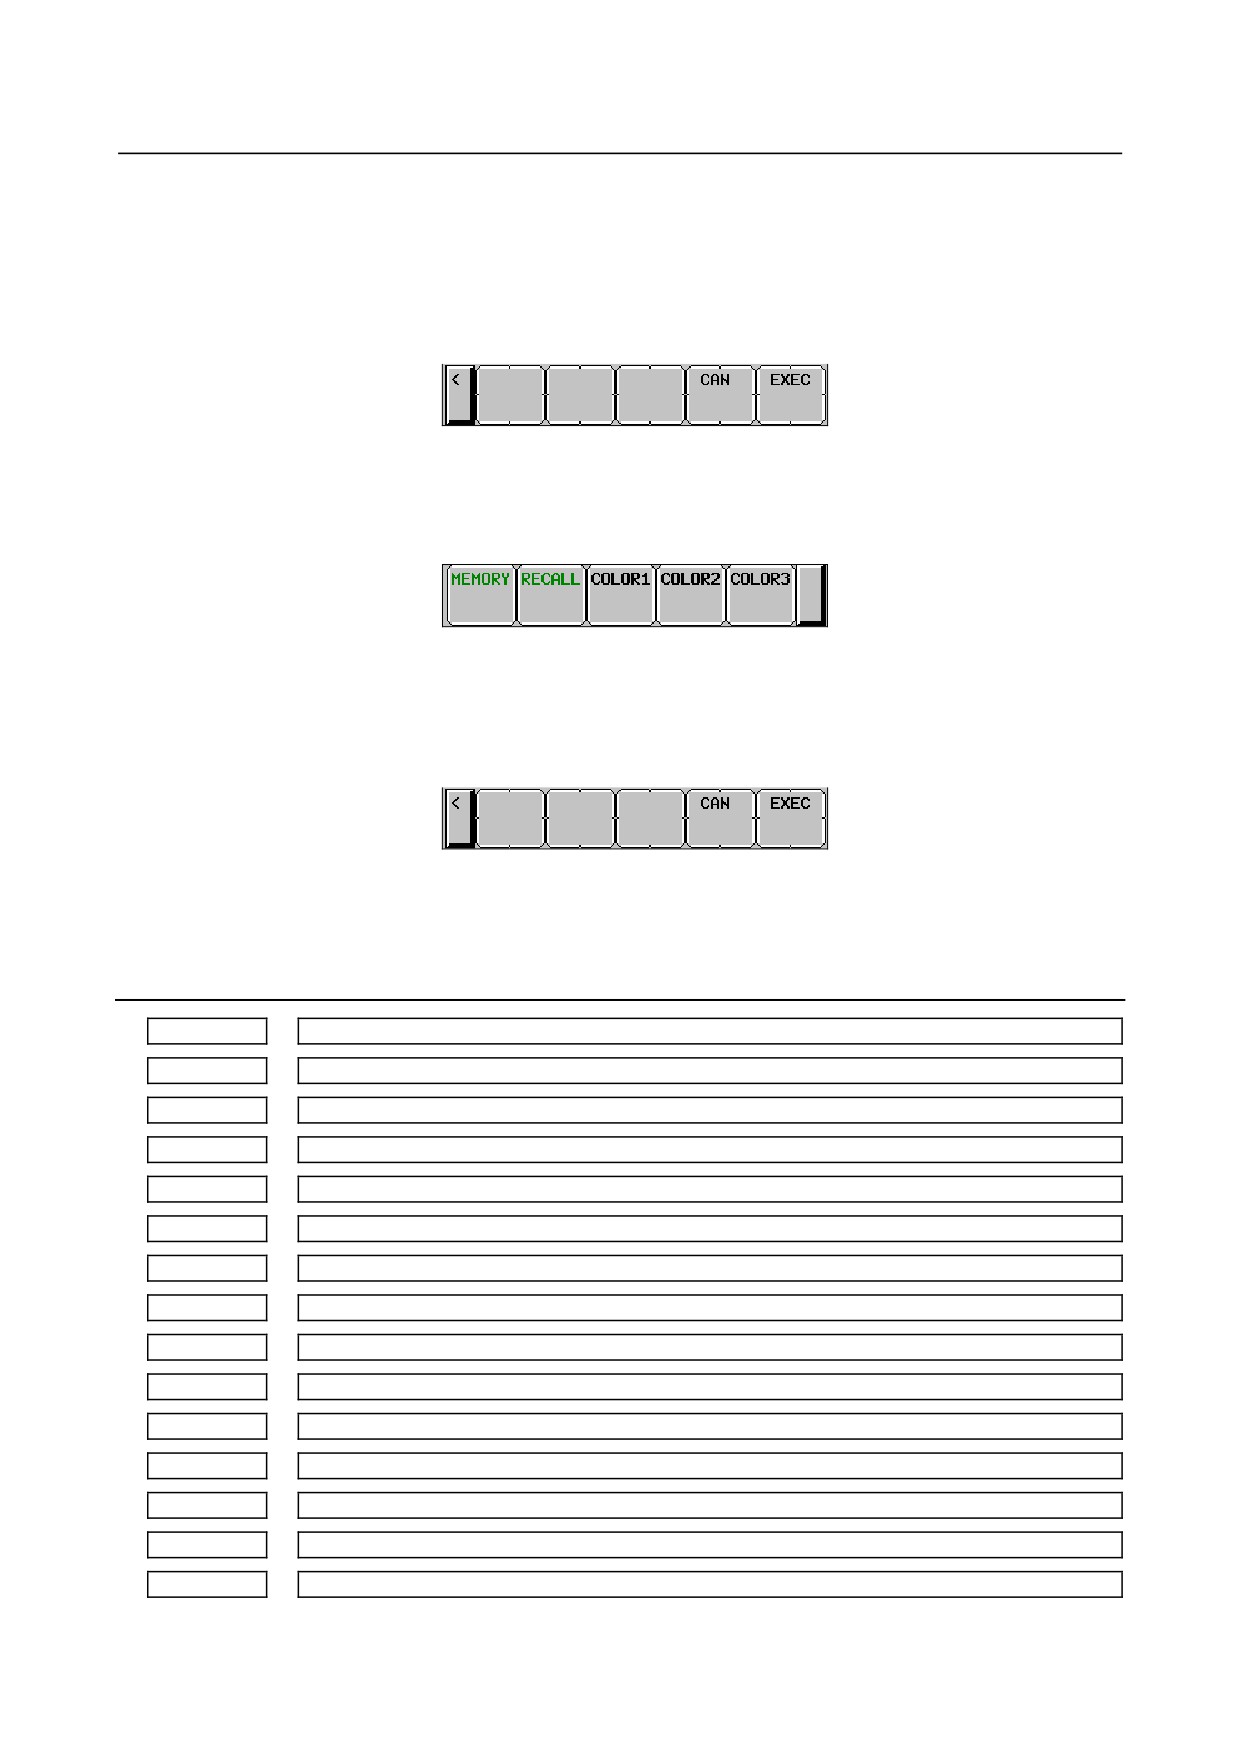
Select a storage area by pressing the [COLOR1], [COLOR2], or [COLOR3] operation soft key.
Color 1 Color 1 (standard color) data parameters Nos. 6581 to 6595
Color 2 Color 2 data parameters Nos. 10421 to 10435
Color 3 Color 3 data parameters Nos. 10461 to 10475
2
Press the operation soft key [STORE]. The following operation soft keys are displayed:
3
Press the operation soft key [EXEC]. The current color palette values are stored in the selected area.
Pressing the operation soft key [CAN] or the leftmost key does not store the current color palette
values.
Calling color settings (color palette values)
1
Select an area for storing color palette values by pressing the operation soft key [COLOR1],
[COLOR2], or [COLOR3].
(The soft keys [COLOR1], [COLOR2], and [COLOR3], when not displayed, can be displayed by
pressing the rightmost soft key.)
2
Press the [RECALL] operation soft key. The following operation soft keys are displayed:
3
Press the operation soft key [EXEC]. Color palette values are called from the selected area for
modification to the color settings. This operation is invalid if no color palette values are stored.
Pressing the operation soft key [CANCEL] or the leftmost key does not call color palette values.
1.7.3
Parameter
6581
RGB value of color palette 1 for color set 1
6582
RGB value of color palette 2 for color set 1
6583
RGB value of color palette 3 for color set 1
6584
RGB value of color palette 4 for color set 1
6585
RGB value of color palette 5 for color set 1
6586
RGB value of color palette 6 for color set 1
6587
RGB value of color palette 7 for color set 1
6588
RGB value of color palette 8 for color set 1
6589
RGB value of color palette 9 for color set 1
6590
RGB value of color palette 10 for color set 1
6591
RGB value of color palette 11 for color set 1
6592
RGB value of color palette 12 for color set 1
6593
RGB value of color palette 13 for color set 1
6594
RGB value of color palette 14 for color set 1
6595
RGB value of color palette 15 for color set 1
- 66 -
B-64485EN/01
1.DISPLAY AND OPERATION
[Data type] 2-word
[Unit of data] rrggbb 6-digit number
(rr: Red data, gg: Green data, bb: Blue data)
When a number shorter than 6 digits is specified, the unspecified higher digit or digits are
treated as 0.
[Valid data range] 00 to 15 for each color data (same as the tone level on the color setting screen)
When a value equal to or greater than 16 is specified, the specification of 15 is assumed.
(Example) When setting the color tone level as red = 1, green = 2, and blue = 3, specify "10203".
10421
RGB value of color palette 1 for color set 2
10422
RGB value of color palette 2 for color set 2
10423
RGB value of color palette 3 for color set 2
10424
RGB value of color palette 4 for color set 2
10425
RGB value of color palette 5 for color set 2
10426
RGB value of color palette 6 for color set 2
10427
RGB value of color palette 7 for color set 2
10428
RGB value of color palette 8 for color set 2
10429
RGB value of color palette 9 for color set 2
10430
RGB value of color palette 10 for color set 2
10431
RGB value of color palette 11 for color set 2
10432
RGB value of color palette 12 for color set 2
10433
RGB value of color palette 13 for color set 2
10434
RGB value of color palette 14 for color set 2
10435
RGB value of color palette 15 for color set 2
[Data type] 2-word
[Unit of data] rrggbb 6-digit number
(rr: Red data, gg: Green data, bb: Blue data)
When a number shorter than 6 digits is specified, the unspecified higher digit or digits are
treated as 0.
[Valid data range] 00 to 15 for each color data (same as the tone level on the color setting screen)
When a value equal to or greater than 16 is specified, the specification of 15 is assumed.
(Example) When setting the color tone level as red = 1, green = 2, and blue = 3, specify "10203".
10461
RGB value of color palette 1 for color set 3
10462
RGB value of color palette 2 for color set 3
10463
RGB value of color palette 3 for color set 3
10464
RGB value of color palette 4 for color set 3
10465
RGB value of color palette 5 for color set 3
10466
RGB value of color palette 6 for color set 3
10467
RGB value of color palette 7 for color set 3
10468
RGB value of color palette 8 for color set 3
10469
RGB value of color palette 9 for color set 3
- 67 -
1.DISPLAY AND OPERATION
B-64485EN/01
10470
RGB value of color palette 10 for color set 3
10471
RGB value of color palette 11 for color set 3
10472
RGB value of color palette 12 for color set 3
10473
RGB value of color palette 13 for color set 3
10474
RGB value of color palette 14 for color set 3
10475
RGB value of color palette 15 for color set 3
[Data type] 2-word
[Unit of data] rrggbb 6-digit number
(rr: Red data, gg: Green data, bb: Blue data)
When a number shorter than 6 digits is specified, the unspecified higher digit or digits are
treated as 0.
[Valid data range] 00 to 15 for each color data (same as the tone level on the color setting screen)
When a value equal to or greater than 16 is specified, the specification of 15 is assumed.
[Example] When setting the color tone level as red = 1, green = 2, and blue = 3, specify "10203".
1.7.4
Notes
(1) Immediately after the power is turned on, color 1 is used as the screen color.
If no color palette values are stored in color 1, the FANUC standard color is used for display.
(2) Do not modify the parameters of the standard color data by direct MDI key input. When modifying
the parameters of the RGB value, be sure to perform a storage operation on the color setting screen.
(3) If the screen display becomes invisible because an incorrect value is input in an RGB value
parameter, turn off the power then turn on the power again while holding down the
+
keys. All stored color data is cleared, and the screen is displayed in the FANUC standard color.
This operation, however, clears all contents of the memory including parameters and programs. Take
special care when performing this operation.
1.8
POWER MATE CNC MANAGER FUNCTION
When the I/O Link Option for the FANUC servo unit βi series (called I/O Link βi below) is used for CNC
additional axes (slaves), the Power Mate CNC manager function can be used to display and set up various
types of data of these slaves on the CNC.
The Power Mate CNC manager function enables the following display and setting operations:
(1) Current position display (absolute/machine coordinates)
(2) Parameter display and setting
(3) Alarm display
(4) Diagnosis data display
(5) System configuration screen display
Up to eight slaves can be connected to each I/O Link channel.
- 68 -
B-64485EN/01
1.DISPLAY AND OPERATION
1.8.1
Screen Display
1
Press the function key
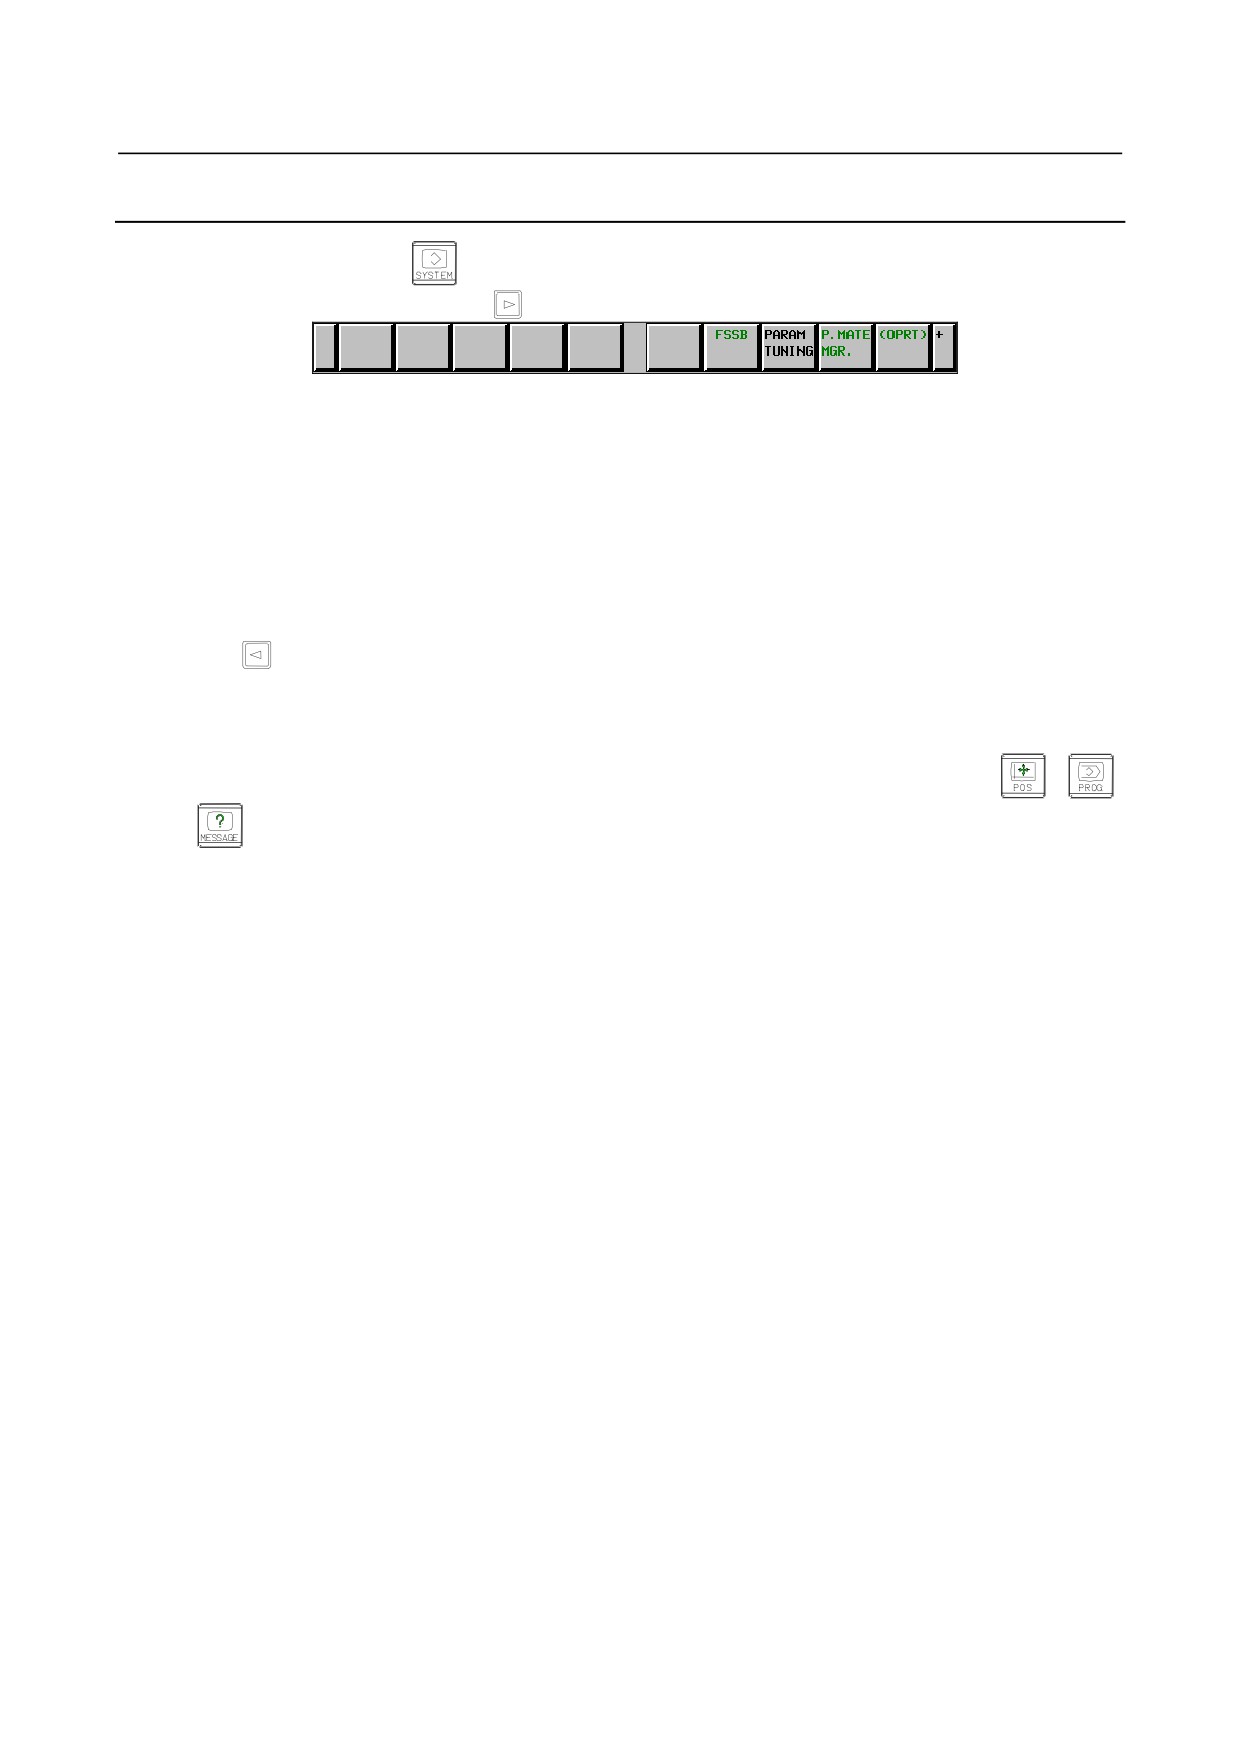
2
Press the continuous menu key
several times until the soft key [P.MATE MGR.] is displayed.
3
Pressing the soft key [P.MATE MGR.] displays the absolute coordinate screen, which is the initial
screen of the Power Mate CNC manager. On this screen, you can select each of the following items
by pressing the corresponding soft key:
ABS:
Absolute coordinate display
MACHIN: Machine coordinate display
PARAM: Parameter screen
MSG:
Alarm list
DGNOS:
Diagnosis screen
SYSTEM: System information
To select another function after one of the functions listed above is selected, press the return menu
key
until the soft keys appear as shown above. Then, select the desired function.
4
Terminating the Power Mate CNC manager function
Press the return menu key once or twice. The soft keys of the CNC system appear, and the Power
Mate CNC manager terminates.
Alternatively, you can select another function by pressing an MDI function key (
,
,
, etc.) to terminate the Power Mate CNC manager function.
Selecting a slave
When slaves are connected to multiple I/O Link channels, pressing soft key [NEXT CH.] or [PREV. CH.]
displayed by pressing the soft key [(OPRT)] changes the displayed channel.
In the upper section of the screen, the following information items are displayed for the connected slaves
(up to eight slaves):
• I/O Link group number (0 to 15)
• Alarm status
The cursor is positioned at the number of the slave for which to display information (active slave). When
multiple slaves are connected, pressing the soft key [NEXT SLAVE] or [PREV. SLAVE] changes the
active slave.
You can display the slave status and select a slave on any screen of the Power Mate CNC manager
function.
Current position display screen
The current position display screen displays the current position and actual feedrate of the slave.
The following current position data is displayed:
• Absolute coordinate (current position in the absolute coordinate system)
• Machine coordinate (current position in the machine coordinate system)
-
Display method
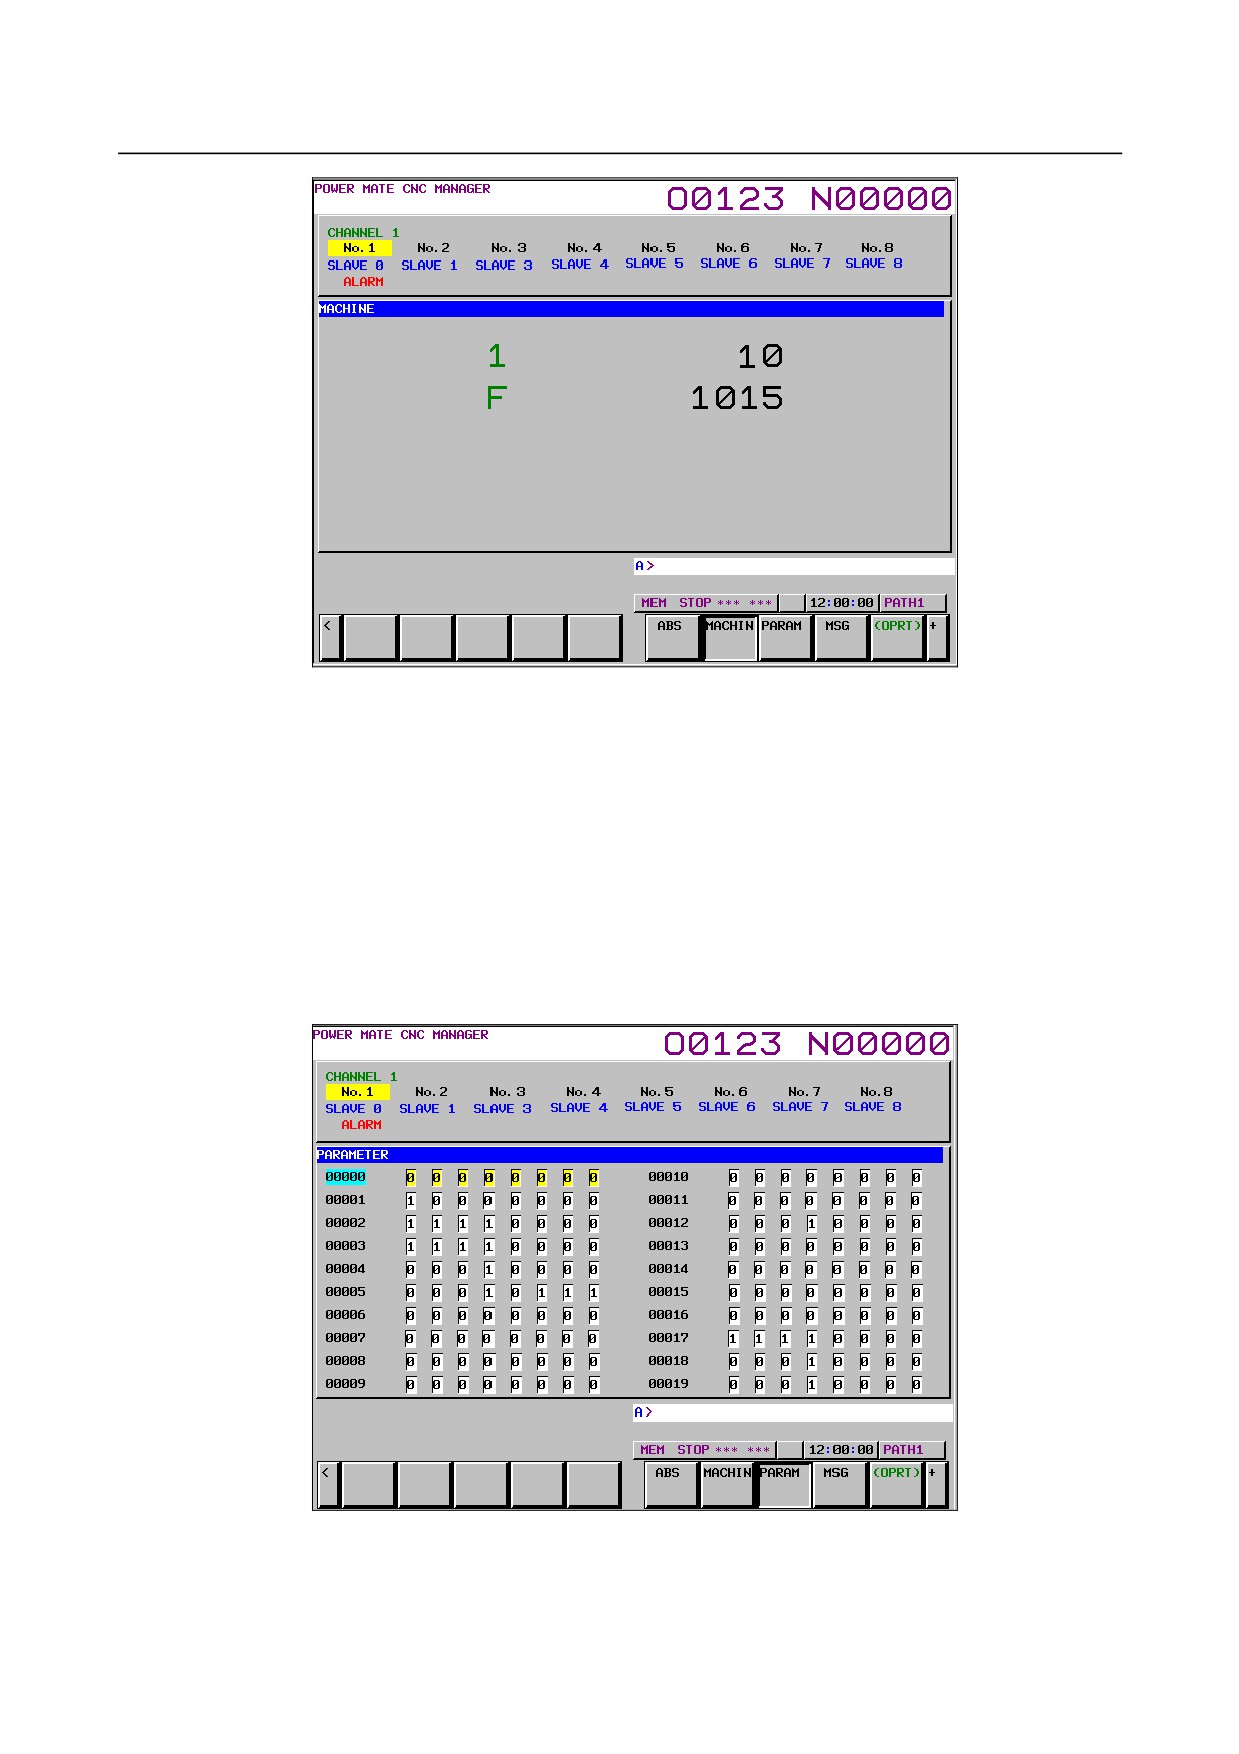
Press soft key [ABS] or [MACHIN] to display the absolute coordinate screen or machine coordinate
screen, respectively.
- 69 -
1.DISPLAY AND OPERATION
B-64485EN/01
Power Mate CNC manager: Machine coordinate screen
Axis name display
You can change the axis name by setting it in the I/O Link βi parameters Nos. 0024 and 0025. Up to two
characters can be set. (Use the ASCII codes of 0 to 9 and/or A to Z). When no axis name is set or the
setting data is invalid, the axis name is set to 1.
This axis name is used only for position display of the Power Mate CNC manager function and irrelevant
to the controlled axis on the CNC.
Parameter screen
The parameters required for the functions of the slave must be specified in advance.
Press soft key [PARAM] to display the parameter screen.
This screen displays only the bit and decimal data. For details of the parameters, refer to FANUC SERVO
MOTOR βi series I/O Link Option Maintenance Manual.
- 70 -
B-64485EN/01
1.DISPLAY AND OPERATION
• Selecting and searching for a parameter
1
First, select the active slave.
2
Press the soft key [(OPRT)]. The following soft keys appear:
3
Enter a parameter number and press the soft key [NO. SRH]. The search starts.
You can also select a desired parameter number by pressing the cursor keys
and page keys
and moving the cursor.
• Setting a parameter
You can directly set an I/O Link βi parameter of the slave from the CNC.
1
Select a desired parameter using either of the above methods.
2
Press the soft key [(OPRT)]. The following soft keys appear:
3
Enter setting data.
4
Press the soft key [INPUT] or MDI key
Alarm screen
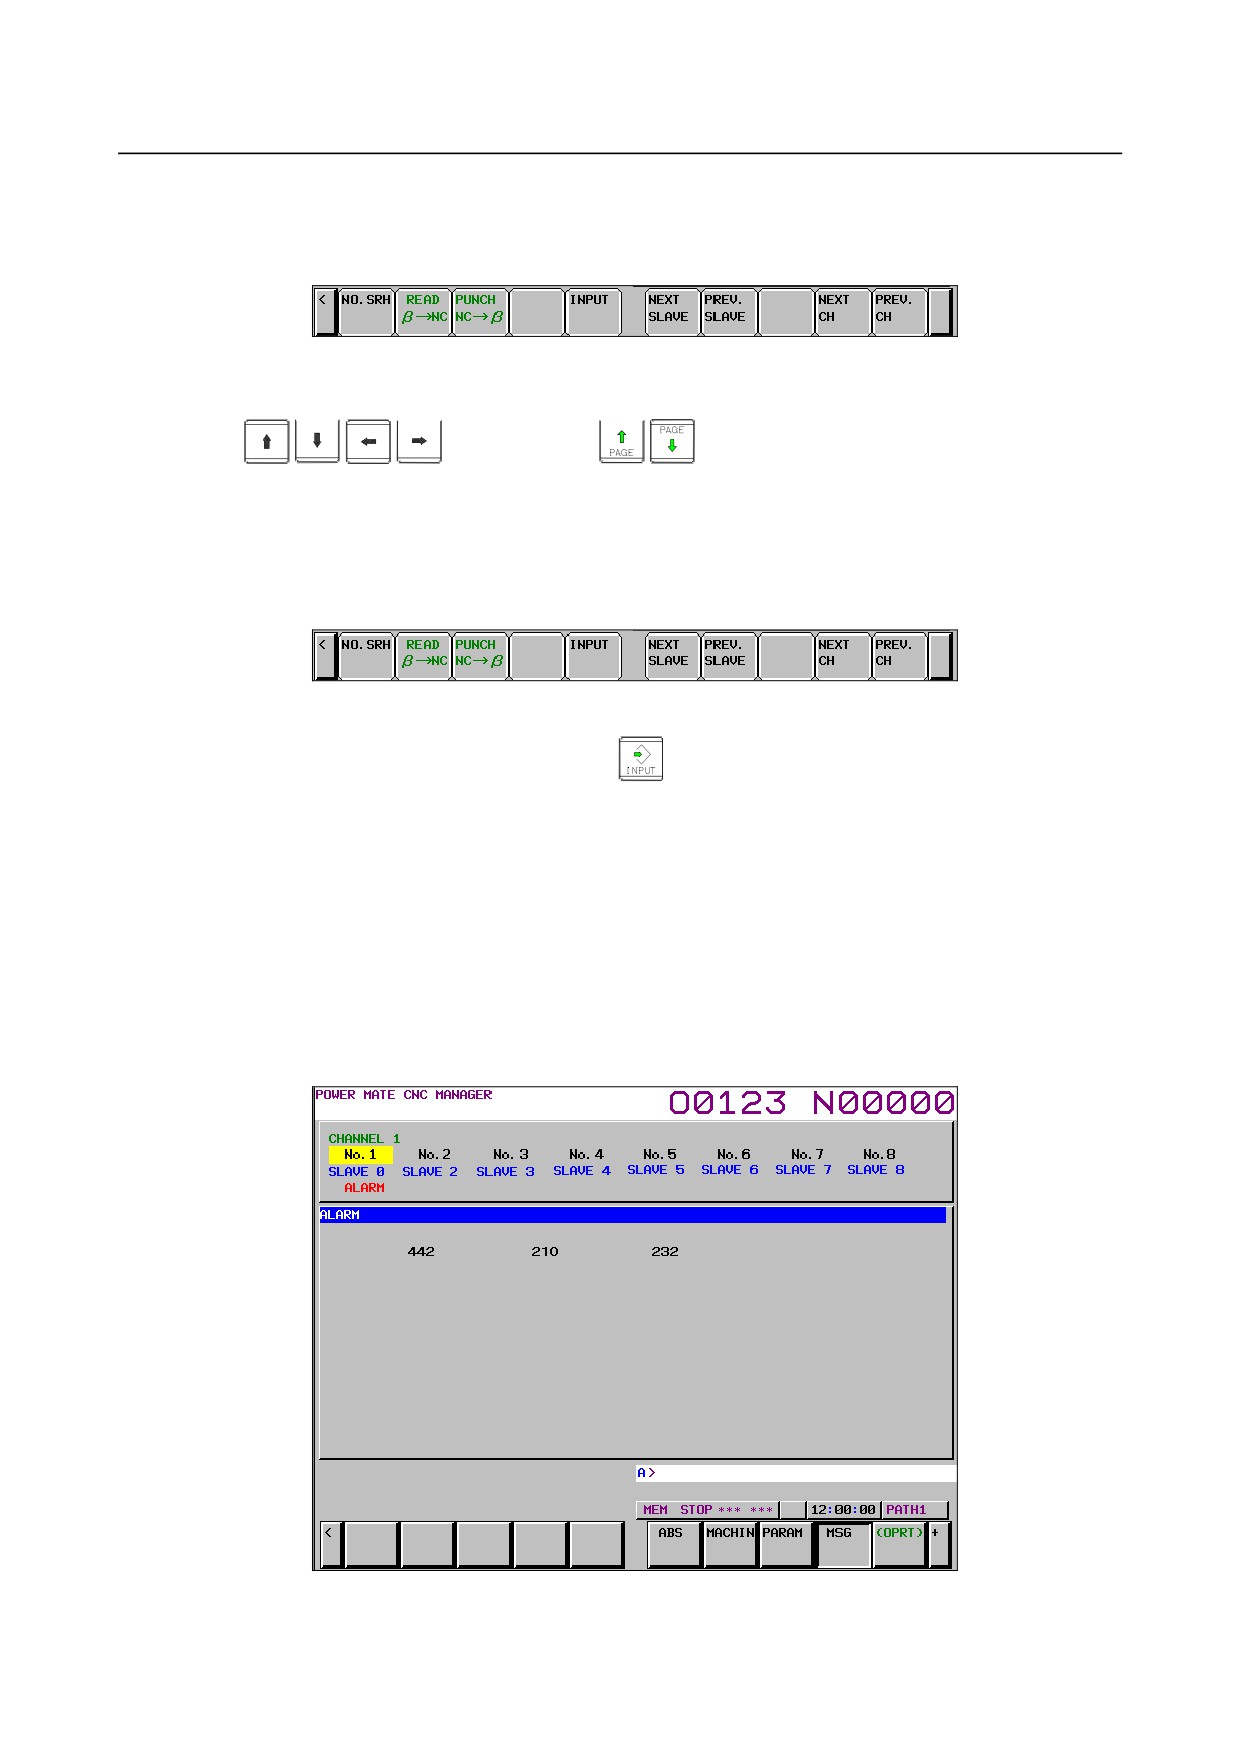
If an alarm is issued for the slave, “ALARM” is displayed in the slave status field in the upper section of
the screen.
At this time, you can display the alarm screen to check the details of the alarm.
Up to 40 alarm codes are displayed on the screen.
For details of the alarms, refer to FANUC SERVO MOTOR βi series I/O Link Option Maintenance
Manual.
-
Display method
Press the soft key [MSG]. On the screen, only error codes are displayed.
Example of displaying alarms for I/O Link βi of slave 0
- 71 -