FANUC Series 30i-MODEL B, 31i-MODEL B, 32i-MODEL B. MAINTENANCE MANUAL - page 4
1.DISPLAY AND OPERATION
B-64485EN/01
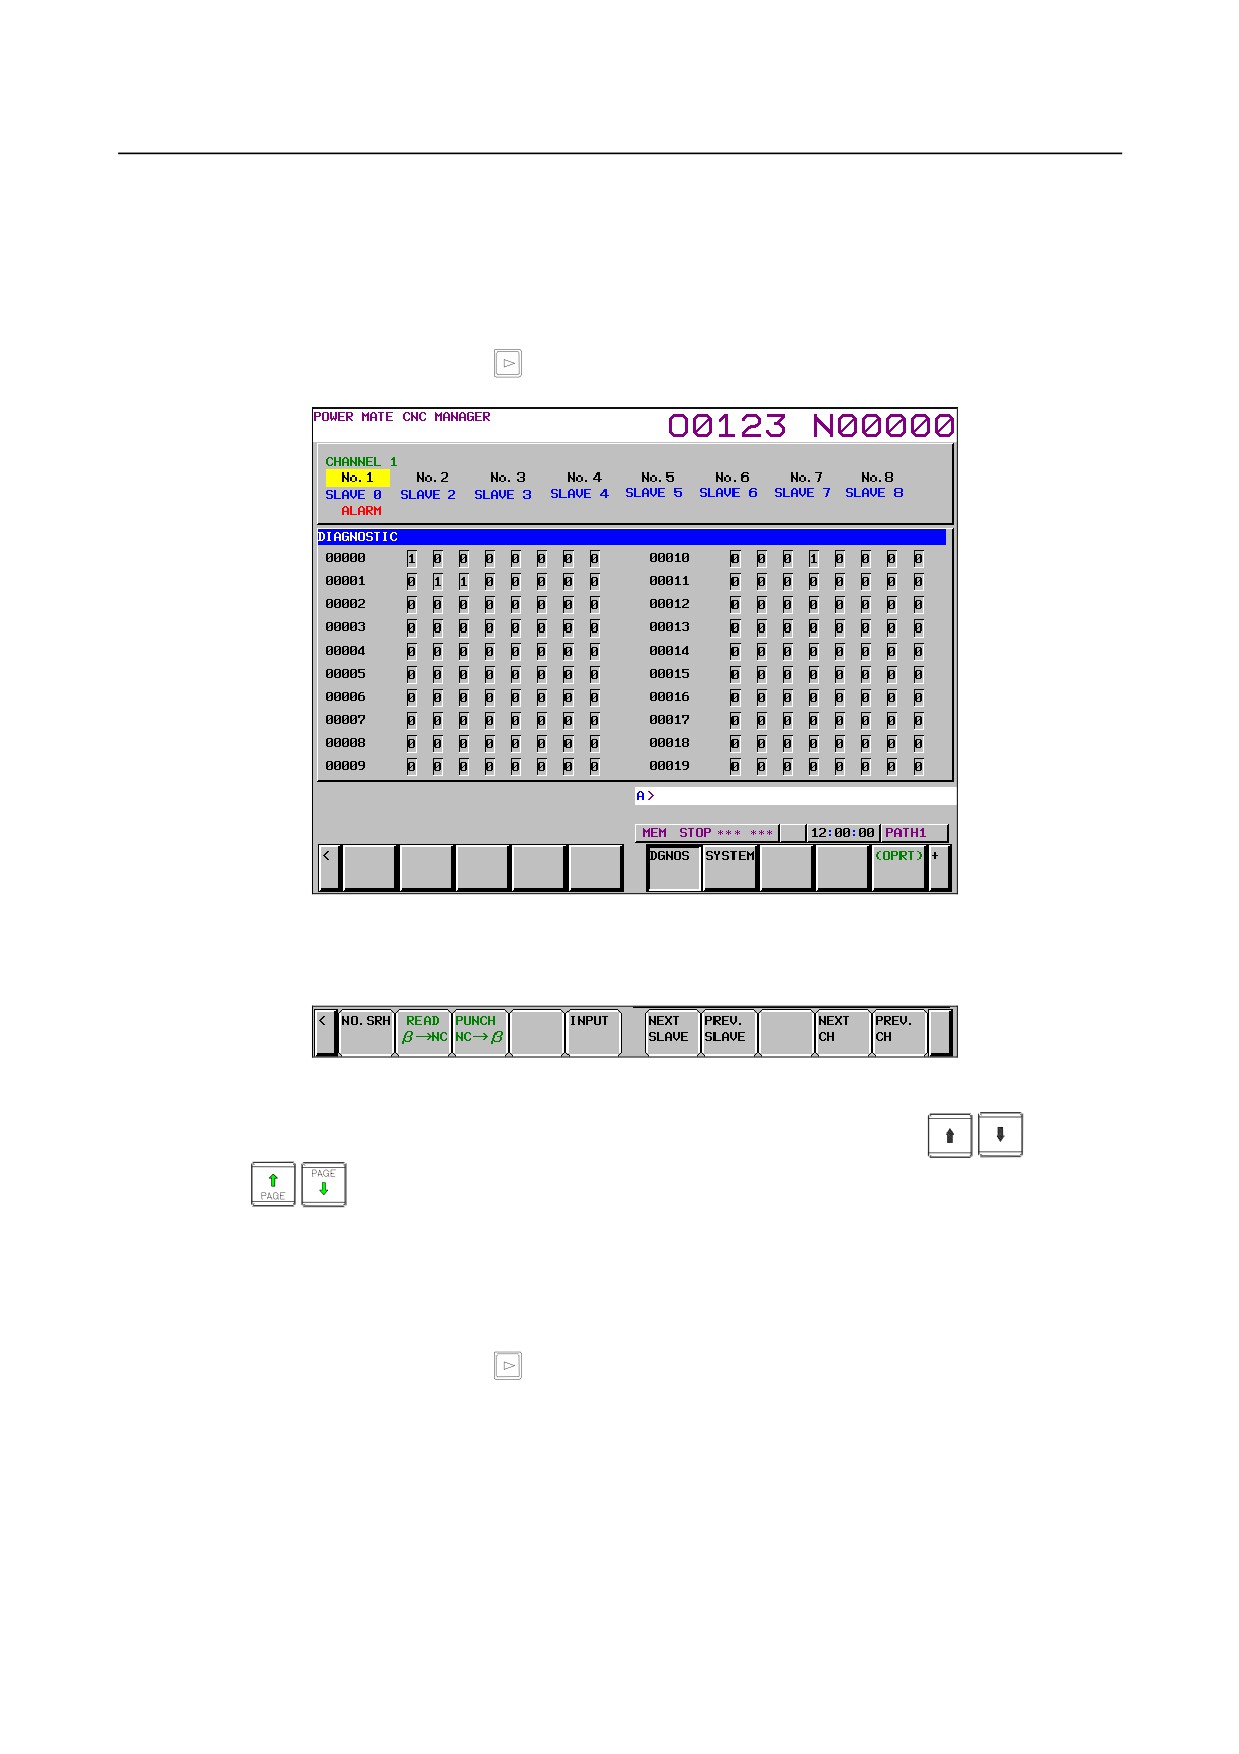
Diagnosis screen
The diagnosis screen displays diagnosis information of the slave.
Diagnosis data is displayed in bit or integer (decimal) representation. For details of diagnosis data, refer
to FANUC SERVO MOTOR βi series I/O Link Option Maintenance Manual.
-
Display method
1
Press the continuous menu key
2
Press soft key [DGNOS] to display the diagnosis screen.
Searching for diagnosis data
1
First, select the active slave.
2
Press the soft key [(OPRT)]. The following soft keys appear:
3
Enter a diagnosis number and press the soft key [NO. SRH]. The search starts.
You can also select a desired parameter number by pressing the cursor keys
and page
keys
and moving the cursor.
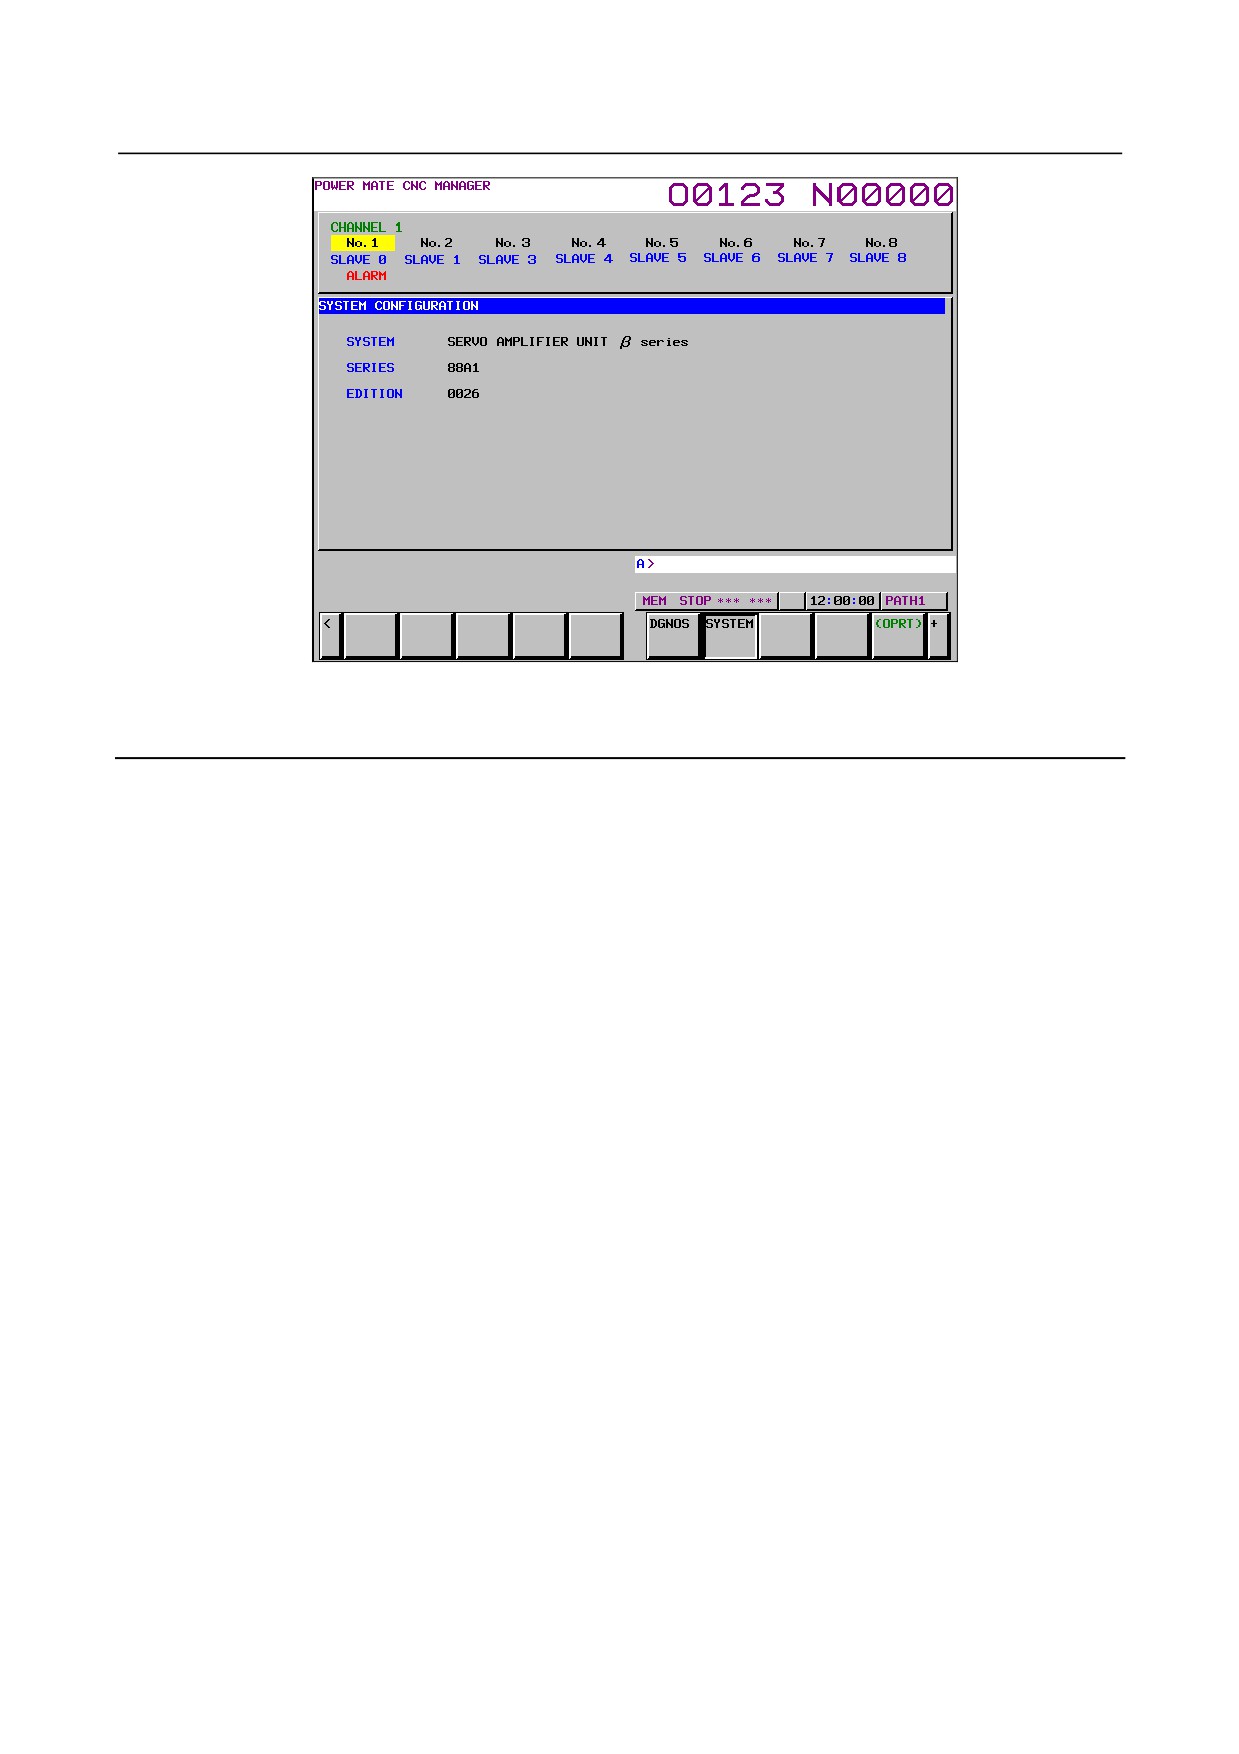
System configuration screen
The system configuration screen displays information on the system software of slaves.
-
Display method
1
Press the continuous menu key
2
Press the soft key [SYSTEM] to select the system configuration screen.
- 72 -
B-64485EN/01
1.DISPLAY AND OPERATION
Series and edition of the I/O Link βi system software
1.8.2
Inputting and Outputting Parameters
Outputting parameters
Parameters are output to the CNC memory or a memory card as a data file in the program format. Set the
first registration program number in parameter No. 8760. For each slave, program with a predetermined
number is created.
When parameters are output to the CNC memory, a program with the specified program number is
created.
When parameters are output to a memory card, a file is created, of which file name consists of the
specified program number and an extension PMM.
Program number = setting-of-parameter (parameter No. 8760) + (m - 1) × 100 + n × 10
m: Channel number (1 to 4)
n: Group number
Example: When parameter No. 8760 is set to 8000
Channel 1 (I/O Link β: Group 0)
8000 + 0*100 + 0*10 = 8000
Channel 2 (I/O Link β: Group 1)
8000 + 1*100 + 1*10 = 8110
Channel 3 (I/O Link β: Group 2)
8000 + 2*100 + 2*10 = 8220
Channel 4 (I/O Link β: Group 3)
8000 + 3*100 + 3*10 = 8330
The group number is the slave number displayed in the slave status field in the upper section of the screen
in reverse video.
When bit 3 (PMO) of parameter No. 0961 is set to 1, the numbers of the parameters to be output can be
set only with a group number.
Select a desired input device using bits 1 (MD1) and 2 (MD2) of parameter No. 0960.
Connect a memory card or check the unused area of the CNC memory, then follow the steps below:
1
For multi-path control, display the Power Mate CNC manager screen from the screen for path 1.
2
Select the active slave.
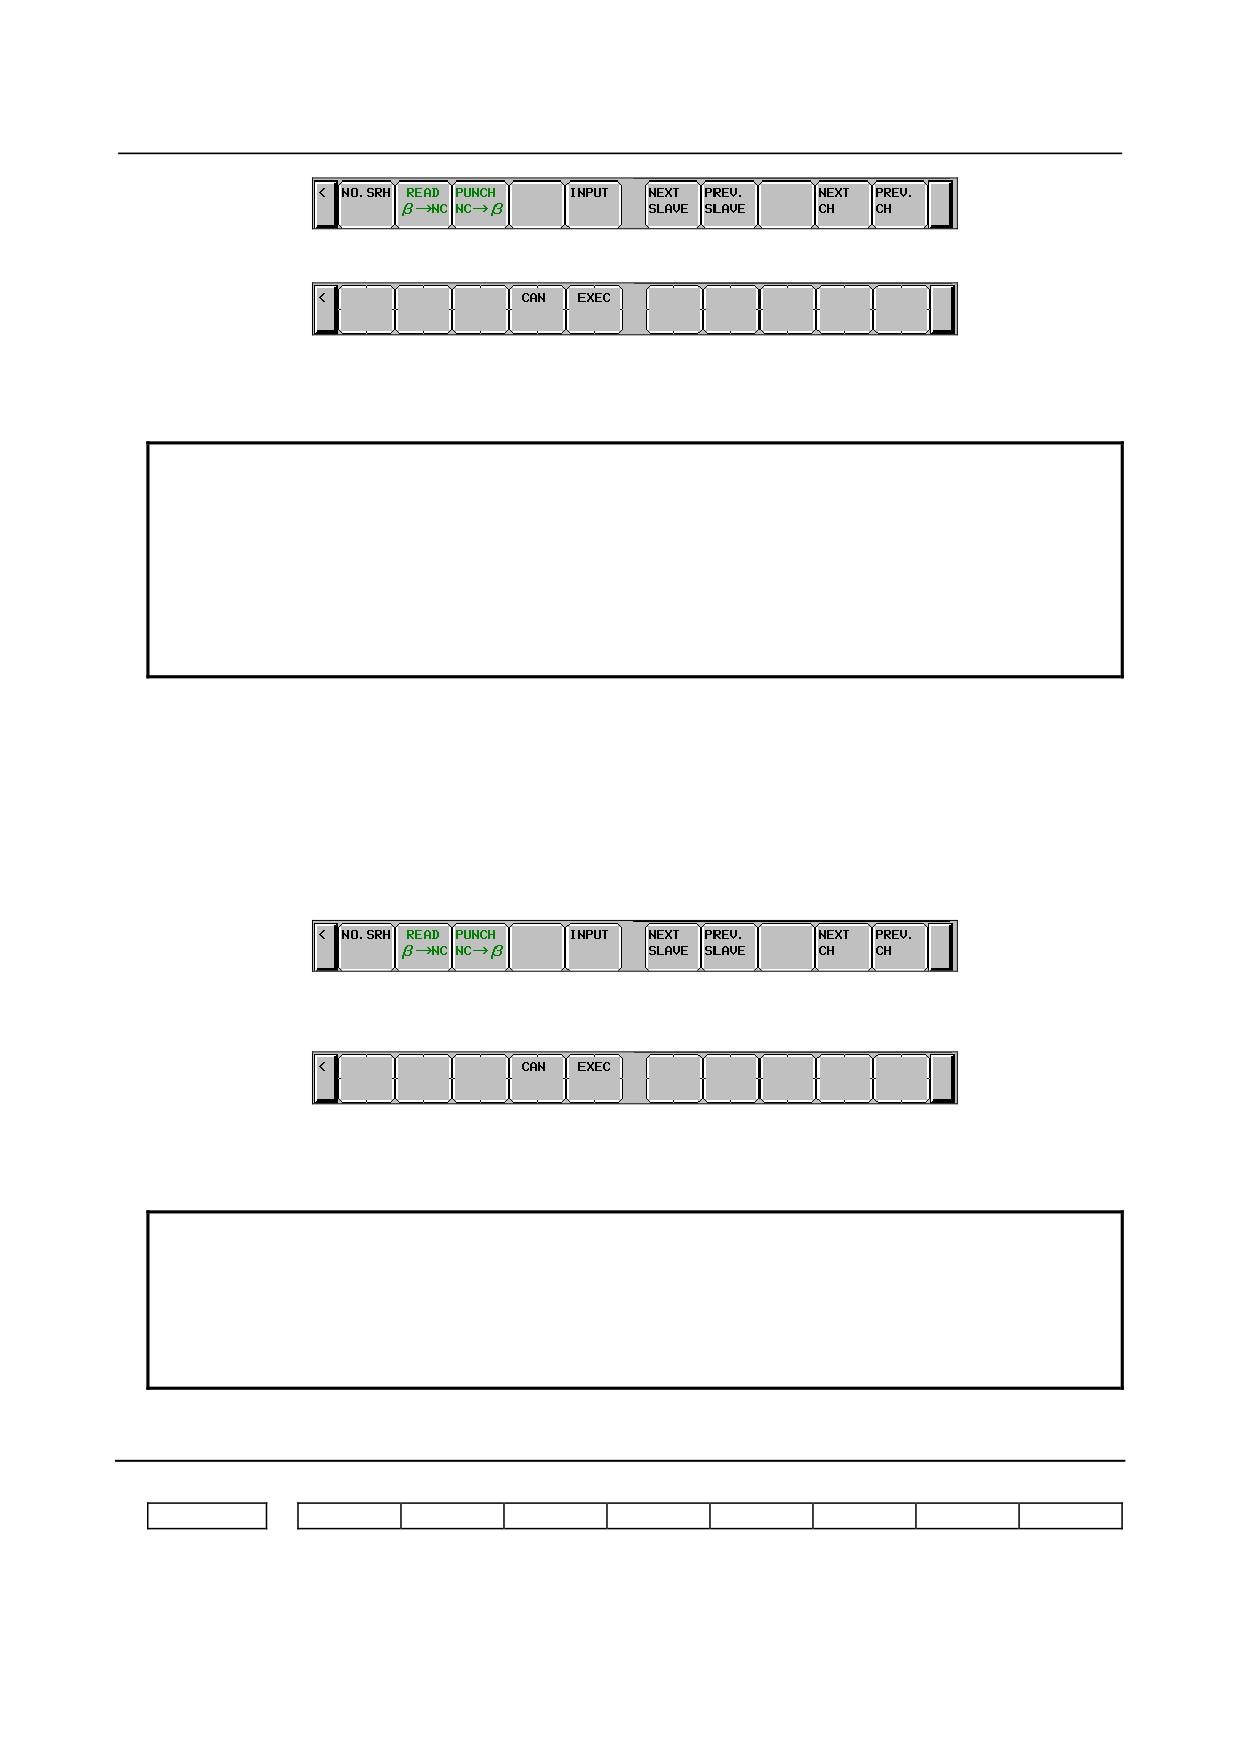
Press the soft key [(OPRT)]. The following soft keys appear:
- 73 -
1.DISPLAY AND OPERATION
B-64485EN/01
3
Press the soft key [READ]. The following soft keys appear:
4
Press the soft key [EXEC].
During input, “INPUT” blinks in the message field.
NOTE
1 Parameters can be saved in other than the MEM mode or in the emergency stop
status.
2 To save parameters in a memory card, if a file with the same name is found in
the memory card, the parameters cannot be saved. Delete the file from the
memory card or change the file name by setting parameter No. 8760.
To save parameters in a program area, save operation is performed according to
the setting of bit 2 (REP) of parameter No. 3201.
Inputting parameters
A data file of parameters output to the CNC memory or a memory card as a program is input to the slave
determined by the program number. The program number and memory device are determined as
described in “Outputting parameters.”
1
For multi-path control, display the Power Mate CNC manager screen from the screen for path 1.
2
Select the active slave.
3
Press the soft key [(OPRT)]. The following soft keys appear:
4
Press the soft key [PUNCH]. The following soft keys appear:
5
Press the soft key [EXEC].
During output, “OUTPUT” blinks in the message field.
NOTE
1 Parameters can be input in other than the MEM mode or in the emergency stop
status.
2 For multi-path control, parameters can be input and output only using the Power
Mate CNC manager screen for path 1. They can only be input from and output to
the CNC memory for path 1.
1.8.3
Parameters
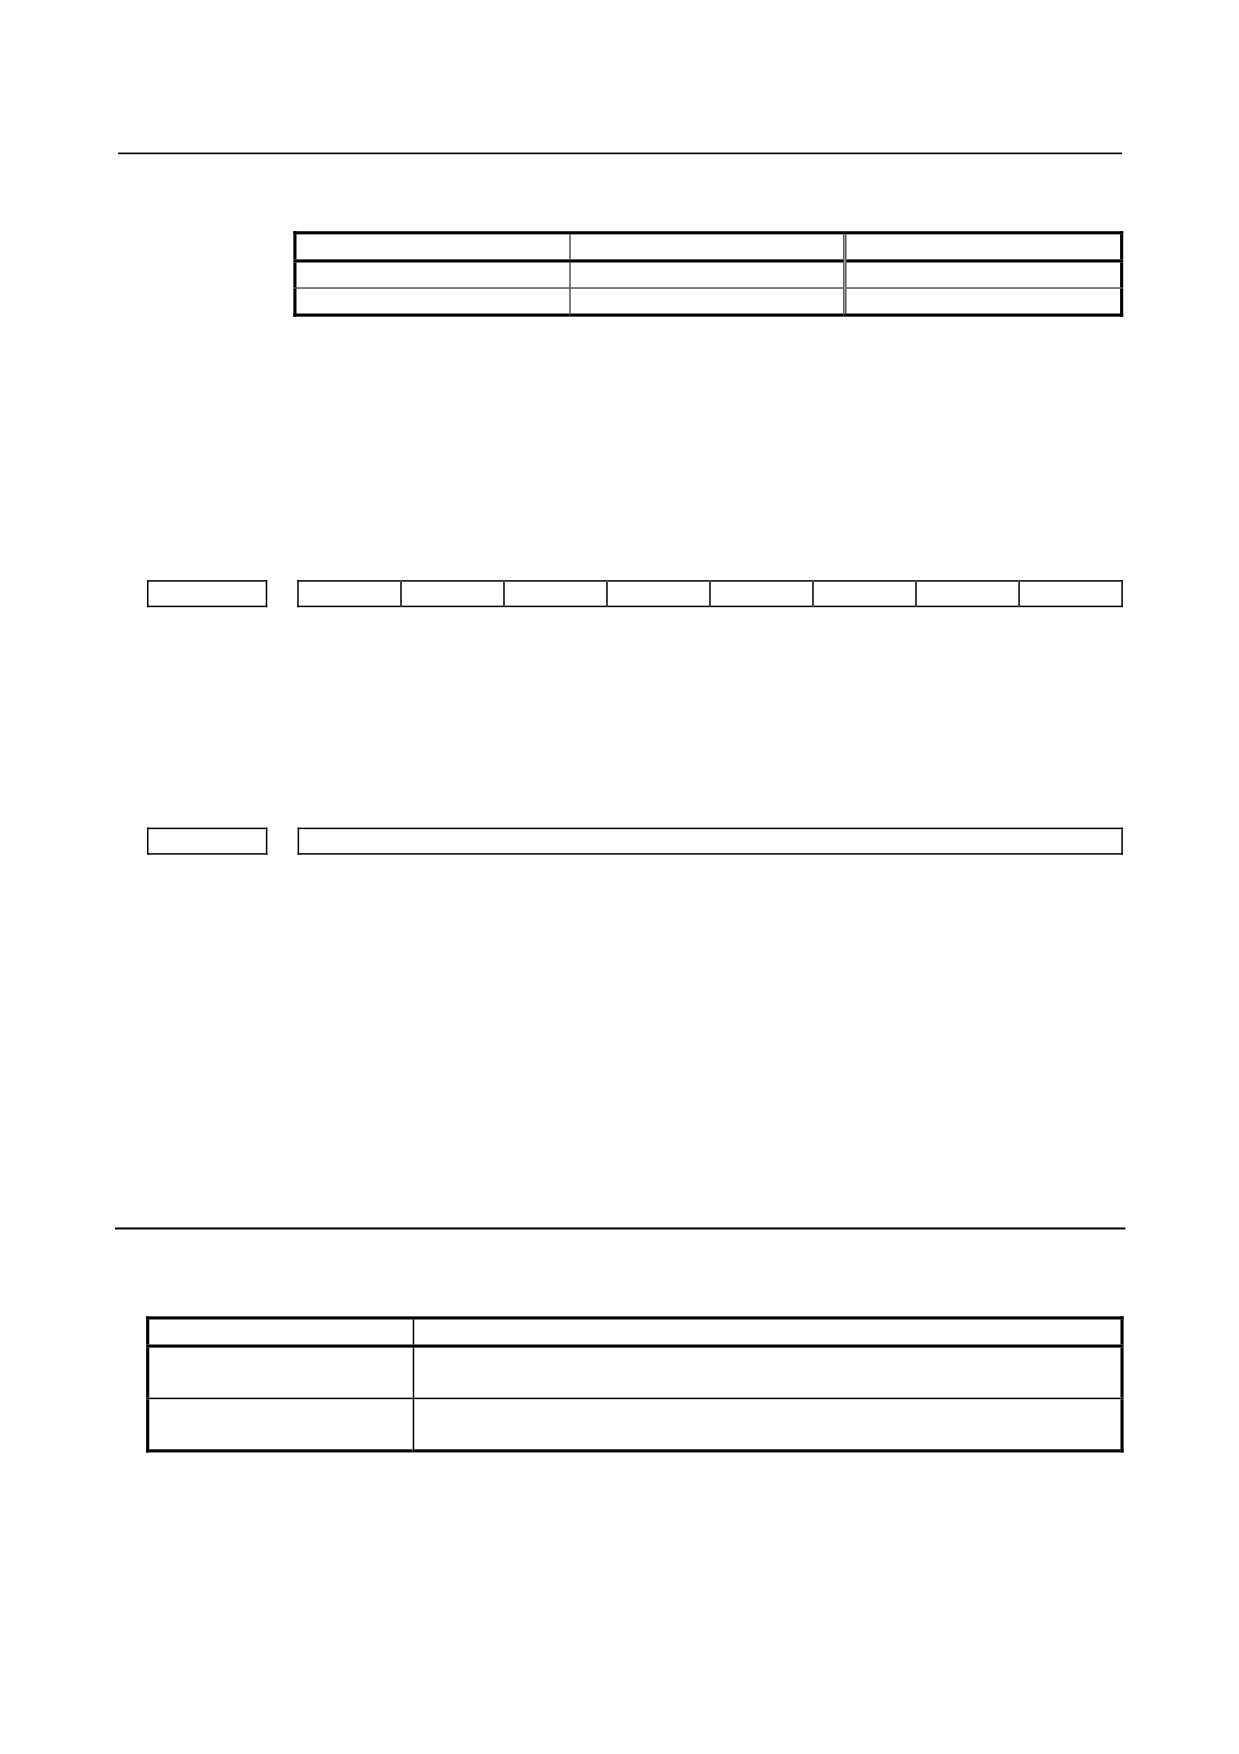
#7
#6
#5
#4
#3
#2
#1
#0
0960
PPE
PMN
MD2
MD1
[Input type] Setting input
[Data type] Bit path
- 74 -
B-64485EN/01
1.DISPLAY AND OPERATION
#1 MD1
#2 MD2 The slave parameters are input from and output to either of the following devices:
Parameter MD2
Parameter MD1
I/O destination
0
0
Program memory
0
1
Memory card
#3 PMN The Power Mate CNC manager function is:
0: Enabled.
1: Disabled. (Communication with the slave is not performed.)
#4 PPE Setting slave parameters using the Power Mate CNC manager:
0: Can always be performed regardless of the setting of PWE.
1: Follows the setting of PWE.
#7
#6
#5
#4
#3
#2
#1
#0
0961
PMO
[Input type] Parameter input
[Data type] Bit
#3 PMO The O number of a program for saving and restoring the I/O LINK β parameter is set
based on:
0: Group number and channel number
1: Group number only
8760
Program number of data input/output (Power Mate CNC manager)
[Input type] Setting input
[Data type] 2-word path
[Valid data range] 0 to 99999999
This parameter sets the program numbers of programs to be used for inputting and
outputting slave data (parameters) when the Power Mate CNC manager function is used.
For a slave specified with I/O LINK channel m and group n, the following program
number is used:
Setting + (m - 1) × 100 + n × 10
If the setting is 0, the parameters of the slave specified with channel 1 and group 0 cannot
be input from or output to the CNC memory because the program number is set to 0. The
parameters can be input from and output to a memory card.
(Set a value with which any used program number does not exceed 99999999.)
Warning
If an alarm is issued for the Power Mate CNC manager, a warning message is displayed.
Message
Description
DATA ERROR
An attempt was made to execute [PUNCH] (NC → β) for a program not found in
the program area.
WRITE PROTECTED
An attempt was made to execute [READ] (β → NC) for a program area when the
memory protection signal (KEY) is off.
- 75 -
1.DISPLAY AND OPERATION
B-64485EN/01
Message
Description
EDIT REJECTED
An attempt was made to execute [READ] (β → NC) when the program area already
contained a program with the same name as that to be created by executing
[READ] (β → NC).
An attempt was made to execute [READ] (β → NC) when the number of the
program to be created by executing [READ] (β → NC) was selected.
An attempt was made to execute [READ] (β → NC) when bit 0 (TVC) of CNC
parameter No. 0000 was set to 1. (Parameters Nos. 0000 to 0019 are output, but
parameter No. 0020 and subsequent parameters are not output.)
An attempt was made to execute [PUNCH] (NC → β) when a memory card did not
contain any program for which [PUNCH] (NC → β) could be executed.
An attempt was made to execute [READ] (β → NC) for a protected memory card.
NO MORE SPACE
An attempt was made to execute [READ] (β → NC) when the program area did not
have enough unused space.
FORMAT ERROR
Data other than digits, signs, CAN, and INPUT was entered as the setting of a
parameter.
TOO MANY FIGURES
Data consisting of 9 or more digits was entered for a bit-type parameter.
DATA IS OUT OF RANGE
The setting exceeds the valid data range.
1.8.4
Notes
-
Connecting an I/O Link
When I/O Link βi is used as a slave of an I/O Link, the CNC assigns I/O addresses. The slave data is
input and output in 16-byte units. Therefore, be sure to specify 128 as the number of input/output points.
Up to eight slaves can be connected.
The module name is OC021 (16-bit input) or OC020 (16-byte output).
BASE is always 0 and SLOT is always 1.
-
Function of ignoring the Power Mate CNC manager
After setting and checking data required for each slave connected, you can stop communication with the
Power Mate CNC manager function to send a command from the CNC ladder to the slave.
When bit 3 (PMN) of parameter No. 960 is set to 1, communication between the CNC and the slave via
the I/O Link is all open to the ladder. While this bit is 1, the Power Mate CNC manager function does not
operate.
-
Data protection key
When the program data protection key of the CNC is on, no parameters can be input to the CNC program
memory.
- 76 -
B-64485EN/01
1.DISPLAY AND OPERATION
1.9
SERVO GUIDE MATE
The servo guide mate enables various types of data related to the servo motor and spindle motor to be
displayed on the screen in the form of graphs. This allows you to readily measure the machine precision,
thereby making it easy to grasp changes in precision resulting from the aging process, an earthquake, or
collision of the machine.
Overview
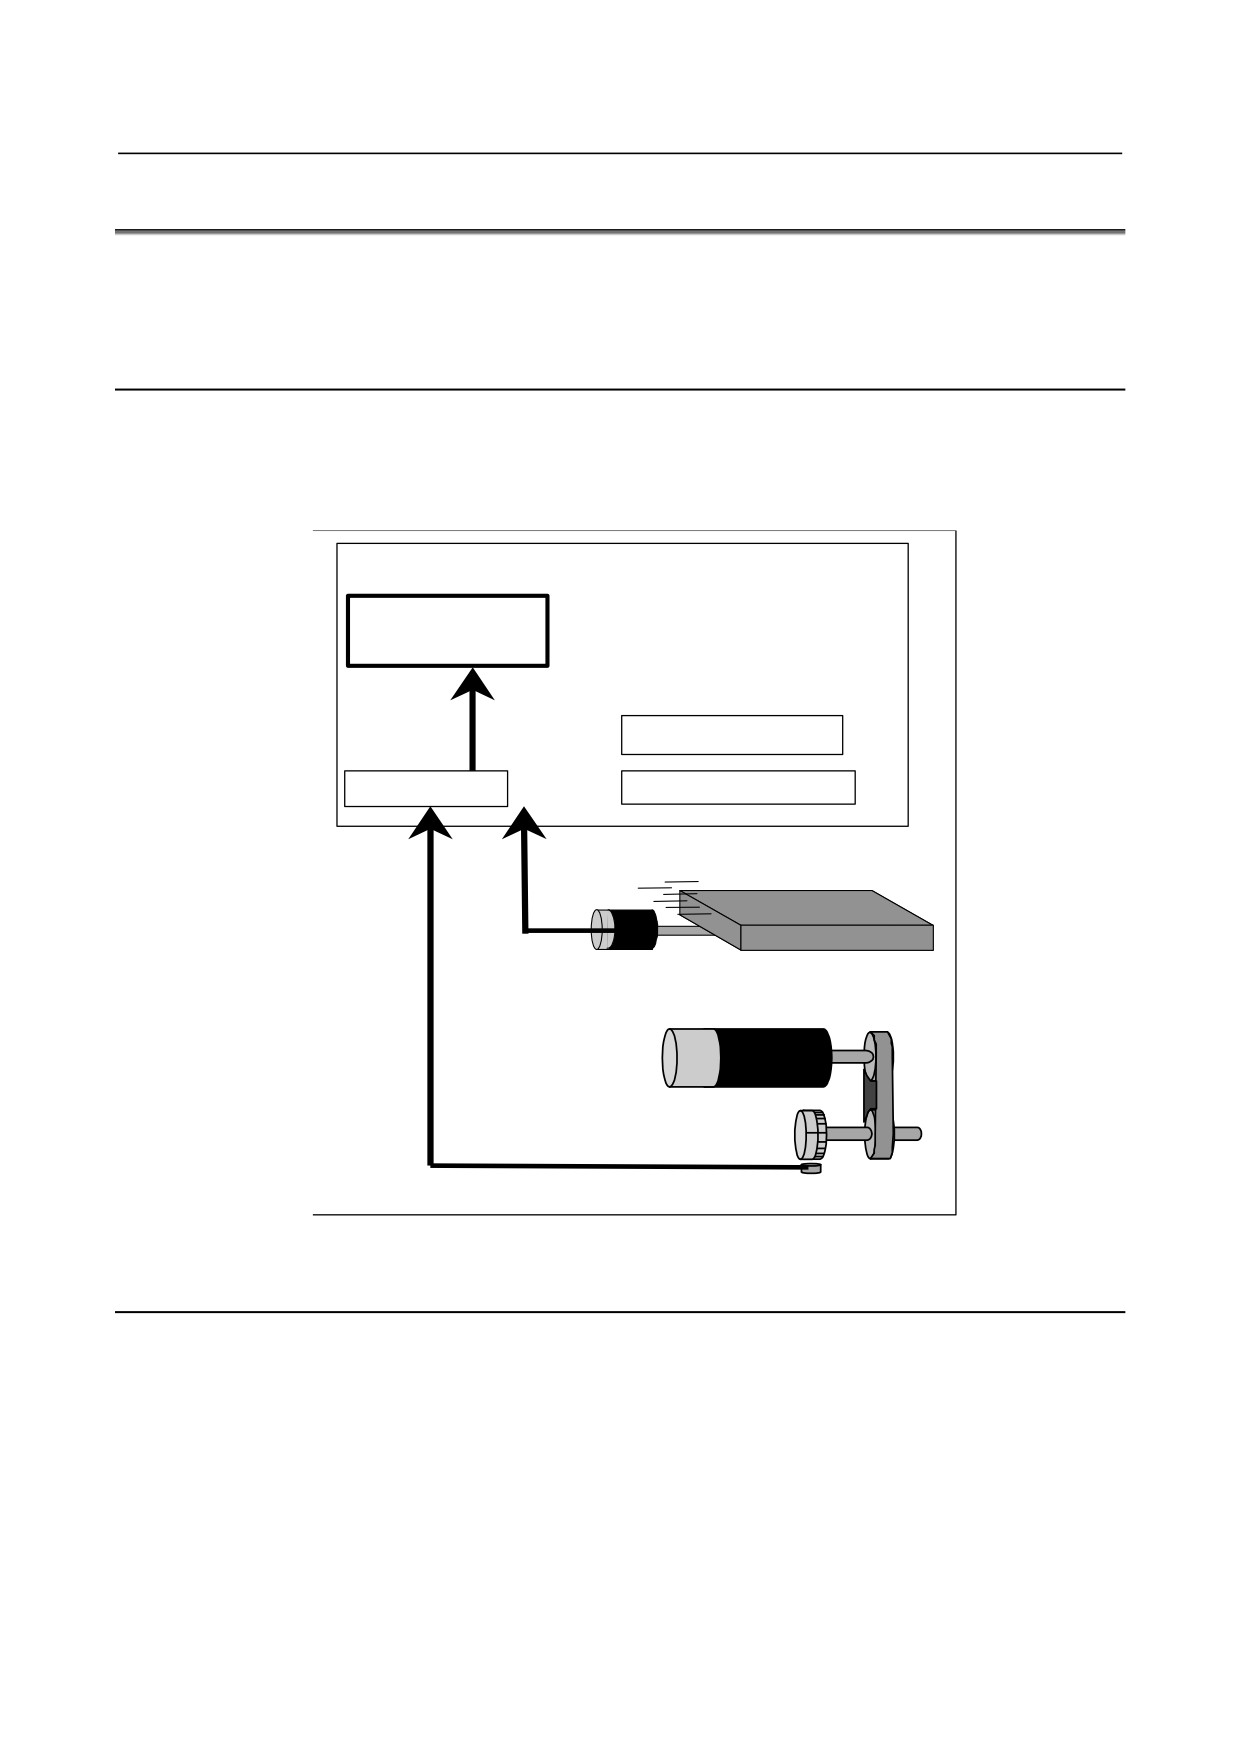
Set up as outlined in Fig. 1.9 (a), the servo guide mate displays graphs representing the feedback data
related to the servo motor and spindle motor that are controlled through the execution of the program. It
features such functions as drawing graphs representing chronological changes in data and the motor path,
as well as displaying an enlarged view of error associated with the circular operation.
CNC
Graph
display
Feedback
data
Parameter setting
Data buffer
Program execution
Feed axis
Servo motor
Spindle motor
Spindle
Sensor
Fig. 1.9 (a) Outline of the servo guide mate setup
1.9.1
Wave Display
The wave display function can acquire various types of data related to the servo motor and spindle motor
and display graphs in several different drawing modes for the analysis of the measurement data. A graph
is made up of the two elements described below. To display a graph, therefore, operations for the wave
display need to be set, in addition to the measurement data.
1
Measurement data
This refers to raw data, such as position and torque, acquired from the CNC on a per-channel basis.
2
Operations
This collectively refers to the results of operations performed for measurement data. A graph cannot
be displayed unless necessary operations are set.
This denotes that the following relationship holds true:
Wave display (graph display) = measurement data + operations
- 77 -
1.DISPLAY AND OPERATION
B-64485EN/01
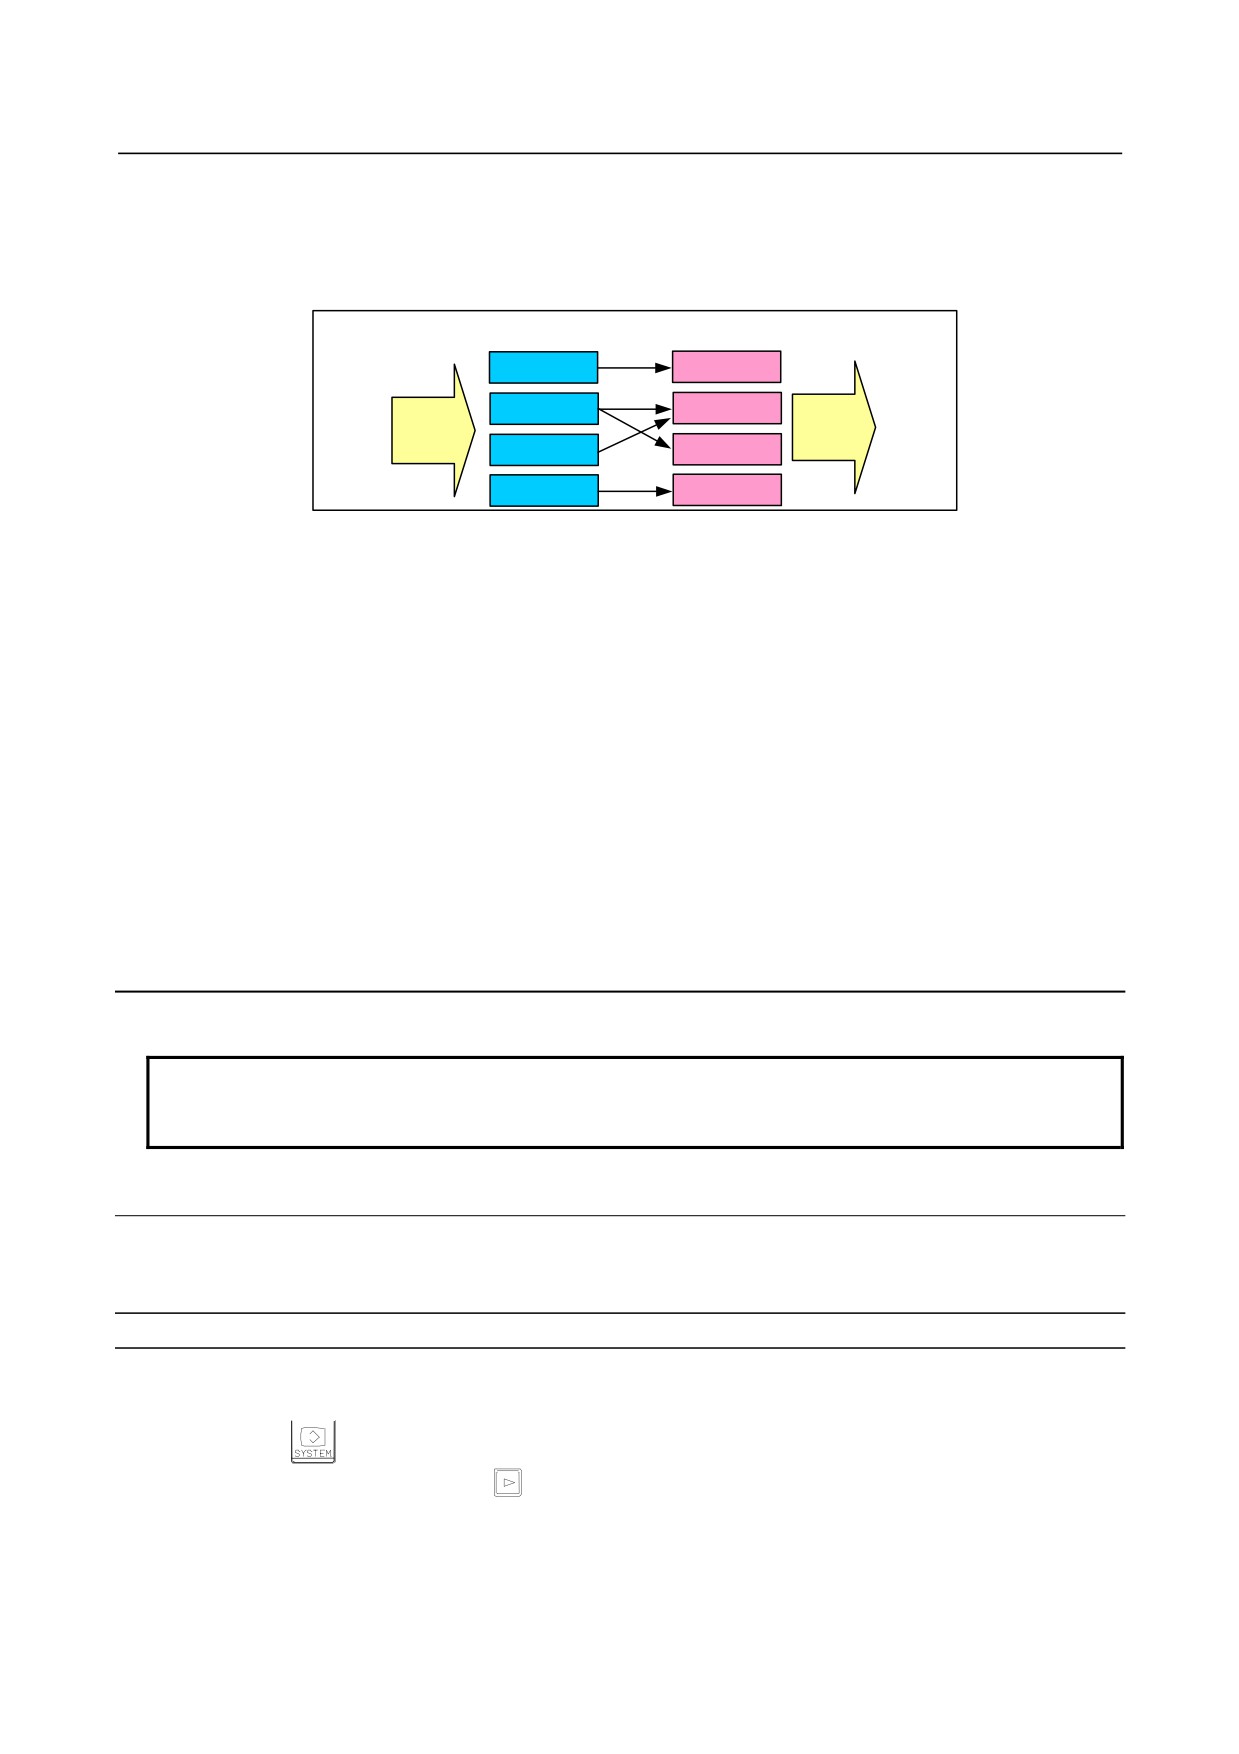
In the remainder of this chapter, the term channel (CH) is used to refer to a specific set of measurement
data and the term draw to refer to a specific displayed wave.
CH1
: Measurement data 1
Draw3
: Display waveform 3
A conceptual diagram of the wave display is shown Fig. 1.9 (b).
Measurement data
Display data
Operation
CH1
Draw1
CH2
Draw2
Screen
Data
acquisition
display
CH3
Draw3
CH4
Draw4
Fig. 1.9 (b)
Measurements of both the servo motor and spindle motor can be made for up to four channels
simultaneously. Also, data can be measured at up to 10000 points per measurement item.
The following five drawing modes are available.
1
Y-time graph
This mode displays wave data along the time axis, as by an oscilloscope.
2
XY graph
This mode provides a 2-dimensional path display using 2-axis data.
3
Circle graph
This mode displays an enlarged view of the path deviation from the specified circle arising during
circular cutting.
4
Fourier graph
This mode displays the frequency spectrum by performing digital Fourier conversion for the range
of data displayed by the Y-time graph.
5
Bode graph
This mode displays a Bode diagram in the form of single logarithm graph for the horizontal axis.
Note
-
Axis number
NOTE
For multi-axis control, the axis number must be an absolute axis number instead
of a relative axis number in each path.
1.9.1.1 Y-time graph
The Y-time graph displays wave data for the measurement data along the time axis, as by an oscilloscope.
Up to four draws can be displayed at a time.
Displaying and setting the Y-time graph
Procedure
The procedure for displaying the measurement data is described below.
1
Press the
function key.
2
Press the continuous menu key
several times until [SERVO GUIDE MATE] is displayed.
3
Click the soft key [SERVO GUIDE MATE].
4
Click the soft key [Y-TIME].
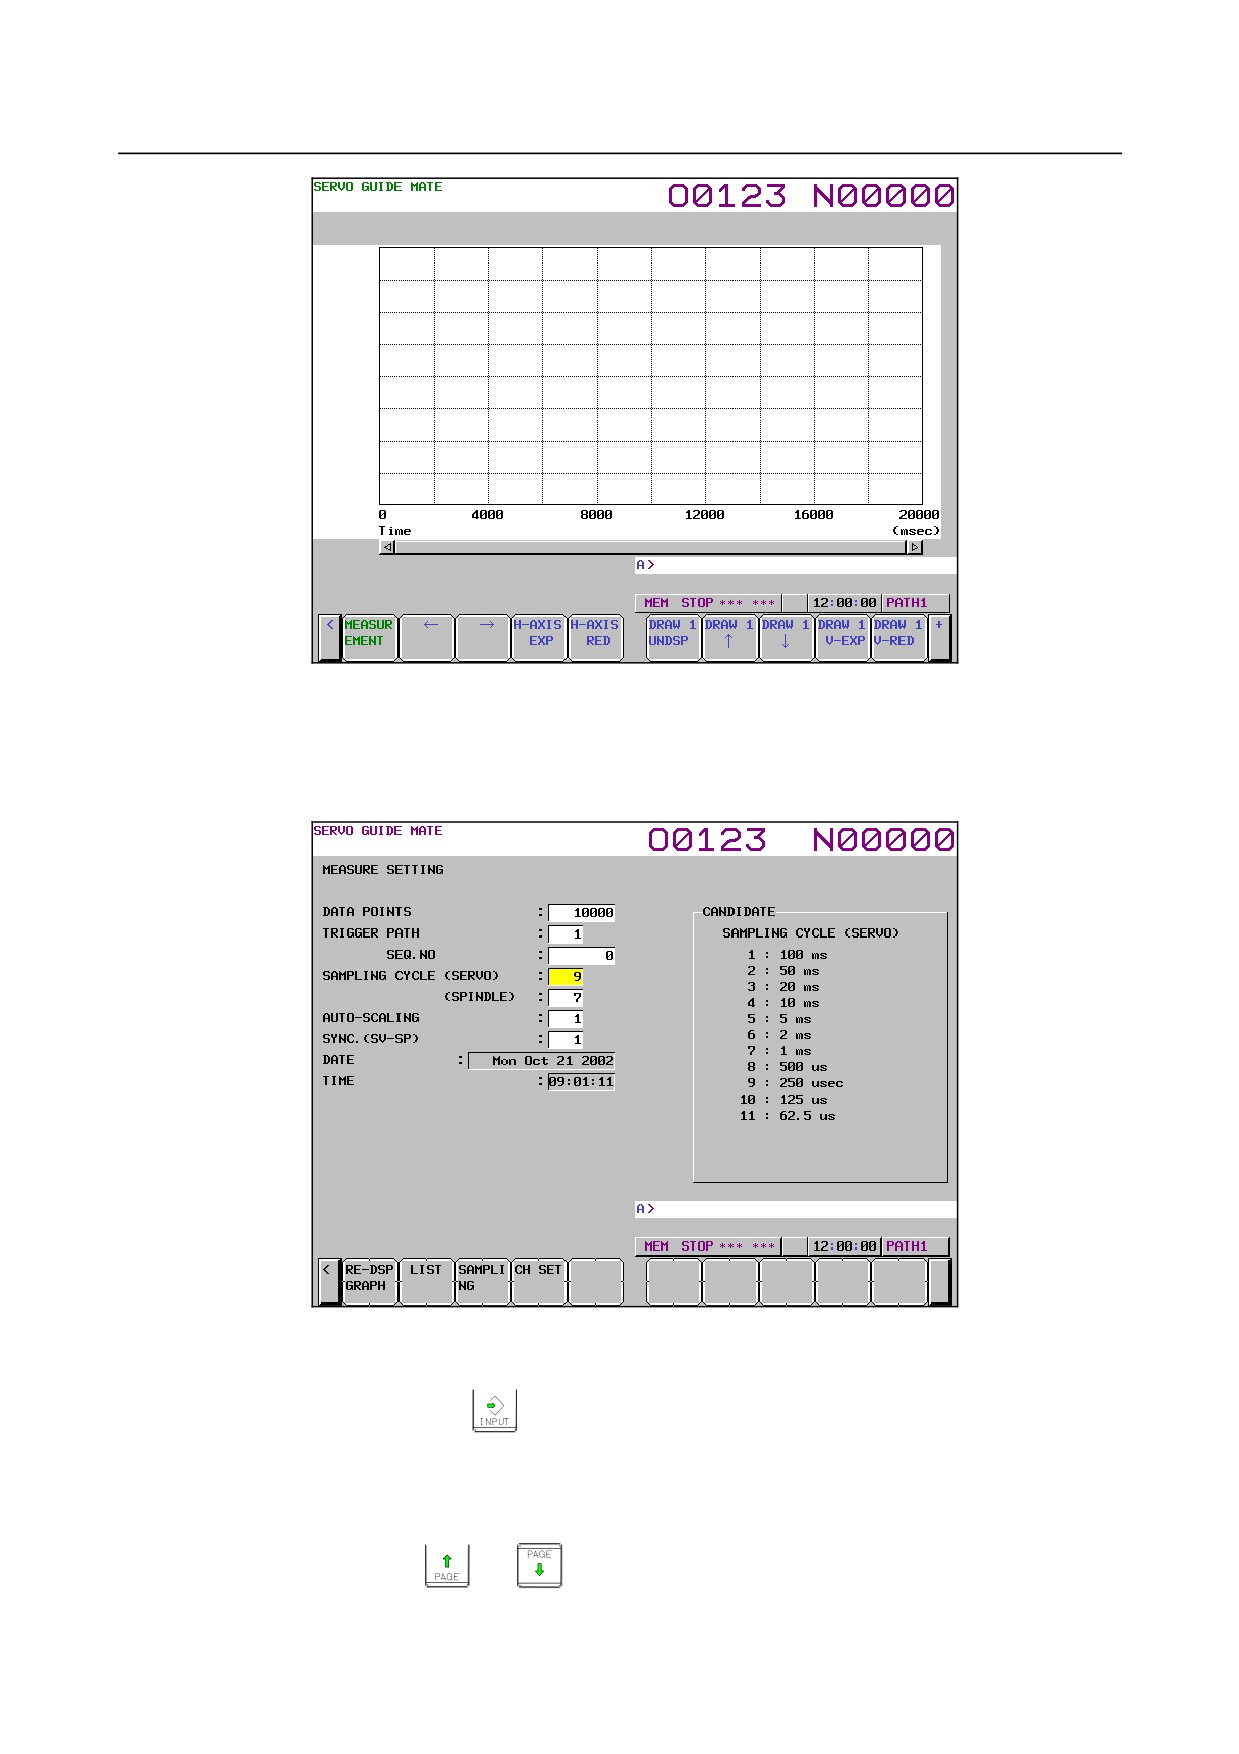
The wave display screen is displayed as shown Fig. 1.9.1.1 (a).
- 78 -
B-64485EN/01
1.DISPLAY AND OPERATION
Fig. 1.9.1.1 (a)
5
Click the soft key[MEASUREMENT].
6
Click the soft key[DATA IN].
7
Click the soft key[SAMPLING].
The data-in screen is displayed as shown Fig. 1.9.1.1 (b).
Fig. 1.9.1.1 (b)
8
Move the cursor to the parameter you want to set, by pressing the cursor key.
9
Enter data and then press the
key.
10 Repeat steps 8 and 9 until you set all the parameters.
11 Click the soft key [SET CHANNEL].
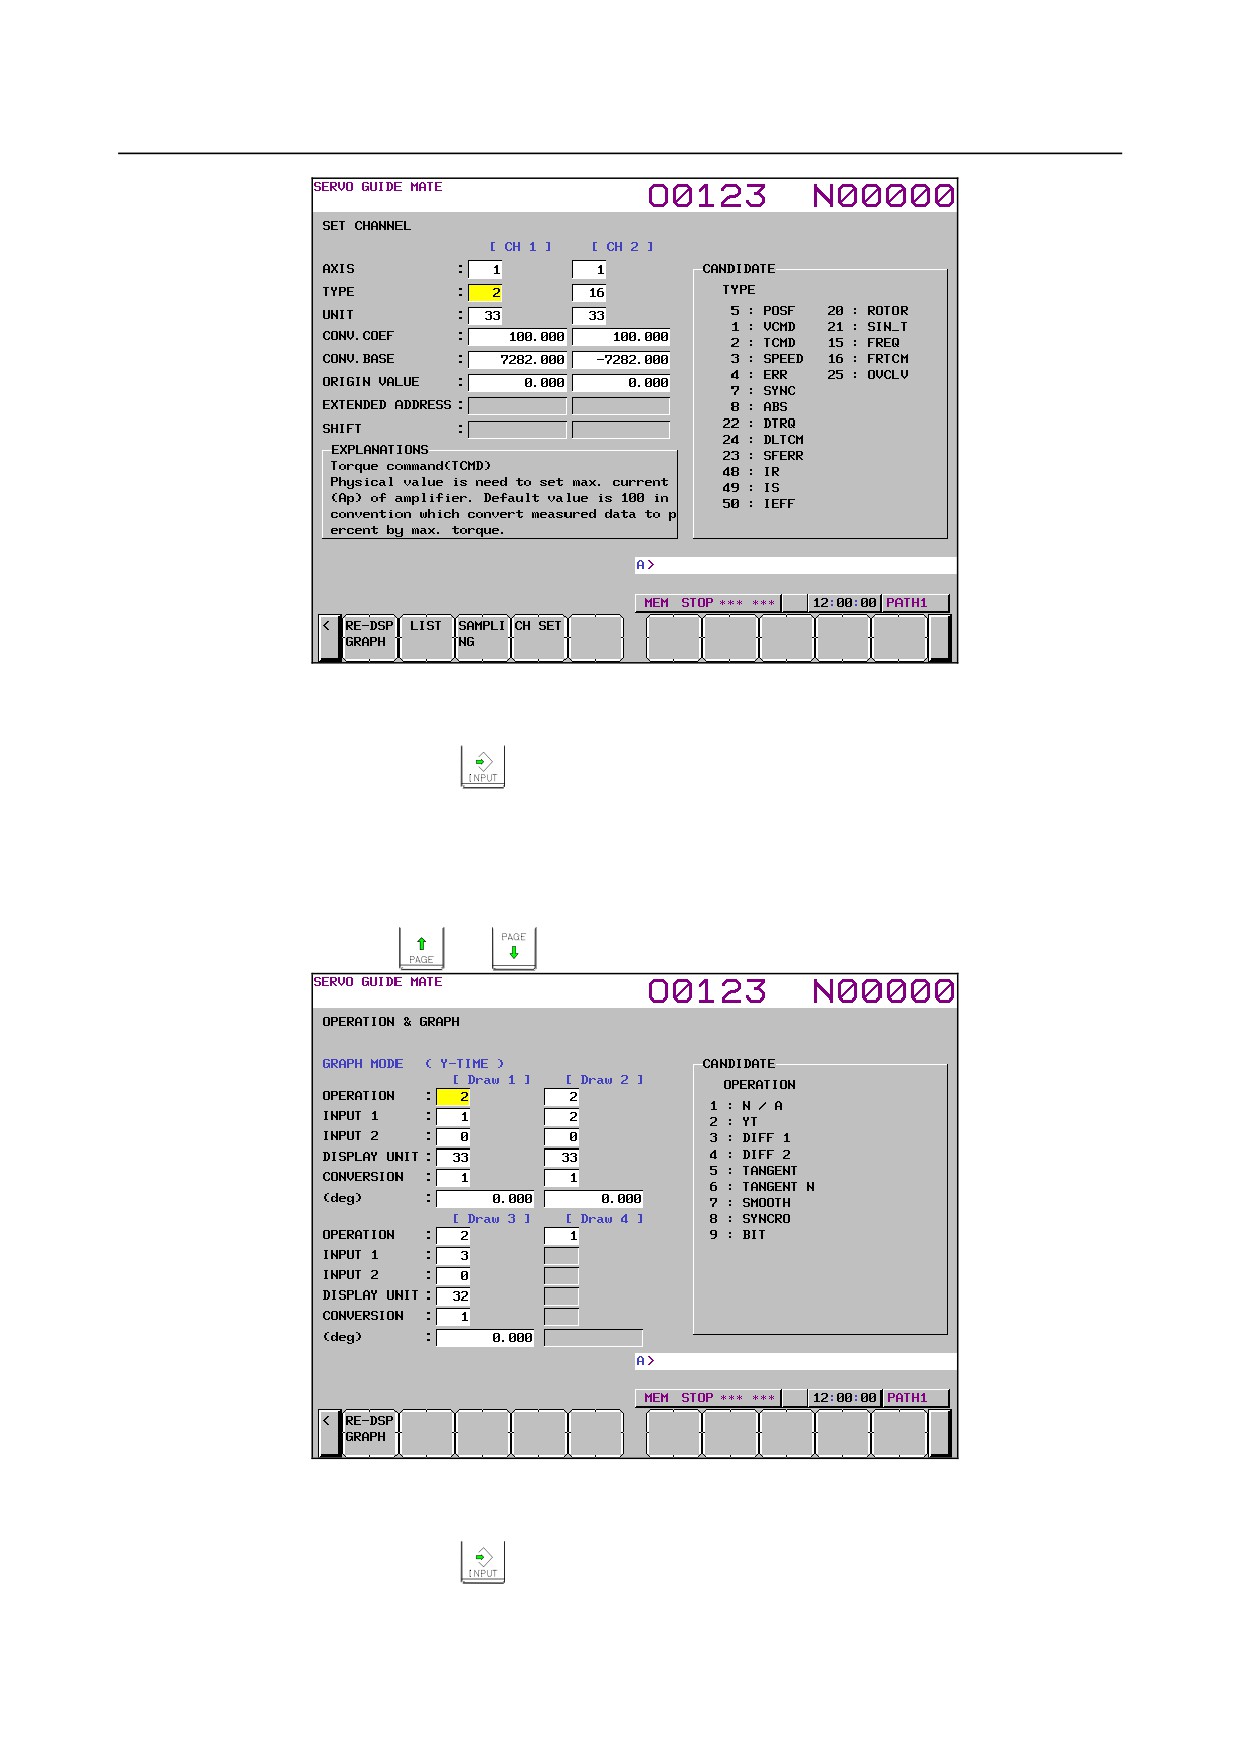
The channel setting screen is displayed as shown Fig. 1.9.1.1 (c).
To set any channel other than the one currently displayed, display the setting screen for the desired
channel by pressing the
or
key.
- 79 -
1.DISPLAY AND OPERATION
B-64485EN/01
Fig. 1.9.1.1 (c)
12 Move the cursor to the parameter you want to set, by pressing the cursor key.
13 Enter data and the press the
key.
14 Repeat steps 12 and 13 until you set all the parameters.
15 Click the soft key [RE-DSPGRAPH].
16 Click the soft key [OPERATION & GRAPH].
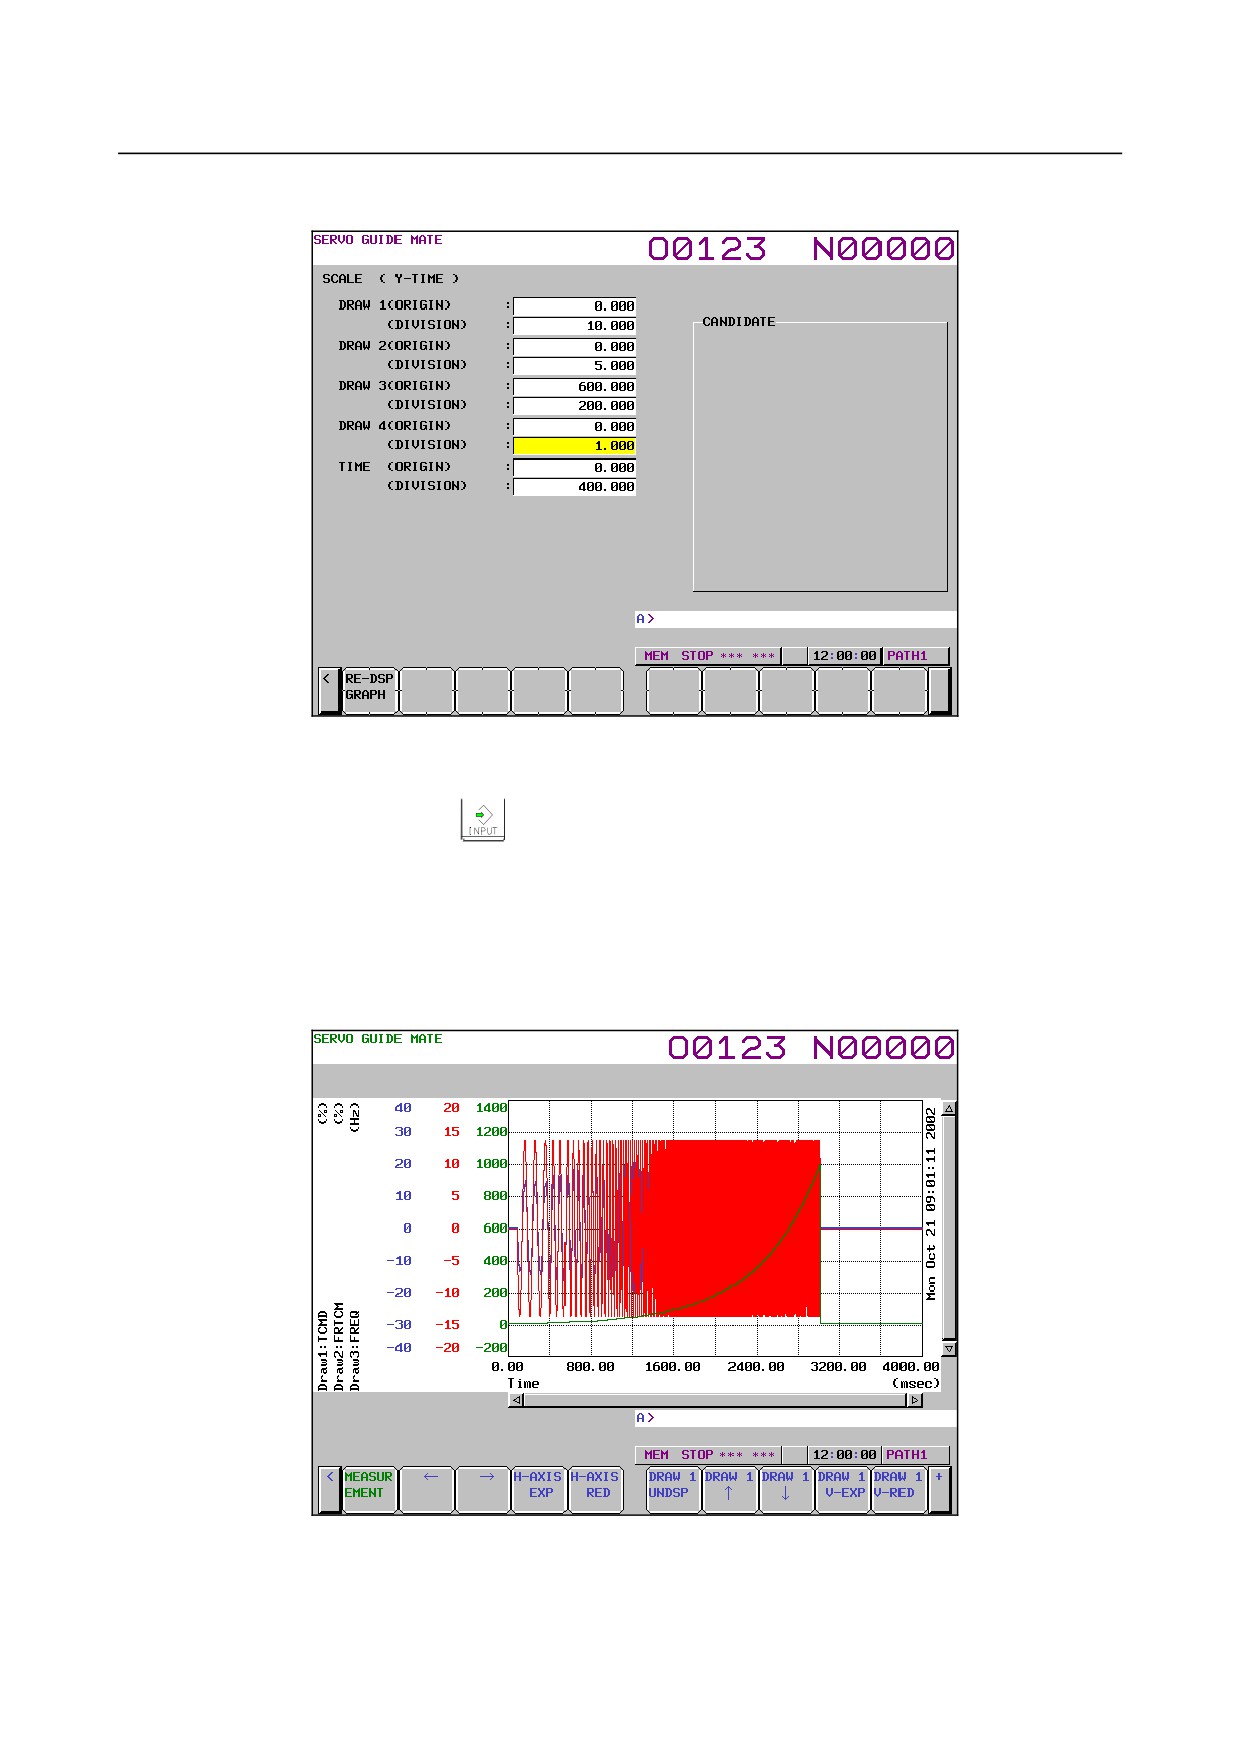
The operation and graph setting screen is displayed as shown Fig. 1.9.1.1 (d).
To set any draw other than the one currently displayed, display the setting screen for the desired
draw by pressing the
or
key.
Fig. 1.9.1.1 (d)
17 Move the cursor to the parameter you want to set, by pressing the cursor key.
18 Enter data and the press the
key.
19 Repeat steps 17 and 18 until you set all the parameters.
20 Click the soft key [RE-DSPGRAPH].
- 80 -
B-64485EN/01
1.DISPLAY AND OPERATION
21 Click the soft key [SCALE SET].
The scale setting screen is displayed as shown Fig. 1.9.1.1 (e).
Fig. 1.9.1.1 (e)
22 Move the cursor to the parameter you want to set, by pressing the cursor key.
23 Enter data and the press the
key.
24 Repeat steps 22 and 23 until you set all the parameters.
25 Click the soft key [RE-DSPGRAPH].
26 Click the soft key [MEASUREMENT].
27 Click the soft key [START].
28 Start the automatic or manual operation.
29 When the measurement is completed, the wave display screen is displayed as shown Fig. 1.9.1.1 (f).
Fig. 1.9.1.1 (f)
-
Changing the operation and graph setting screen
The procedure for changing the operation and graph setting screen as necessary is described below.
- 81 -
1.DISPLAY AND OPERATION
B-64485EN/01
1
Click the soft key [OPERATION & GRAPH].
The operation and graph setting screen is displayed as shown Fig. 1.9.1.1 (g).
To set any draw other than the one currently displayed, display the setting screen for the desired
draw by pressing the
or
key.
Fig. 1.9.1.1 (g)
2
Move the cursor to the parameter you want to set, by pressing the cursor key.
3
Enter data and the press the
key.
4
Repeat steps 2 and 3 until you set all the parameters.
5
Click the soft key [RE-DSPGRAPH].
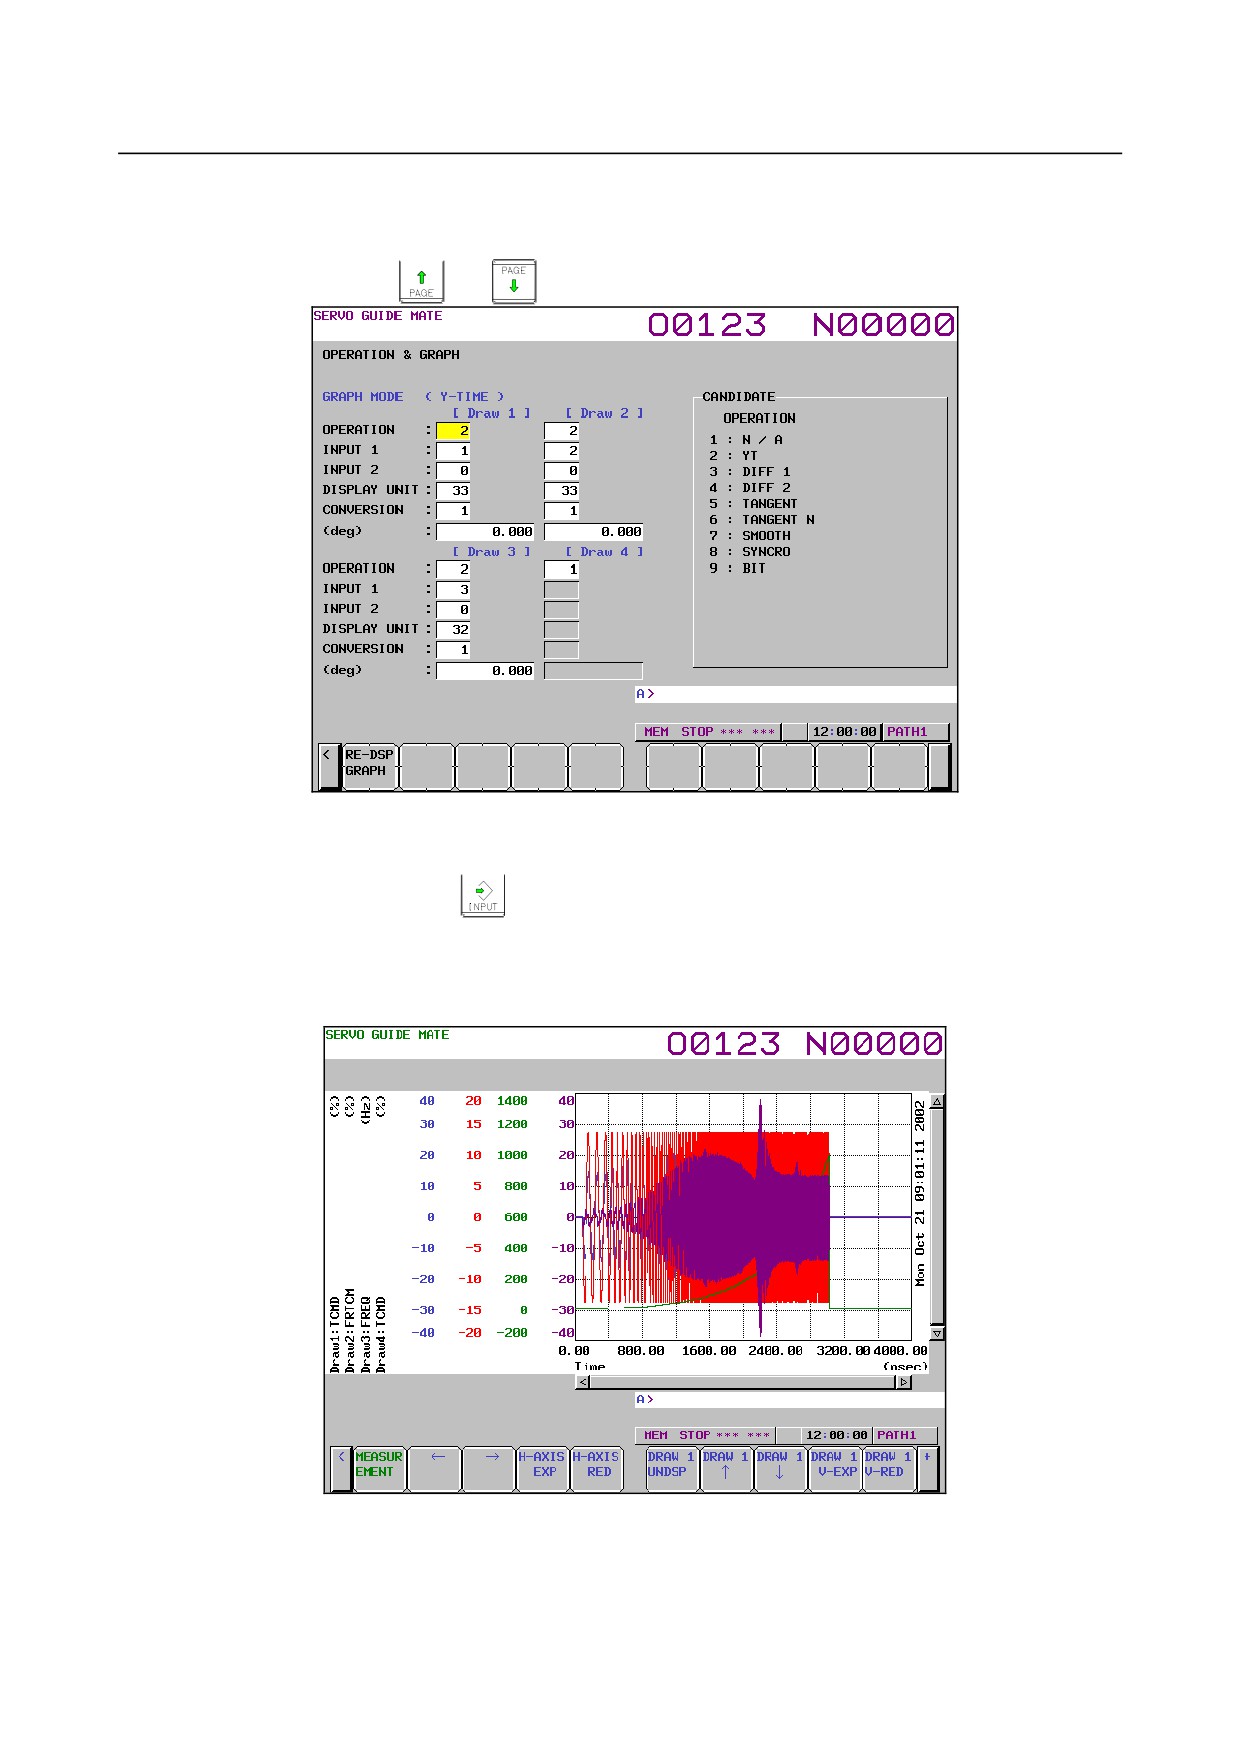
Based on the new operation and graph settings, the wave display screen is displayed as shown Fig.
1.9.1.1 (h).
Fig. 1.9.1.1 (h)
-
Changing the scale screen
The procedure for changing the scale settings as necessary is described below.
- 82 -
B-64485EN/01
1.DISPLAY AND OPERATION
1
Click the soft key [SCALE SET].
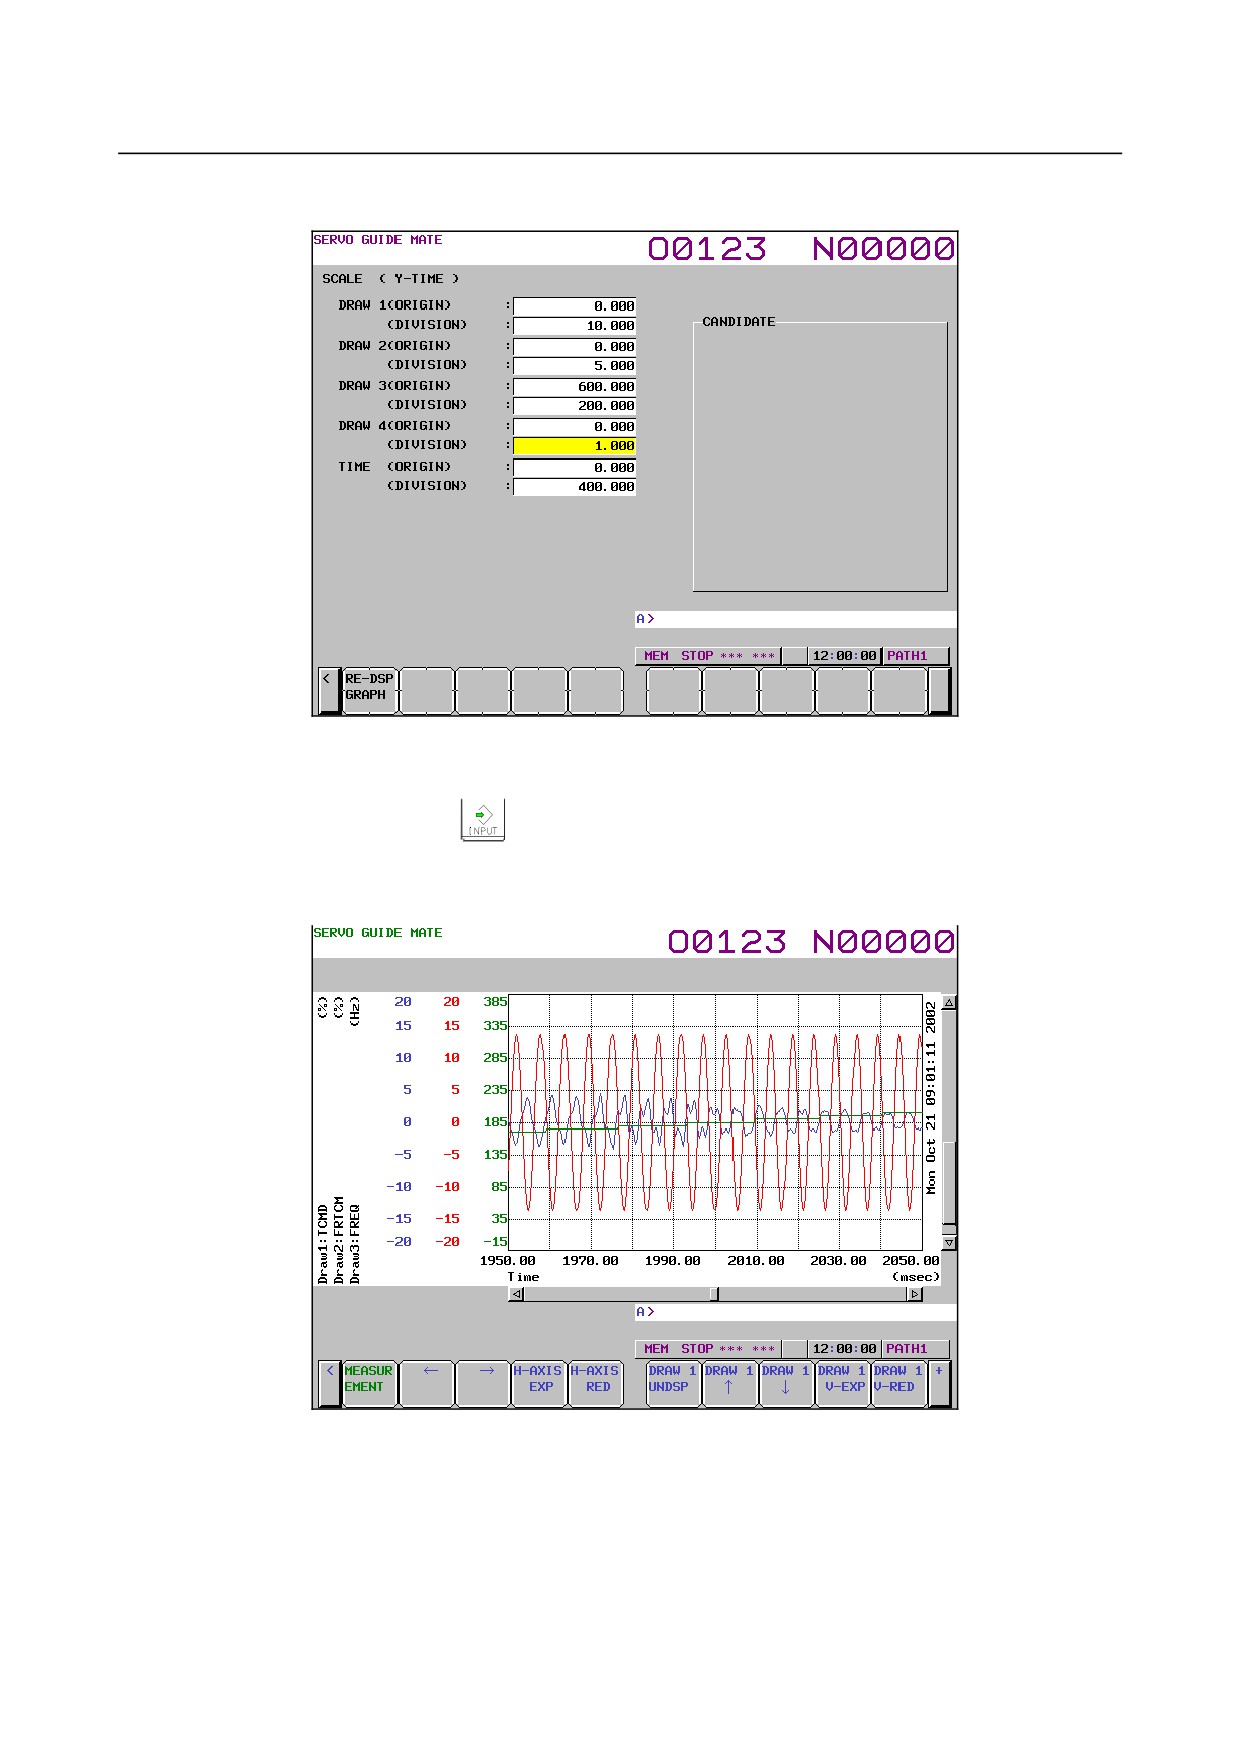
The scale setting screen is displayed as shown Fig. 1.9.1.1 (i).
Fig. 1.9.1.1 (i)
2
Move the cursor to the parameter you want to set, by pressing the cursor key.
3
Enter data and the press the
key.
4
Repeat steps 2 and 3 until you set all the parameters.
5
Click the soft key [RE-DSPGRAPH].
Based on the new scale settings, the wave display screen is displayed as shown Fig. 1.9.1.1 (j).
Fig. 1.9.1.1 (j)
-
Manipulating the Y-time graph
By clicking the following soft keys, you can perform the operations corresponding to them.
[MEASUREMENT] : Performs a measurement-related operation.
[←]
: Shifts the time axis to the right.
[→]
: Shifts the time axis to the left.
[H-AXIS EXP]
: Expands the time axis.
- 83 -

1.DISPLAY AND OPERATION
B-64485EN/01
[H-AXIS RED]
:
Reduces the time axis.
[DRAW 1UNDSP]
:
Sets whether or not to display Draw 1.
[DRAW 1 ↑]
:
Shifts Draw 1 downward.
[DRAW 1 ↓]
:
Shifts Draw 1 upward.
[DRAW 1 V-EXP]
:
Expands Draw 1.
[DRAW 1 V-RED]
:
Reduces Draw 1.
[DRAW 2UNDSP]
:
Sets whether or not to display Draw 2.
[DRAW 2 ↑]
:
Shifts Draw 2 downward.
[DRAW 2 ↓]
:
Shifts Draw 2 upward.
[DRAW 2 V-EXP]
:
Expands Draw 2.
[DRAW 2 V-RED]
:
Reduces Draw 2.
[DRAW 3UNDSP]
:
Sets whether or not to display Draw 3.
[DRAW 3 ↑]
:
Shifts Draw 3 downward.
[DRAW 3 ↓]
:
Shifts Draw 3 upward.
[DRAW 3 V-EXP]
:
Expands Draw 3.
[DRAW 3 V-RED]
:
Reduces Draw 3.
[DRAW 4UNDSP]
:
Sets whether or not to display Draw 4.
[DRAW 4 ↑]
:
Shifts Draw 4 downward.
[DRAW 4 ↓]
:
Shifts Draw 4 upward.
[DRAW 4 V-EXP]
:
Expands Draw 4.
[DRAW 4 V-RED]
:
Reduces Draw 4.
[AUTO SCALE]
:
Enables auto scaling.
[V-AXIS EXP]
:
Expands all draws.
[V-AXIS RED]
:
Reduces all draws.
[OPE/G SET]
:
Sets operations and graphs.
[SCALE SET]
:
Sets scales.
[COM1 INPUT]
:
Inputs comment 1.
[COM2 INPUT]
:
Inputs comment 2.
[XY]
:
Switches to the XY graph.
[CIRCLE]
:
Switches to the Circle graph.
[FOURIER]
:
Switches to the Fourier graph.
[BODE]
:
Switches to the Bode graph.
-
Performing measurement
When you click the soft key [MEASUREMENT], you can perform the operations corresponding to the
menu items that follow.
[START]
: Starts measurement.
[ORIGIN]
: Sets the origin value.
[STOP]
: Stops measurement.
[DATA IN]
: Specifies measurement-related settings.
-
Changing measurement settings
1
When you click the soft key [MEASUREMENT] and then the soft key [DATA IN], you can perform
the operations corresponding to the menu items that follow.
2
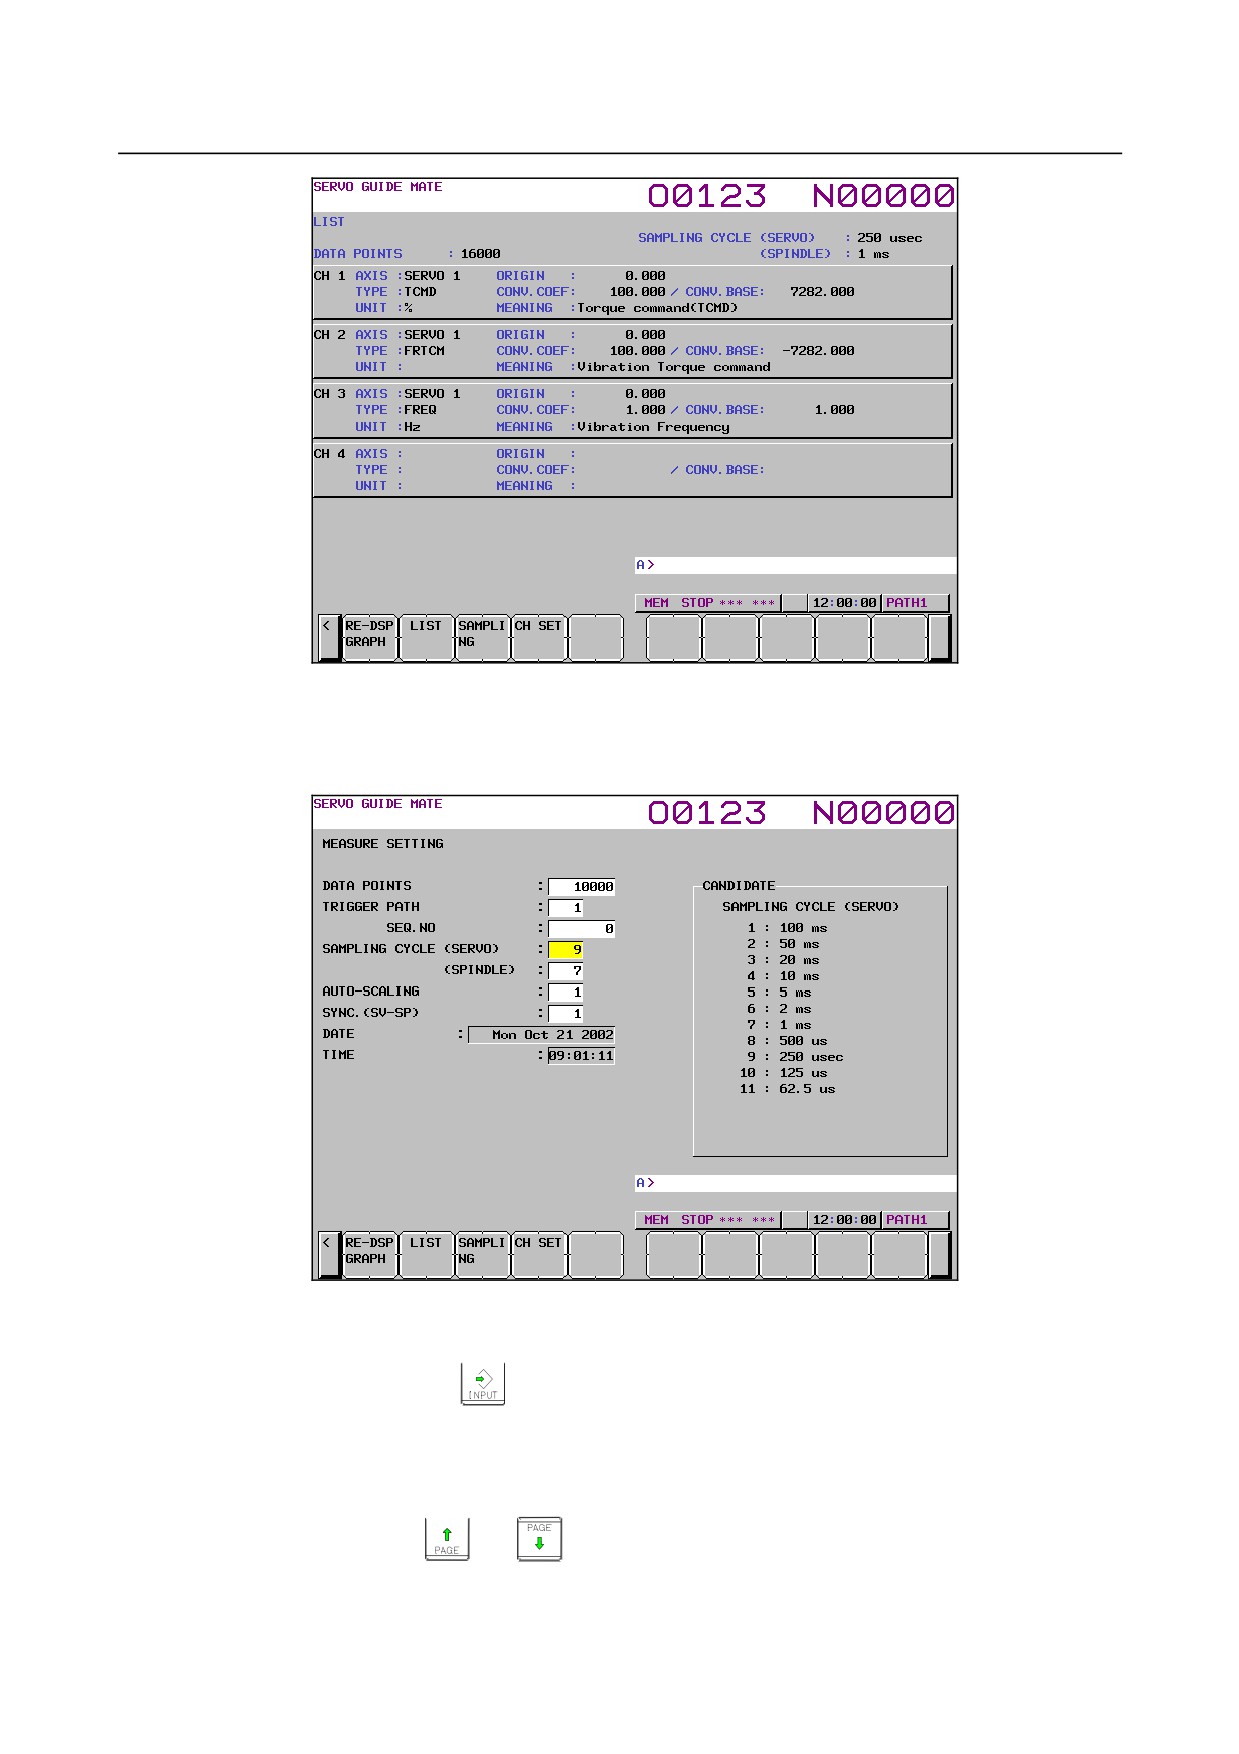
Click the soft key [LIST].
The list screen is displayed as shown Fig. 1.9.1.1 (k).
To display any channel other than the one currently displayed, display the list screen for the desired
channel by pressing the
or
key.
- 84 -
B-64485EN/01
1.DISPLAY AND OPERATION
Fig. 1.9.1.1 (k)
3
Check the current settings on the list screen.
4
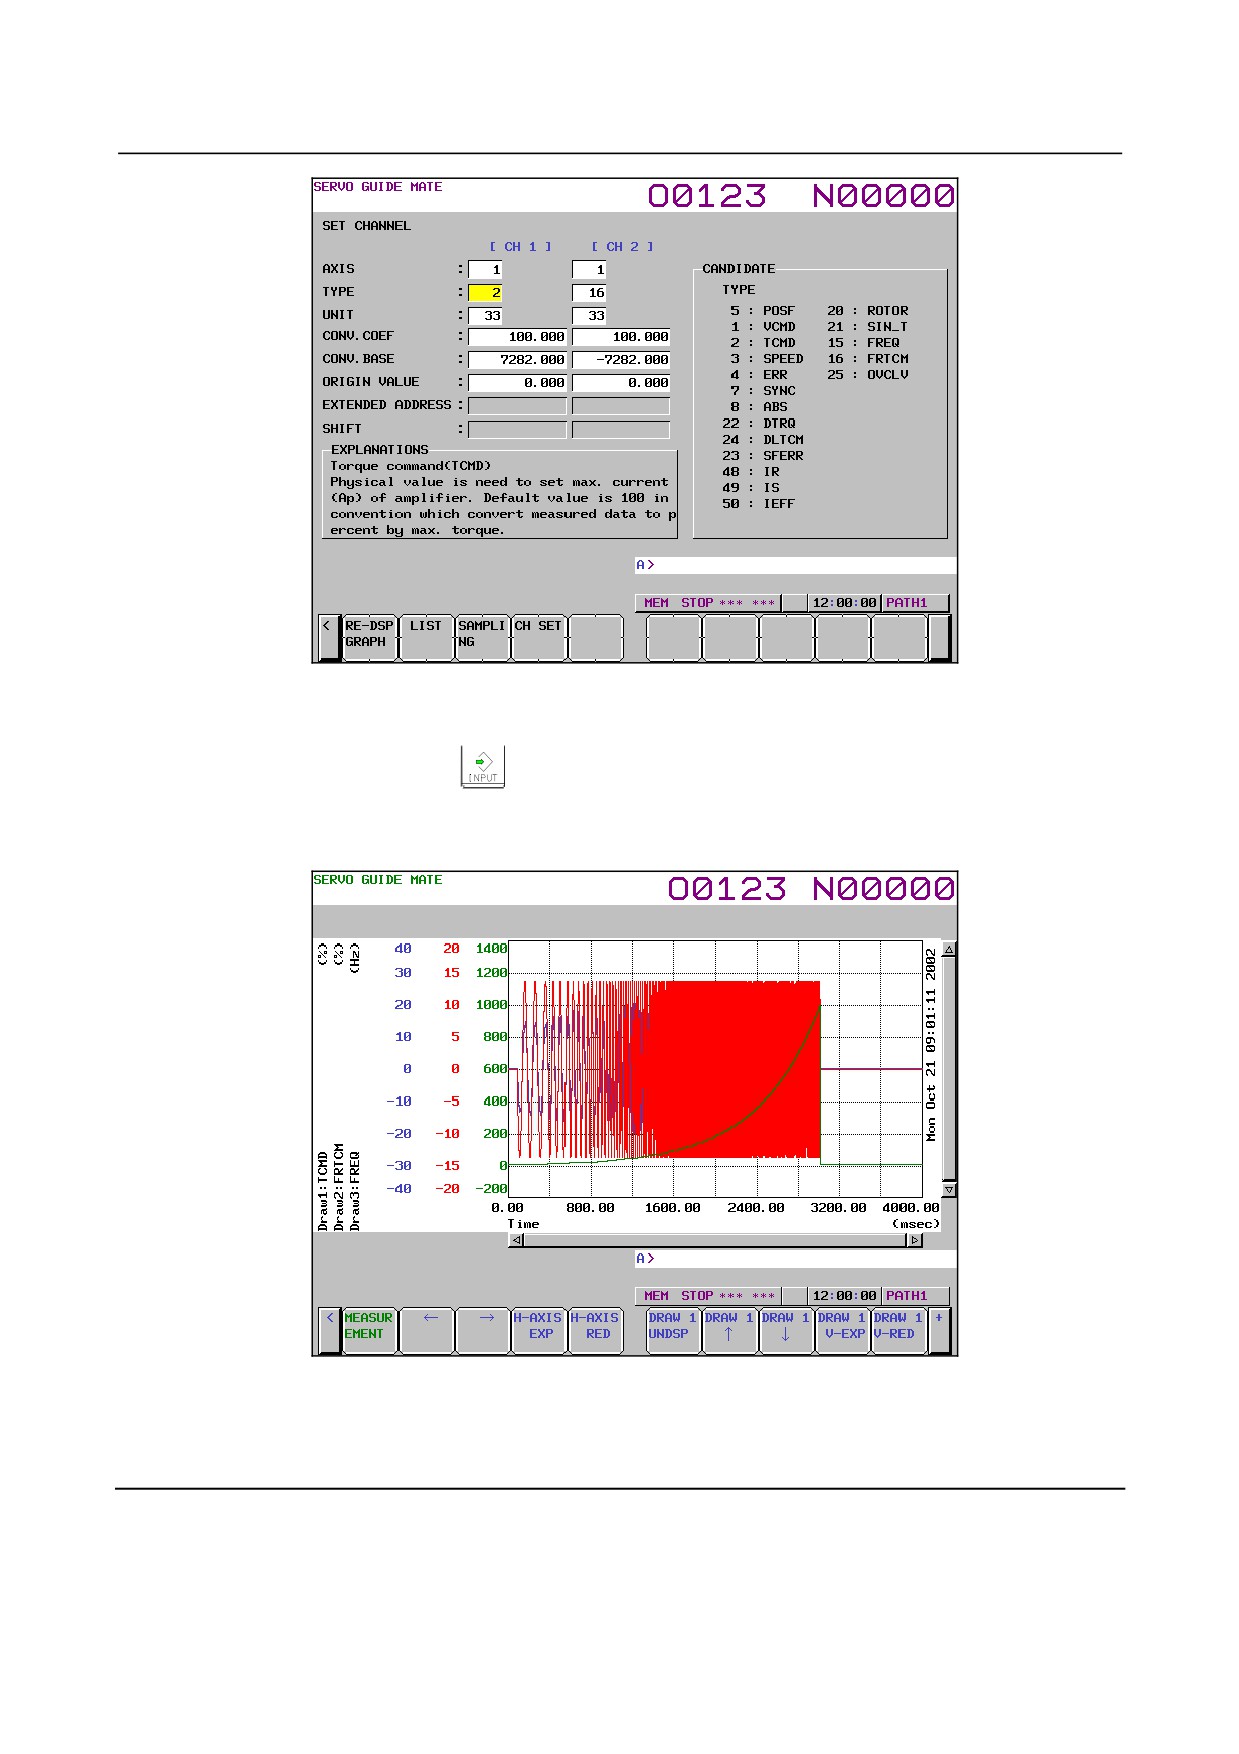
Click the soft key [SAMPLING].
The data-in screen is displayed as shown Fig. 1.9.1.1 (l).
Fig. 1.9.1.1 (l)
5
Move the cursor to the parameter you want to set, by pressing the cursor key.
6
Enter data and the press the
key.
7
Repeat steps 5 and 6 until you set all the parameters.
8
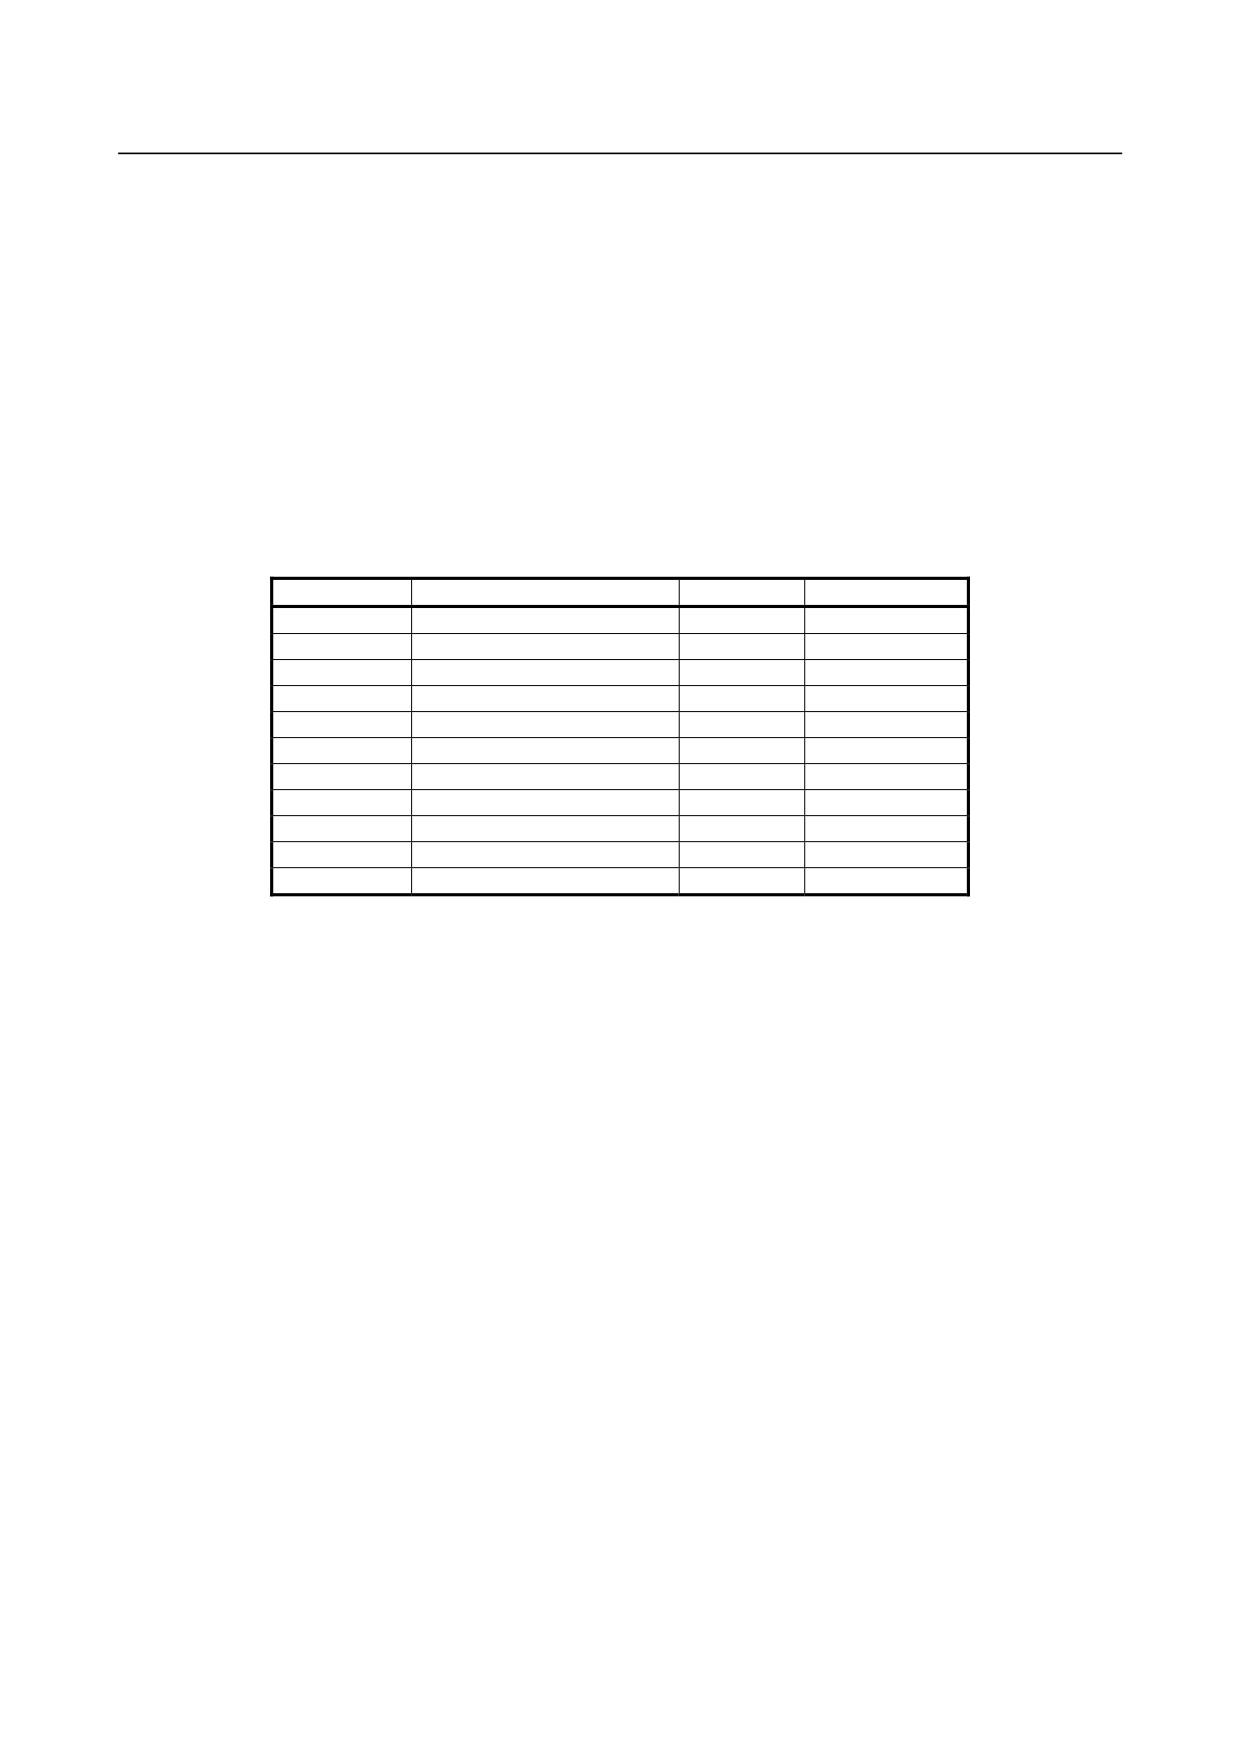
Click the soft key [SET CHANNEL].
The channel setting screen is displayed as shown Fig. 1.9.1.1 (m).
To set any channel other than the one currently displayed, display the setting screen for the desired
channel by pressing the
or
key.
- 85 -
1.DISPLAY AND OPERATION
B-64485EN/01
Fig. 1.9.1.1 (m)
9
Move the cursor to the parameter you want to set, by pressing the cursor key.
10 Enter data and the press the
key.
11 Repeat steps 9 and 10 until you set all the parameters.
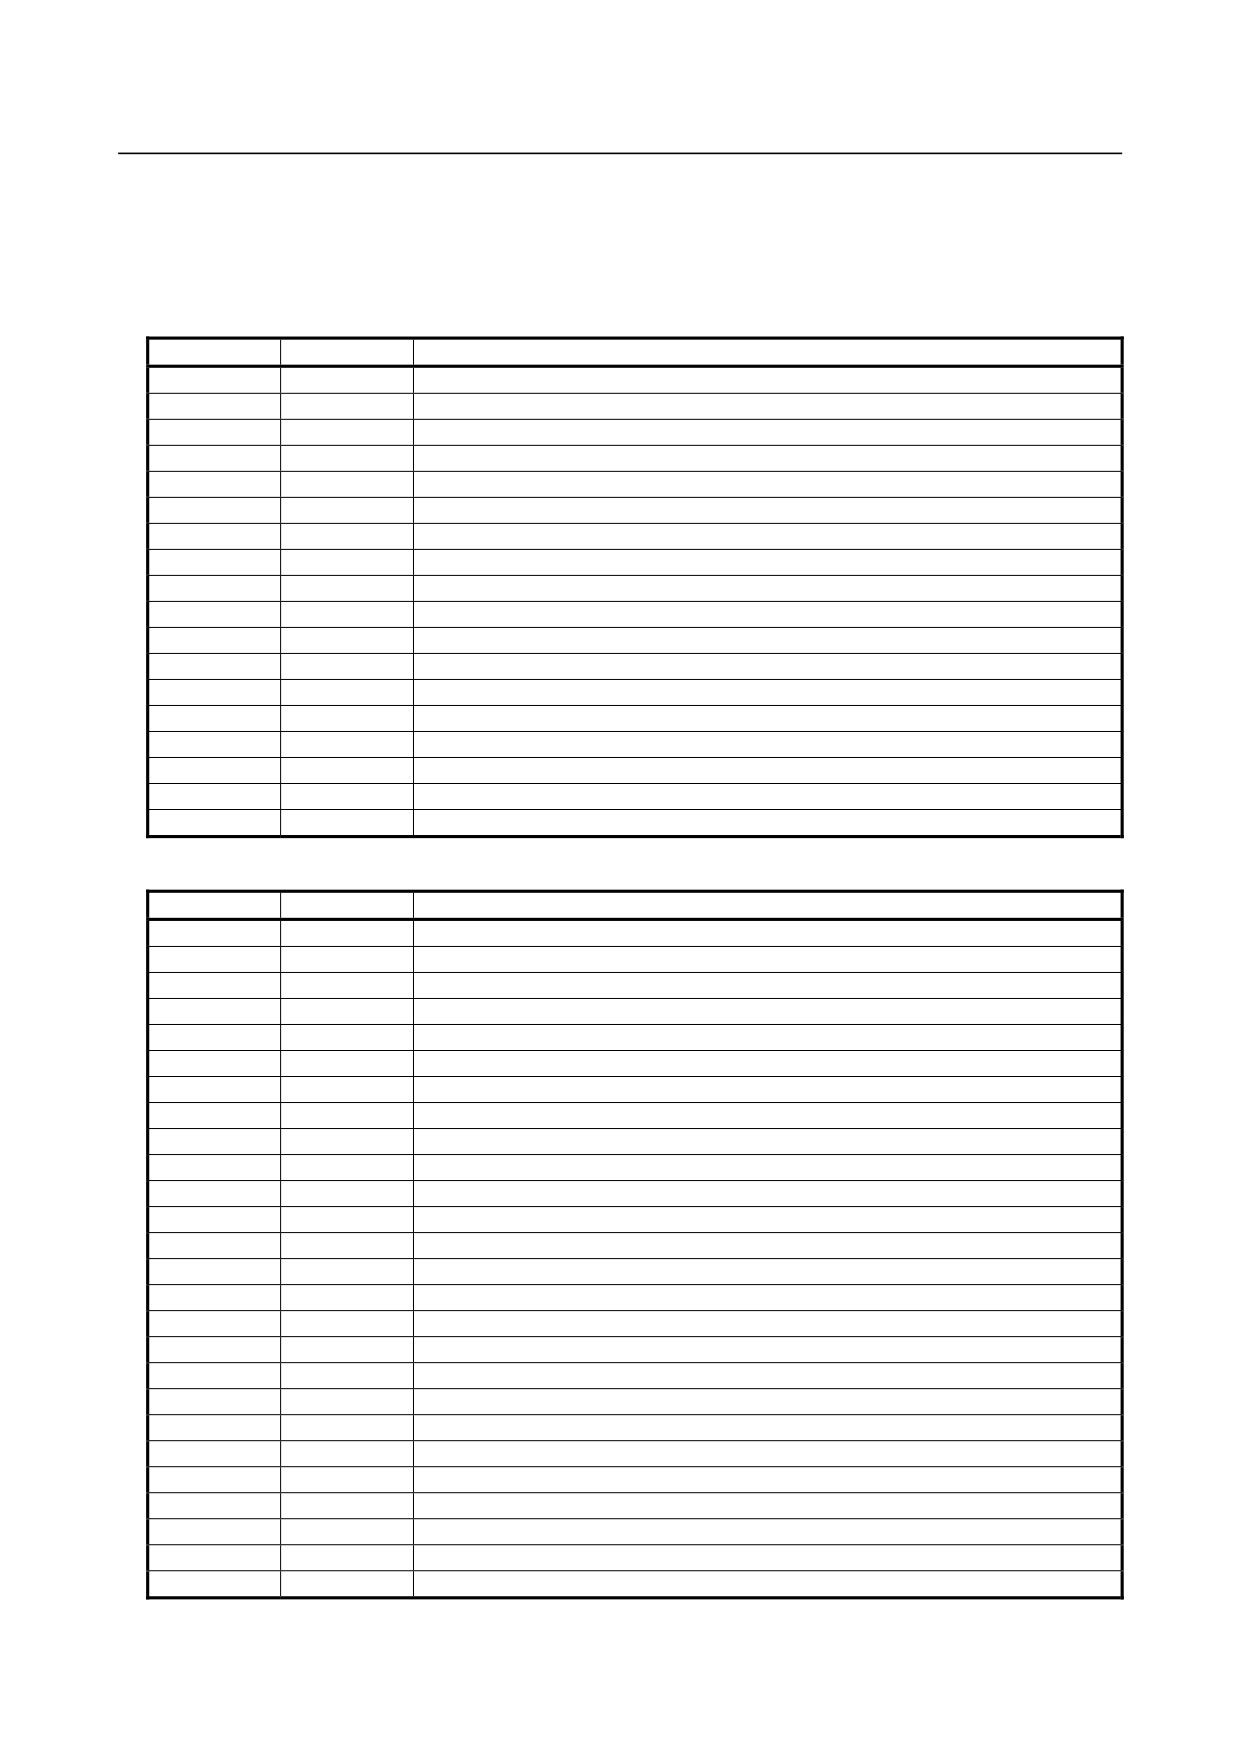
12 Click the soft key [RE-DSPGRAPH].
The wave display screen is displayed as shown Fig. 1.9.1.1 (n).
Fig. 1.9.1.1 (n)
13 The new settings will take effect next time you perform measurement. Change the operation/graph
settings and scale settings according to the new channel settings.
Explanation
-
Setting the data-in screen
• Measurement data points
Enter a numerical value between 1 and 10000. This setting represents the number of data points to
be measured.
- 86 -
B-64485EN/01
1.DISPLAY AND OPERATION
The data measurement time is calculated by multiplying the data points by the sampling cycle. If
different sampling cycles are set for the servo axis and spindle axis, the data points for the shorter
sampling cycle apply. The data points for the longer sampling cycle is decreased according to the
sampling cycle ratio.
•
Trigger path and sequential number
Enter numerical values
- path number and sequential number - that specify when to trigger
measurement. Numerical values that can be specified as path numbers are sequential, starting at Path
1, with the maximum value being the number of paths that are set to the CNC. The range of
sequential numbers is from 0 to 99999. If 0 is specified as the sequential number, measurement starts
immediately after you click the soft key [MEASUREMENT] and then the soft key [START].
•
Sampling cycle (servo and spindle)
Enter numerical values that specify the sampling cycles for the servo axis and spindle axis separately.
The specifiable values are listed in Table 1.9.1.1 (a), Sampling cycles.
Table 1.9.1.1 (a) Sampling cycles
Input value
Meaning (sampling cycle)
Servo axis
Spindle axis
1
100ms
Specifiable
Specifiable
2
50ms
Specifiable
Specifiable
3
20ms
Specifiable
Specifiable
4
10ms
Specifiable
Specifiable
5
5ms
Specifiable
Specifiable
6
2ms
Specifiable
Specifiable
7
1ms
Specifiable
Specifiable
8
500μs
Specifiable
Specifiable
9
250μs
Specifiable
Unspecifiable
10
125μs
Specifiable
Unspecifiable
11
62.5μs
Specifiable
Unspecifiable
•
Auto scaling
Enter a numerical value that specifies whether to perform auto scaling each time a measurement is
made. The specifiable values are 1 (do not perform), 2 (perform only once), and 3 (perform each
time). When auto scaling is enabled, the wave scale is changed so that the entire wave can be
displayed within the display range of the graph. Therefore, when you want to monitor changes in the
wave size, it is better to fix the scale, rather than using the auto scaling function.
•
Synchronization mode selection
The specifiable values are 1 (do not select) and 2 (select).
This function may be useful in cases where data is not synchronized in terms of time due to different
sampling cycles when interpolation between servo axis and spindle axis is performed through Cs
contour control or other means. (In some cases, the function may not produce any effect.)
•
Date and time
The date and time when data is measured are displayed. (This is a read-only item.)
-
Setting the channel setting screen
Up to four sets of measurement data can be specified per channel. Be sure to set measurement data
starting with the smallest channel number.
• Axis
Specify an axis number for the data to be specified. Use a positive control axis number when
specifying a servo axis or a negative control axis number when specifying a spindle axis. The
maximum number that can be specified is equal to the number of servo axes and spindle axes that
are set to the CNC respectively. When enabling channels, be sure to specify the channel numbers
sequentially, starting with the smallest channel number. Setting
0 disables the channel
(not
measured).
- 87 -
1.DISPLAY AND OPERATION
B-64485EN/01
• Type
When a servo axis is selected, the specifiable values are as shown in Table 1.9.1.1 (b), Servo motor
measurement data types. When a spindle axis is selected, the specifiable values are as shown in
Table 1.9.1.1 (c), Spindle motor measurement data types. Specify the type of data you want to
measure.
Table 1.9.1.1 (b) Servo motor measurement data types
Input value
Item name
Description
5
POSF
Position feedback integrated value
1
VCMD
Velocity command
2
TCMD
Torque command
3
SPEED
Motor speed
4
ERR
Position error
7
SYNC
Right tapping synchronization error (tap axis only)
8
ABS
Absolute position of the built-in pulse coder
22
DTRQ
Estimated disturbance torque
24
DLTCM
Synchronous axis torque difference
23
SFERR
Dual position feedback semi-full error
48
IR
R phase current value
49
IS
S phase current value
50
IEFF
Effective current
20
ROTOR
Rotor phase
21
SIN_T
Rotor position SINθ
15
FREQ
Disturbance input frequency (used to measure frequency characteristics)
16
FRTCM
Disturbance torque (used to measure frequency characteristics)
25
OVCLV
OVC level
Table 1.9.1.1 (c) Spindle motor measurement data types
Input value
Item name
Description
1
SPEED
Motor speed
2
INORM
Motor current amplitude
3
TCMD
Torque command
4
VCMD
Velocity command
5
VERR
Velocity error
7
PERR1
Position error
8
ORERR
Orientation position error
9
PCPOS
Position feedback integrated value
10
MCMD
Command pulse per ITP cycle
11
PERR2
Position error
13
CSPOS
Position feedback integrated value
14
SPCMD
Velocity command data
15
SPCT1
Spindle control signal 1
16
SPCT2
Spindle control signal 2
17
SPST1
Spindle status signal 1
18
SPST2
Spindle status signal 2
19
ORSEQ
Orientation sequence data
20
FREQ
Vibration frequency
21
FRTCM
Vibration torque command
25
PA1
AD value of the motor sensor A phase signal
26
PB1
AD value of the motor sensor B phase signal
27
PA2
AD value of the spindle sensor A phase signal
28
PB2
AD value of the spindle sensor B phase signal
29
MFBDF
Motor feedback incremental data
30
SFBDF
Spindle feedback incremental data
32
DTRQ
Estimated load torque
- 88 -
B-64485EN/01
1.DISPLAY AND OPERATION
• Unit
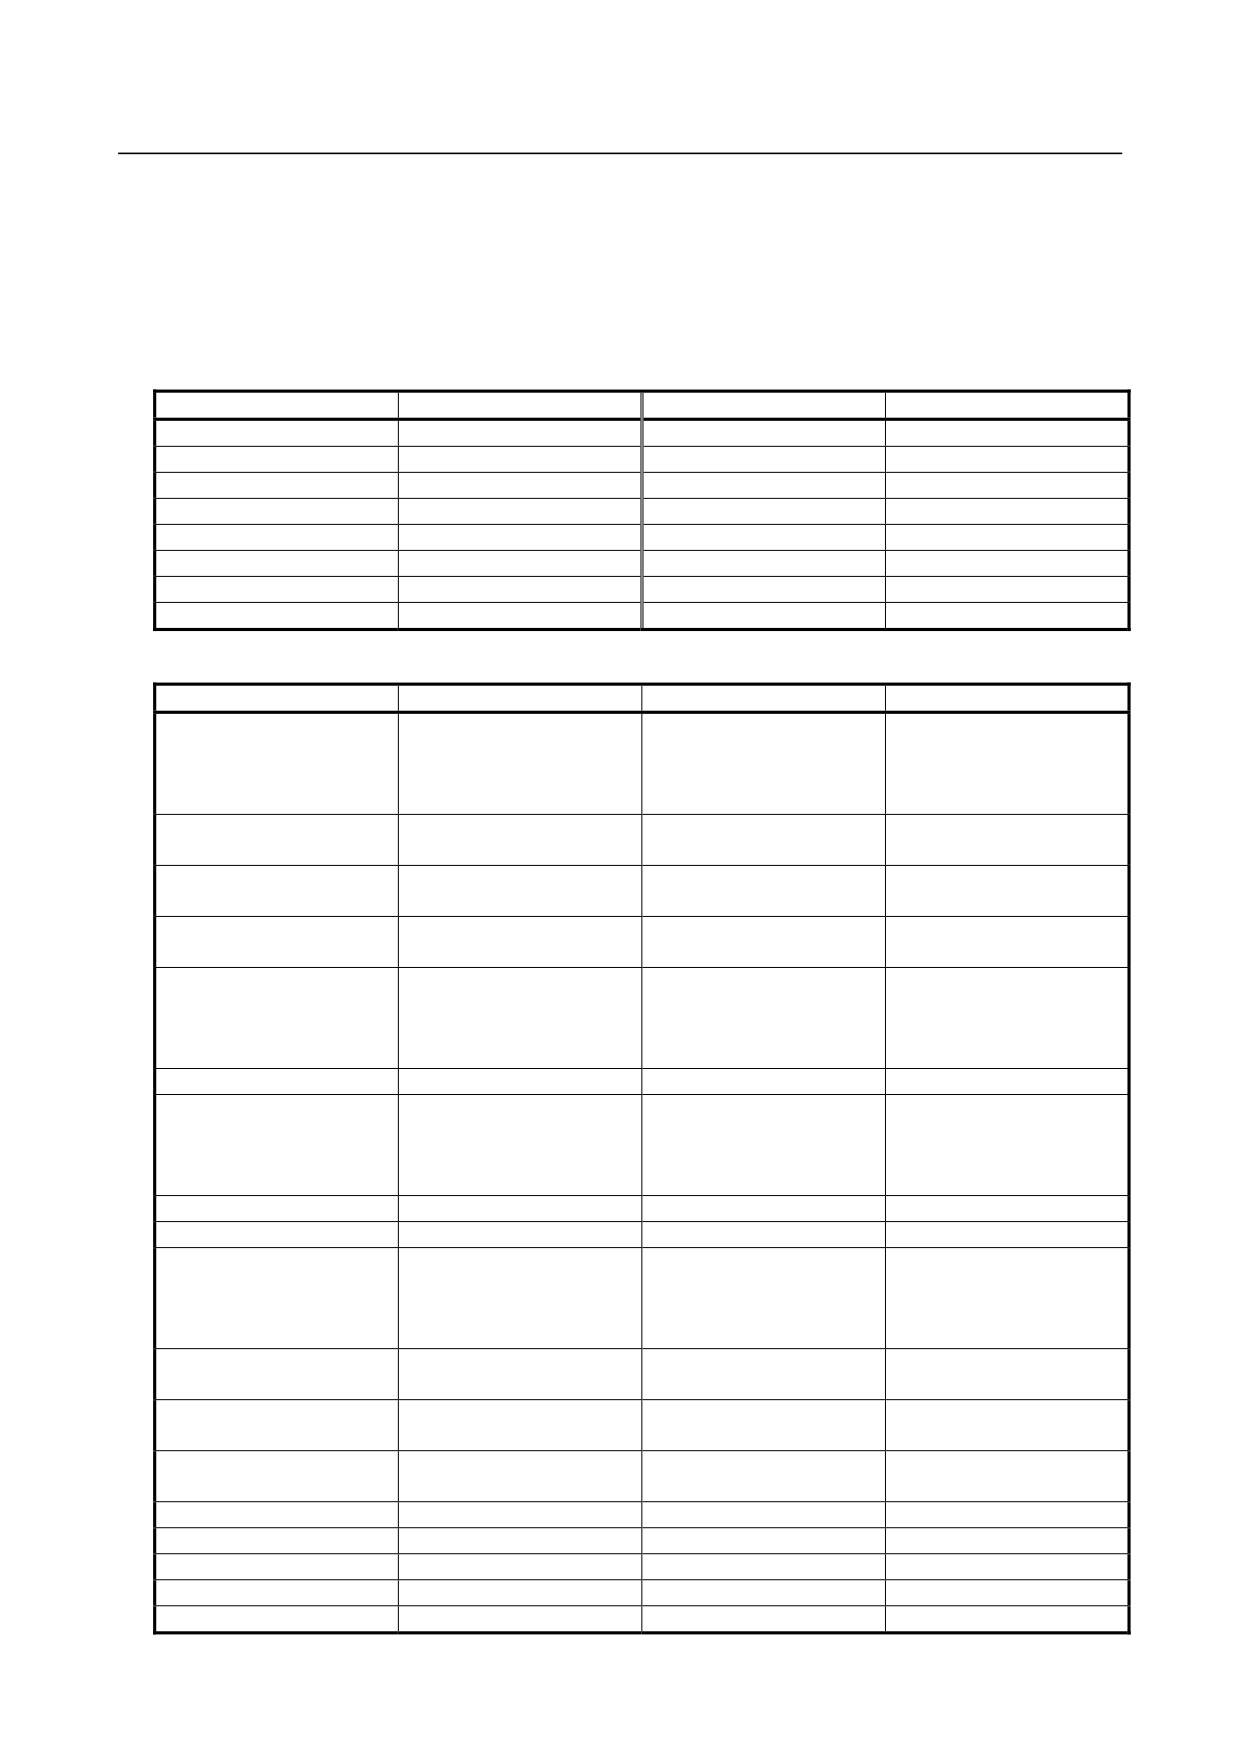
The specifiable values are as shown in Table 1.9.1.1 (d), Measurement data units. However, as
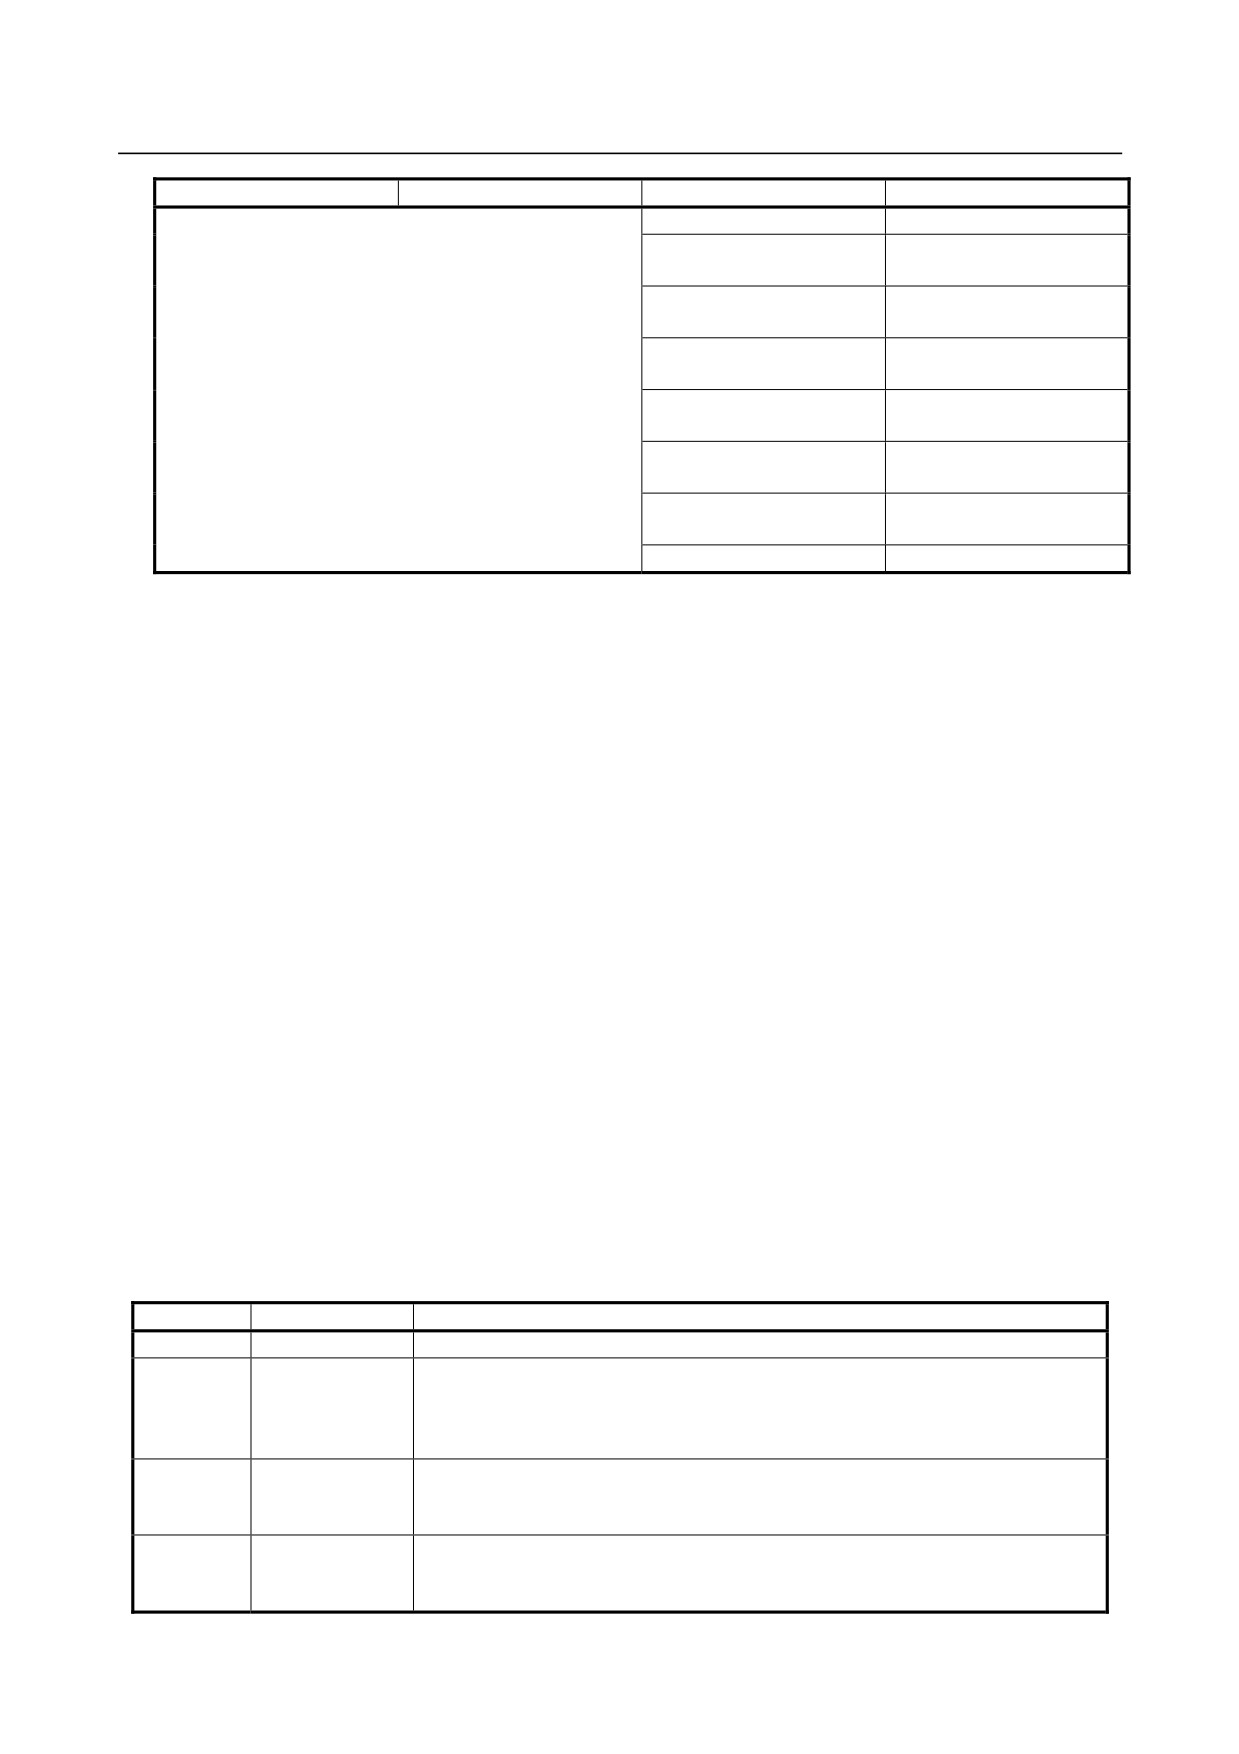
shown in Table 1.9.1.1 (e), Corresponding measurement data units, you cannot specify any unit
other than that corresponding to the type of measurement data. Under normal circumstances, the
automatically set values do not need to be changed. When performing polar coordinate conversion
or other operation that requires information about the actual position of the rotation axis, deg needs
to be selected as the unit.
Table 1.9.1.1 (d) Measurement data units
Input value
Unit
Input value
Unit
4
mm
31
A(p)
5
m
33
%
6
μm
34
pulse
7
nm
35
bit
8
inch
32
Hz
9
deg
36
--
20
1/min
38
V(p)
14
m/min
39
rev
Table 1.9.1.1 (e) Corresponding measurement data units
Servo motor data type
Corresponding unit
Spindle motor data type
Corresponding unit
4 : mm
6 : μm
5 : POSF
1 : SPEED
20 : 1/min
8 : inch
9 : deg
20 : 1/min
36 : --
1 : VCMD
2 : INORM
14 : m/min
31 : A(p)
31 : A(p)
33 : %
2 : TCMD
3 : TCMD
33 : %
31 : A(p)
20 : 1/min
3 : SPEED
4 : VCMD
20 : 1/min
14 : m/min
4 : mm
6 : μm
4 : ERR
5 : VERR
20 : 1/min
8 : inch
9 : deg
7 : SYNC
36 : --
7 : PERR1
9 : deg
4 : mm
6 : μm
9 : deg
8 : ABS
8 : ORERR
8 : inch
34 : pulse
9 : deg
22 : DTRQ
31 : A(p)
9 : PCPOS
9 : deg
24 : DLTCM
31 : A(p)
10 : MCMD
34 : pulse
4 : mm
6 : μm
23 : SFERR
11 : PERR2
34 : pulse
8 : inch
9 : deg
31 : A(p)
48 : IR
13 : CSPOS
9 : deg
33 : %
31 : A(p)
49 : IS
14 : SPCMD
36 : --
33 : %
31 : A(p)
50 : IEFF
15 : SPCT1
36 : --
33 : %
20 : ROTOR
9 : deg
16 : SPCT2
36 : --
21 : SIN_T
36 : --
17 : SPST1
36 : --
15 : FREQ
32 : Hz
18 : SPST2
36 : --
16 : FRTCM
31 : A(p)
19 : ORSEQ
36 : --
25 : OVCLV
33 : %
20 : FREQ
32 : Hz
- 89 -
1.DISPLAY AND OPERATION
B-64485EN/01
Servo motor data type
Corresponding unit
Spindle motor data type
Corresponding unit
21 : FRTCM
31 : A(p)
25:PA1
38:V(p)
33:%
26:PB1
38:V(p)
33:%
27:PA2
38:V(p)
33:%
28:PB2
38:V(p)
33:%
29:MFBDF
9:deg
39:rev
30:SFBDF
9:deg
39:rev
32:DTRQ
33:%
•
Conversion coefficient
Set the weight of the data selected for each channel type (numerator = physical amount). For POSF
and other position-related data, specify the amount of travel per pulse. For VCMD and SPEED,
specify 3750. For TCMD, specify the maximum current value of the amplifier in use.
•
Conversion base
Set the weight of the data selected for each channel type (denominator = raw data unit). Under
normal circumstances, use the value that is automatically set when the type is selected. Usually, the
system automatically sets 1 for POSF and other position-related data, 32768 for VCMD and SPEED,
and 7282 for TCMD.
•
Origin value
Specify the value that is to be set as the initial value for each channel when you click the soft key
[MEASUREMENT] and then the soft key [ORIGIN].
•
Extended address
Under normal circumstances, this item is unspecifiable and not used. (This is a read-only item.)
•
Shift
Under normal circumstances, this item is unspecifiable and not used.
(A value may be set
automatically when the type is selected.)
-
Setting the operation and graph setting screen
In the operation and graph setting screen, up to four graphs can be set per draw.
• Operation
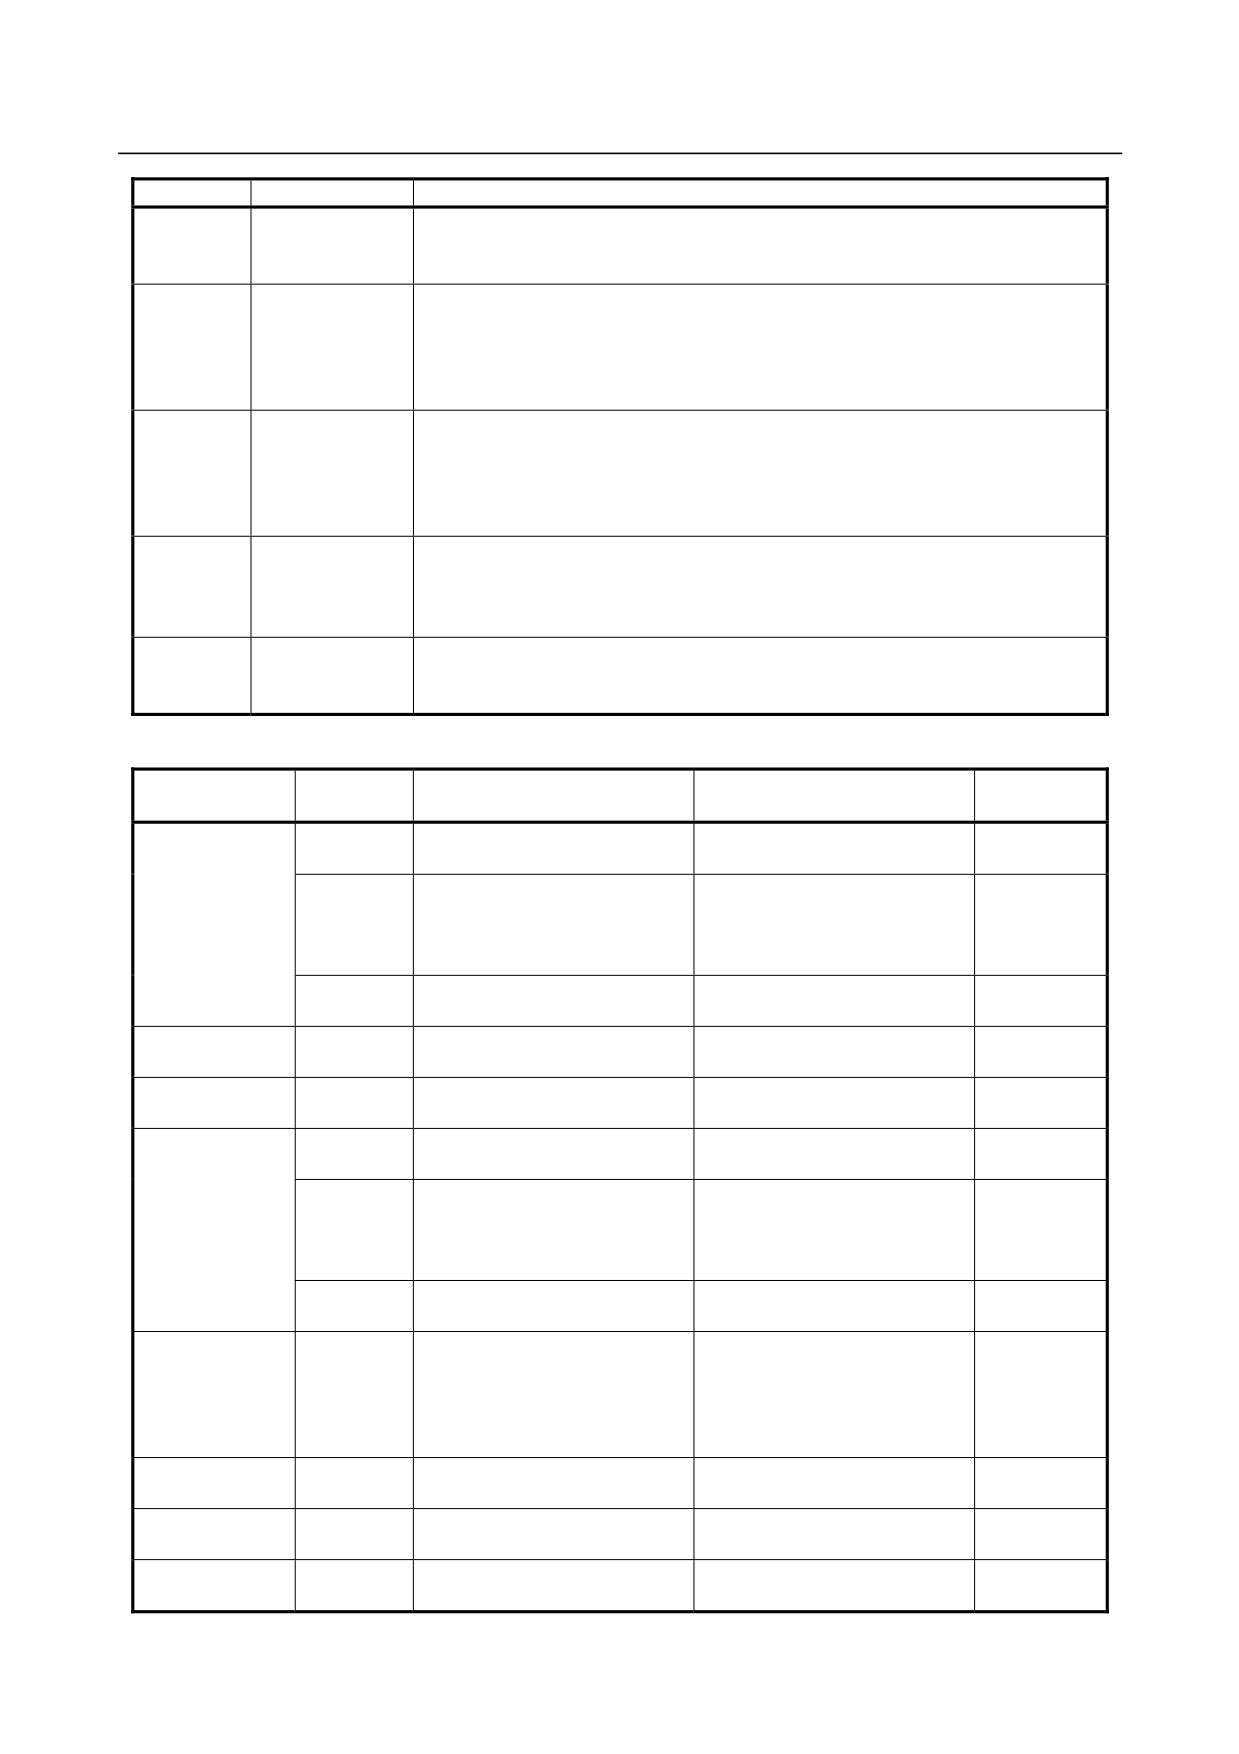
The specifiable values are as shown in Table 1.9.1.1 (f), Y-time graph operations.
An operation cannot be specified if it does not meet the graph display conditions defined in Table
1.9.1.1 (g), Y-time graph conditions.
Table 1.9.1.1 (f) Y-time graph operations
Input value
Operation name
Description
1
N/A
Not displayed.
Normal display
(The data of the sleeted channel is displayed as is, without performing any
2
Y-Time
operations.) Input 1 is the vertical axis. All measurement channels are available to
be selected.
First order differential display of position data (equivalent to velocity)
3
Diff1 ( VT )
Input 1 is the vertical axis. Only those channels whose positions have been
measured can be selected.
Second order differential display of position data (equivalent to acceleration)
4
Diff2 ( AT )
Input 1 is the vertical axis. Only those channels whose positions have been
measured can be selected.
- 90 -
B-64485EN/01
1.DISPLAY AND OPERATION
Input value
Operation name
Description
Tangent speed display
5
Tangent
Only those channels whose positions have been measured can be selected. The
combined speed of input 1 and input 2 is displayed.
N axis tangent speed display
Only those channels whose positions have been measured can be selected. The
6
Tangent N
combined speed for the position data from the channel specified by input 1 to the
channel specified by input 2 is displayed.
All channels to be combined need to have position data.
Feed smoothness display
Only those channels whose positions have been measured can be selected. This
7
Smooth
item displays the deviation from the ideal position calculated on the assumption
that the tool moves from the displayed start time (start point) to the end time (end
point) at a constant speed.
Synchronization error display
Only those channels whose positions have been measured can be selected. This
8
Synchro
item displays the difference between input 1 and input 2. Currently, only 1-to-1 ratio
is supported as the proportion of input 1 to input 2.
Bit display
9
Bit
The status of the corresponding bit specified by input 2 is displayed, based on the
measurement data for the channel specified by input 1.
Table 1.9.1.1 (g) Y-time graph conditions
Coordinate
Operation
Input 1
Input 2
Remarks
conversion
Channel whose position has
1 : Normal
Not specified
been measured
Channel whose position has
Channel whose position has
been measured
2 : Y-Time
2 : Polar
been measured
(only when the data unit is mm,
(only when the data unit is deg)
μm, or inch)
Channel whose position has
Channel whose position has
3 : Angular
been measured
been measured
Channel whose position has
3 : Diff1 ( VT )
1 : Normal
Not specified
been measured
Channel whose position has
4 : Diff2 ( AT )
1 : Normal
Not specified
been measured
Channel whose position has
Channel whose position has
1 : Normal
been measured
been measured
Channel whose position has
Channel whose position has
been measured
5 : Tangent
2 : Polar
been measured
(only when the data unit is mm,
(only when the data unit is deg)
μm, or inch)
Channel whose position has
Channel whose position has
3 : Angular
been measured
been measured
Make sure that
the measured
Channel whose position has
Channel whose position has
6 : Tangent N
1 : Normal
data unit is
been measured
been measured
either mm, μm,
or inch, or deg.
Channel whose position has
7 : Smooth
1 : Normal
Not specified
been measured
Channel whose position has
Channel whose position has
8 : Synchro
1 : Normal
been measured
been measured
Channel whose position has
9 : Bit
1 : Normal
Bit position
been measured
- 91 -
1.DISPLAY AND OPERATION
B-64485EN/01
•
Input 1
Specifiable values are sequential, with channel 1 being 1. The maximum value is the largest channel
number for which measurement is set during the channel setting process. A value that does not meet
the graph display conditions defined in Table 1.9.1.1 (g), Y-time graph conditions cannot be
specified in input 1.
•
Input 2
Specifiable values are sequential, with channel 1 being 1. The maximum value is the largest channel
number for which measurement is set during the channel setting process. Note that, when Bit is
specified as the operation, values are sequentially set, with bit position 0 being 10. In this case, the
maximum value is 25, which indicates bit position 15. A value that does not meet the graph display
conditions defined in Table 1.9.1.1 (g), Y-time graph conditions cannot be specified in input 2.
•
Display unit
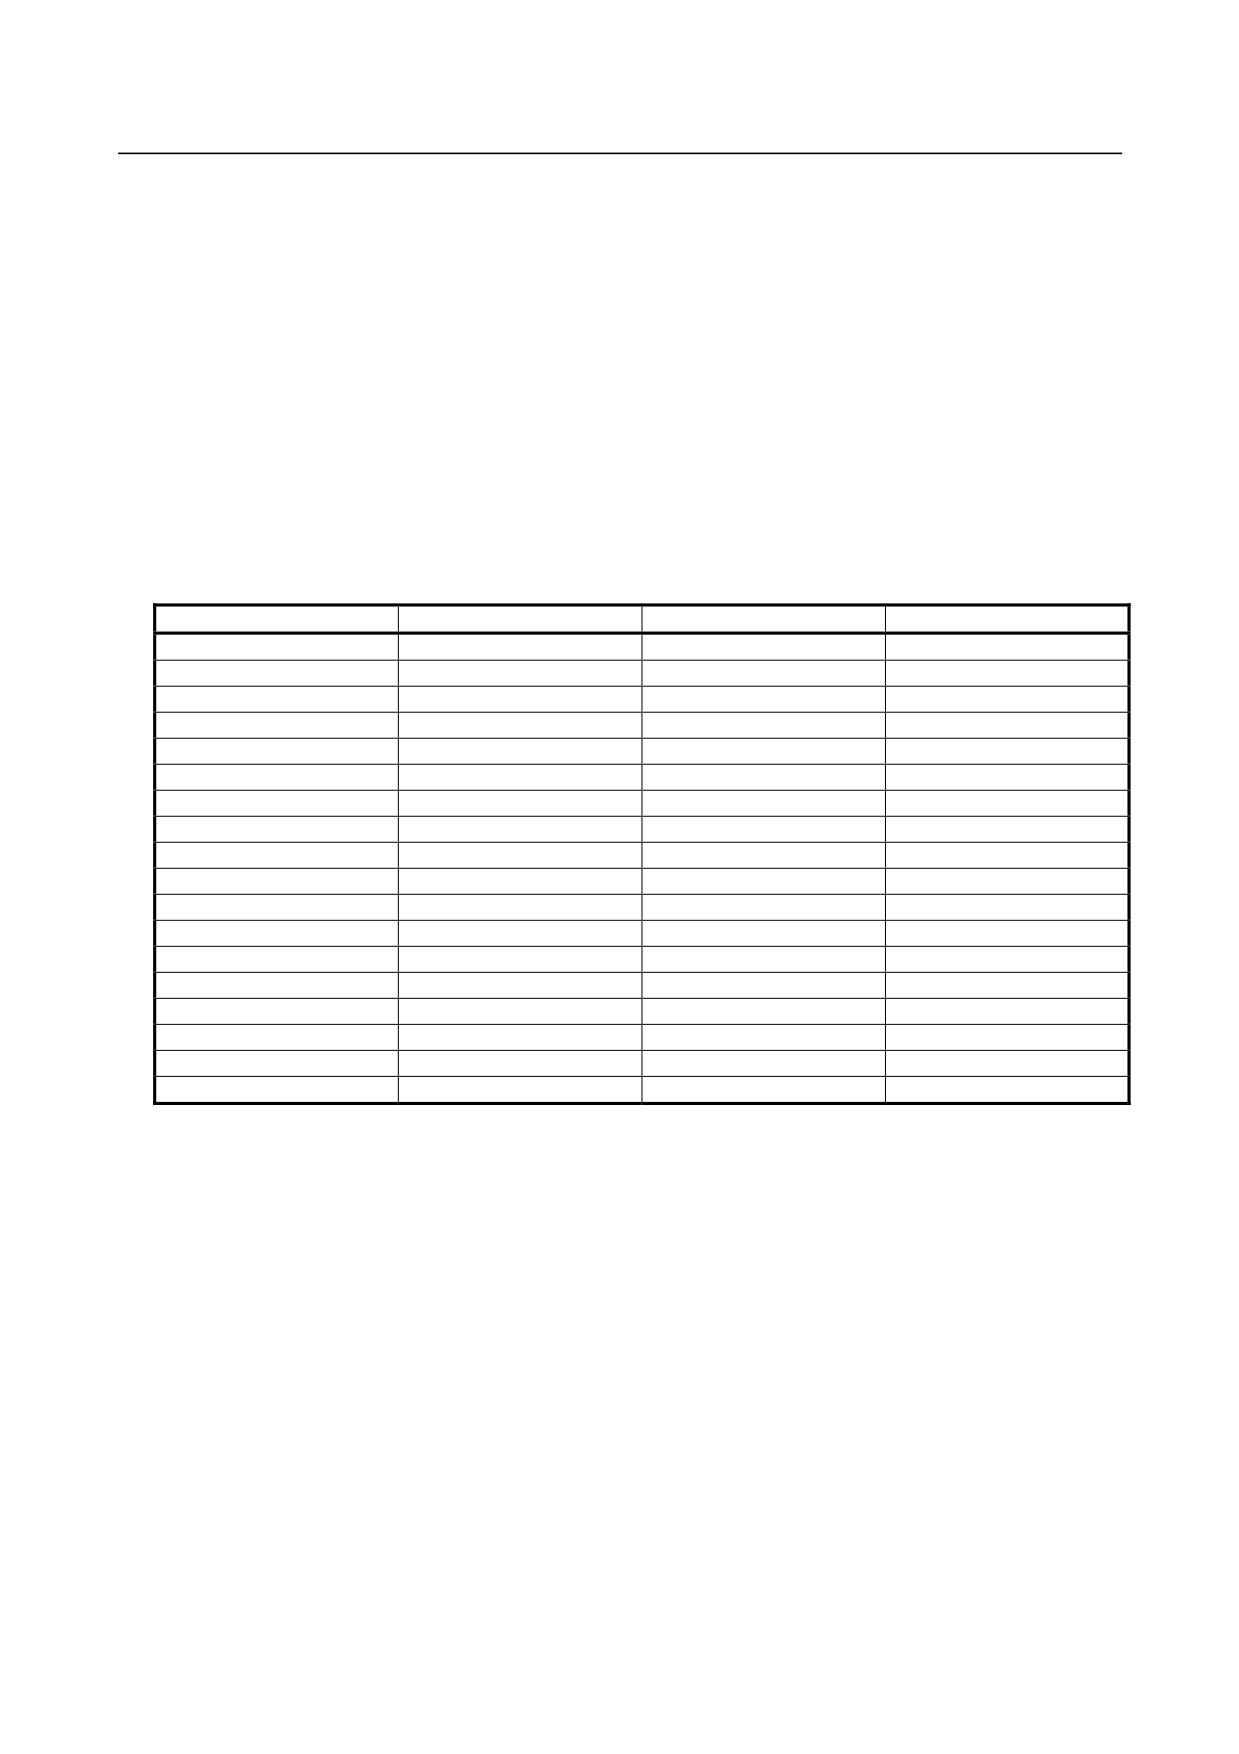
Specifiable values are as shown in Table 1.9.1.1 (h), Display units. The conditions for specifying
these display units are as shown in Table 1.9.1.1 (i), Y-time graph display units.
Table 1.9.1.1 (h) Display units
Input value
Unit
Input value
Unit
1
sec
19
1/sec
2
msec
20
1/min
3
μsec
21
mm/sec/sec
4
mm
22
mm/min/min
5
m
23
m/sec/sec
6
μm
24
m/min/min
7
nm
25
inch/sec/sec
8
inch
26
inch/min/min
9
deg
27
deg/sec/sec
10
mdeg
28
deg/min/min
11
mm/sec
29
1/sec/sec
12
mm/min
30
1/min/min
13
m/sec
31
A(p)
14
m/min
32
Hz
15
inch/sec
33
%
16
inch/min
34
pulse
17
deg/sec
35
bit
18
deg/min
36
--
- 92 -
B-64485EN/01
1.DISPLAY AND OPERATION
Table 1.9.1.1 (i) Corresponding Y-time graph display units
Operation
Input 1 measurement data unit
Specifiable display unit
4 : mm
4 : mm
5 : m
5 : m
6 : μm
6 : μm
7 : nm
7 : nm
8 : inch
8 : inch
9 : deg
9 : deg
11 : mm/sec
12 : mm/min
13 : m/sec
14 : m/min
14 : m/min
15 : inch/sec
2 : Y-Time
16 : inch/min
17 : deg/sec
18 : deg/min
20 : 1/min
19 : 1/sec
20 : 1/min
31 : A(p)
31 : A(p)
32 : Hz
32 : Hz
33 : %
33 : %
34 : pulse
34 : pulse
35 : bit
35 : bit
36 : --
36 : --
11 : mm/sec
4 : mm
12 : mm/min
5 : m
13 : m/sec
6 : μm
14 : m/min
7 : nm
15 : inch/sec
3 : Diff1 ( VT )
8 : inch
16 : inch/min
17 : deg/sec
18 : deg/min
9 : deg
19 : 1/sec
20 : 1/min
21 : mm/sec/sec
4 : mm
22 : mm/min/min
5 : m
23 : m/sec/sec
6 : μm
24 : m/min/min
7 : nm
25 : inch/sec/sec
4 : Diff2 ( AT )
8 : inch
26 : inch/min/min
27 : deg/sec/sec
28 : deg/min/min
9 : deg
29 : 1/sec/sec
30 : 1/min/min
4 : mm
11 : mm/sec
5 : m
12 : mm/min
6 : μm
13 : m/sec
5 : Tangent
7 : nm
14 : m/min
8 : inch
15 : inch/sec
9 : deg
16 : inch/min
4 : mm
11 : mm/sec
5 : m
12 : mm/min
6 : μm
13 : m/sec
6 : Tangent N
7 : nm
14 : m/min
8 : inch
15 : inch/sec
9 : deg
16 : inch/min
- 93 -
1.DISPLAY AND OPERATION
B-64485EN/01
Operation
Input 1 measurement data unit
Specifiable display unit
4 : mm
4 : mm
5 : m
5 : m
6 : μm
6 : μm
7 : Smooth
7 : nm
7 : nm
8 : inch
8 : inch
9 : deg
9 : deg
4 : mm
5 : m
6 : μm
8 : Synchro
Not affected by the measurement unit.
7 : nm
8 : inch
9 : deg
36 : --
9 : Bit
Not affected by the measurement unit.
Not specified.
• Coordinate conversion
Specifiable values are 1 (Normal; no coordinate conversion), 2 (Polar; coordinate conversion for
polar coordinate interpolation), and 3 (Angular; coordinate conversion for angular axis control). The
conditions for the specifiable coordinate conversion types are as shown in Table
1.9.1.1
(j),
Corresponding Y-time graph coordinate conversion types. Note that no conditions are imposed for
specifying Normal (no coordinate conversion).
Table 1.9.1.1 (j) Corresponding Y-time graph coordinate conversion types
Specifiable coordinate
Operation
Input 1
Input 2
conversion
Channel whose position has been
Channel whose position has been
measured
measured
2 : Polar
2 : Y-Time
(only when the data unit is mm, μm,
(only when the data unit is deg)
5 : Tangent
or inch)
Channel whose position has been
Channel whose position has been
3 : Angular
measured
measured
• Inclination
Specify the inclination in degrees. The specified value is effective only when Angular (coordinate
conversion for angular axis control) is specified as the coordinate conversion type.
-
Setting the scale screen
The scale screen lets you set up to four scales per draw and specify the graph scale with respect to the
time axis.
• Start point
Set the center coordinate of the displayed data (Draw 1 to Draw 4; vertical axis).
Set the display start time for time (horizontal axis).
• Division
Set the value of the displayed data per grid (Draw 1 to Draw 4; vertical axis).
Set the amount of time per grid for time (horizontal axis).
-
Operation for measurement
• Origin
Arrange that the origin value, set on a per-channel basis in the channel setting screen, will be the
initial value for the measurement data when measurement is started. This operation is effective only
for those channels for which position measurement is set.
- 94 -
B-64485EN/01
1.DISPLAY AND OPERATION
Limitation
-
Data update cycle
Position-related data is updated at intervals of 1 ms, and power-related data is updated at the current cycle.
Therefore, even if you specify a sampling cycle that is shorter than the data update cycle, the displayed
data remains unchanged during the present data update cycle.
-
Sampling cycle and the number of channels measured
Regarding the sampling cycle and the number of channels measured, there are limitations as shown in
Table 1.9.1.1 (k).
Table 1.9.1.1 (k) Sampling cycle and the number of channels measured
Sampling cycle
Maximum number of channels measured
1ms or more
4
500μs
4
250μs
4
125μs
4
2
62.5μs
(Channel 3 or later cannot be input.)
The following limitations are imposed on the servo axis and spindle axis.
Number of channels that can be acquired per servo DSP
• Up to four channels can be acquired when the sampling cycle is 1 ms or longer, 500 μs, or 250 μs.
• Up to two channels can be acquired when the sampling cycle is 125 μs.
• Only one channel can be acquired when the sampling cycle is 62.25 μs.
Number of channels that can be acquired per spindle axis
• Up to two channels can be acquired when the sampling cycle is1 ms or longer.
• Only one channel can be acquired when the sampling cycle is 500 ms.
1.9.1.2 XY graph
This graph provides a 2-dimensional path display of measurement data by using 2-axis data.
Up to two draws can be displayed at a time.
Displaying and setting the XY graph
Procedure
The procedure for displaying the measurement data is described below.
1
Press the
function key.
2
Press the continuous menu key
several times until [SERVO GUIDE MATE] is displayed.
3
Click the soft key [SERVO GUIDE MATE].
4
Click the soft key [XY].
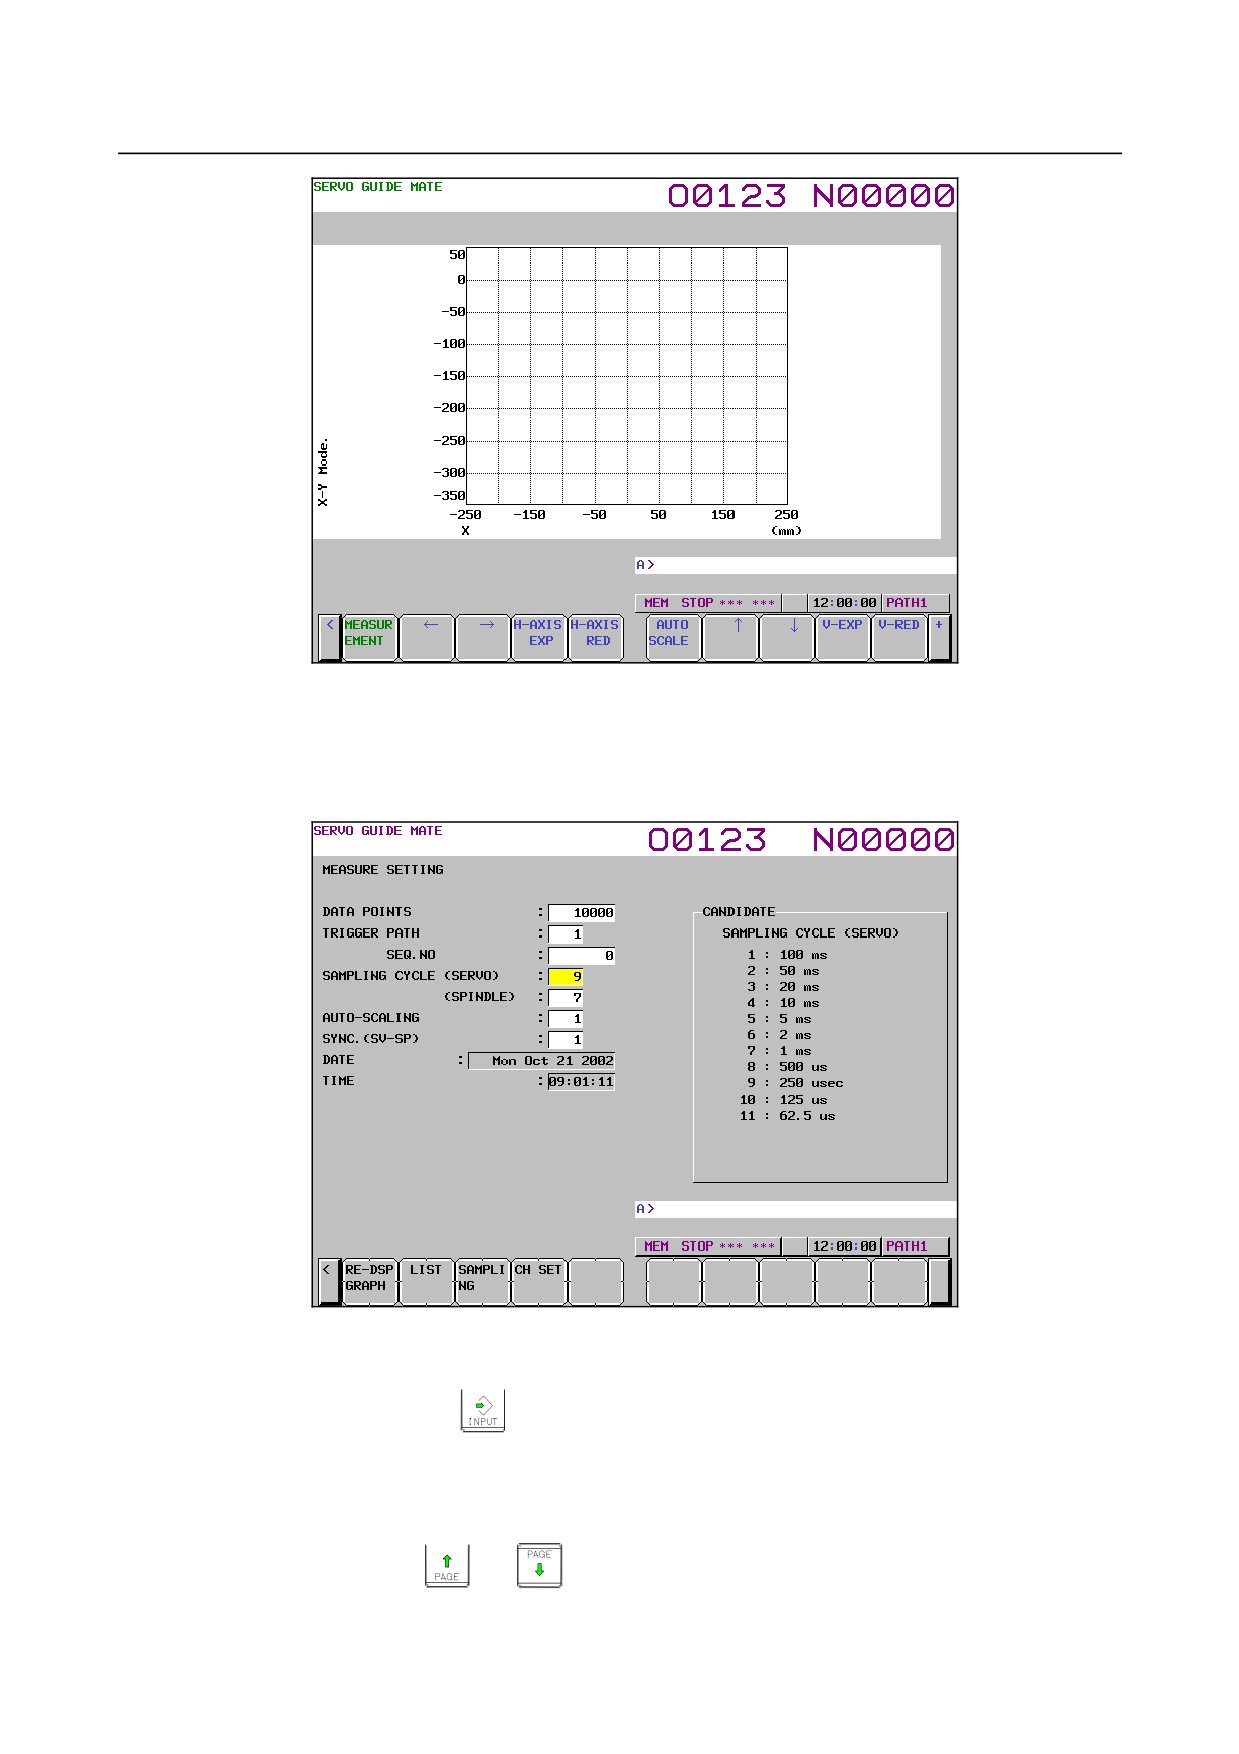
The wave display screen is displayed as shown Fig. 1.9.1.2 (a).
- 95 -
1.DISPLAY AND OPERATION
B-64485EN/01
Fig. 1.9.1.2 (a)
5
Click the soft key [MEASUREMENT].
6
Click the soft key [DATA IN].
7
Click the soft key [SAMPLING].
The data-in screen is displayed as shown Fig. 1.9.1.2 (b).
Fig. 1.9.1.2 (b)
8
Move the cursor to the parameter you want to set, by pressing the cursor key.
9
Enter data and the press the
key.
10 Repeat steps 8 and 9 until you set all the parameters.
11 Click the soft key [SET CHANNEL].
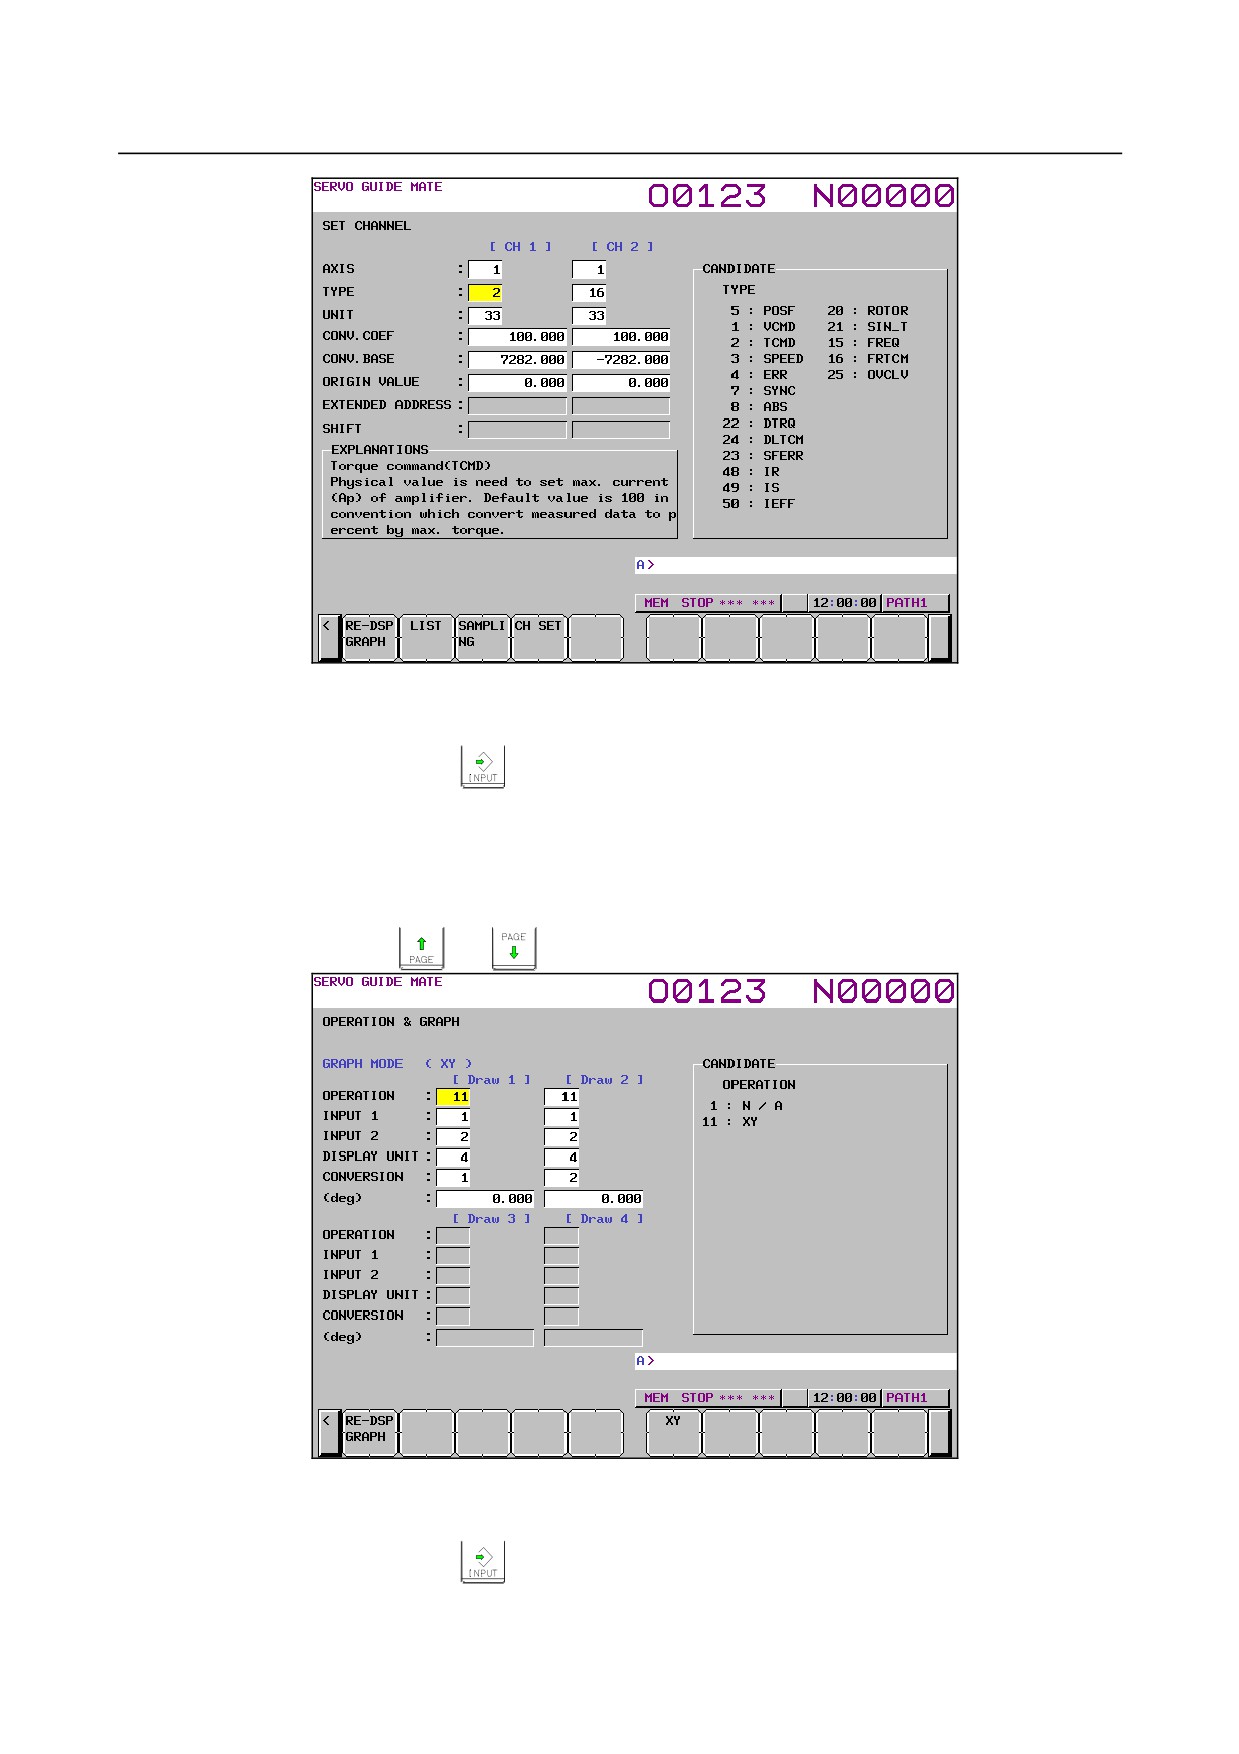
The channel setting screen is displayed as shown Fig. 1.9.1.2 (c).
To set any channel other than the one currently displayed, display the setting screen for the desired
channel by pressing the
or
key.
- 96 -
B-64485EN/01
1.DISPLAY AND OPERATION
Fig. 1.9.1.2 (c)
12 Move the cursor to the parameter you want to set, by pressing the cursor key.
13 Enter data and the press the
key.
14 Repeat steps 12 and 13 until you set all the parameters.
15 Click the soft key [RE-DSPGRAPH].
16 Click the soft key [OPERATION & GRAPH].
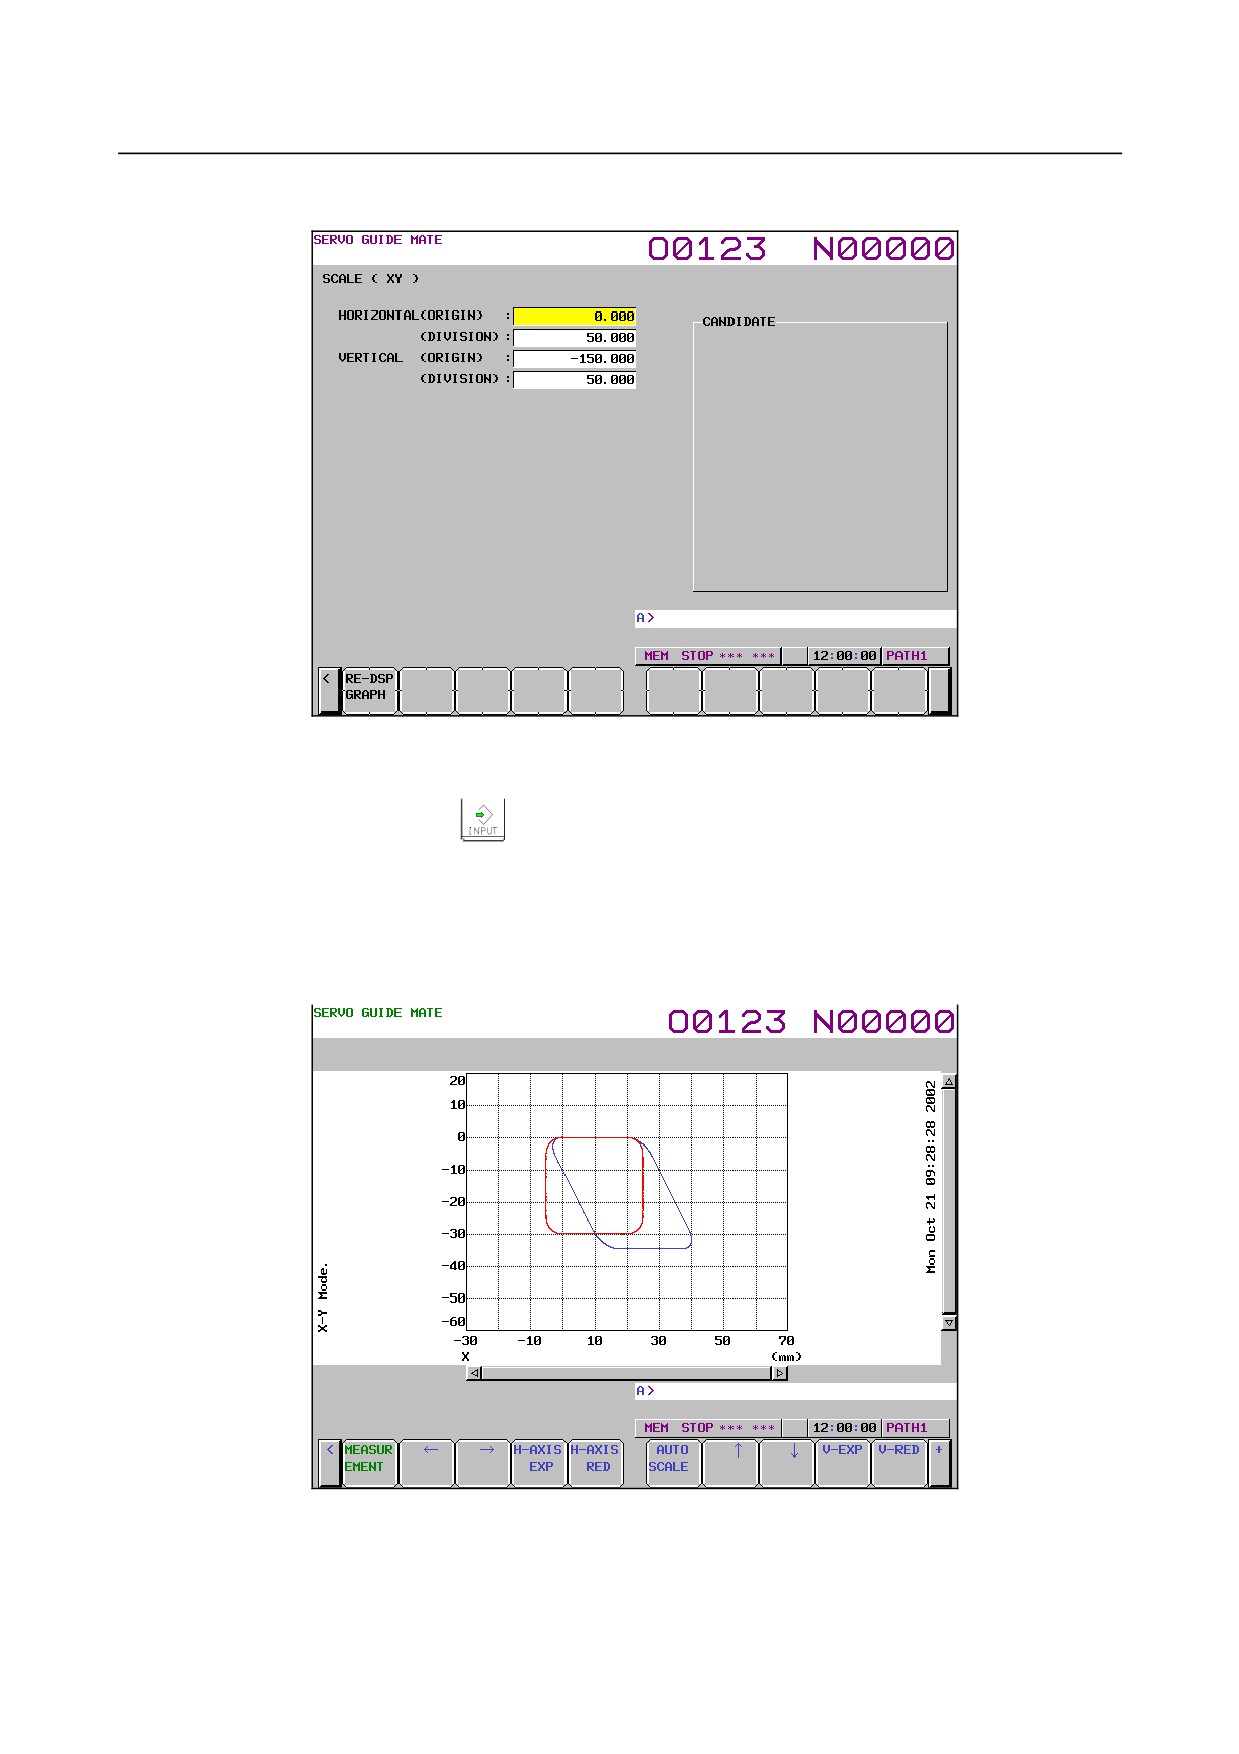
The operation and graph setting screen is displayed as shown Fig. 1.9.1.2 (d).
To set any draw other than the one currently displayed, display the setting screen for the desired
draw by pressing the
or
key.
Fig. 1.9.1.2 (d)
17 Move the cursor to the parameter you want to set, by pressing the cursor key.
18 Enter data and the press the
key.
19 Repeat steps 17 and 18 until you set all the parameters.
20 Click the soft key [RE-DSPGRAPH].
- 97 -
1.DISPLAY AND OPERATION
B-64485EN/01
21 Click the soft key [SCALE SET].
The scale setting screen is displayed as shown Fig. 1.9.1.2 (e).
Fig. 1.9.1.2 (e)
22 Move the cursor to the parameter you want to set, by pressing the cursor key.
23 Enter data and the press the
key.
24 Repeat steps 22 and 23 until you set all the parameters.
25 Click the soft key [RE-DSPGRAPH].
26 Click the soft key [MEASUREMENT].
27 Click the soft key [START].
28 Start the automatic or manual operation.
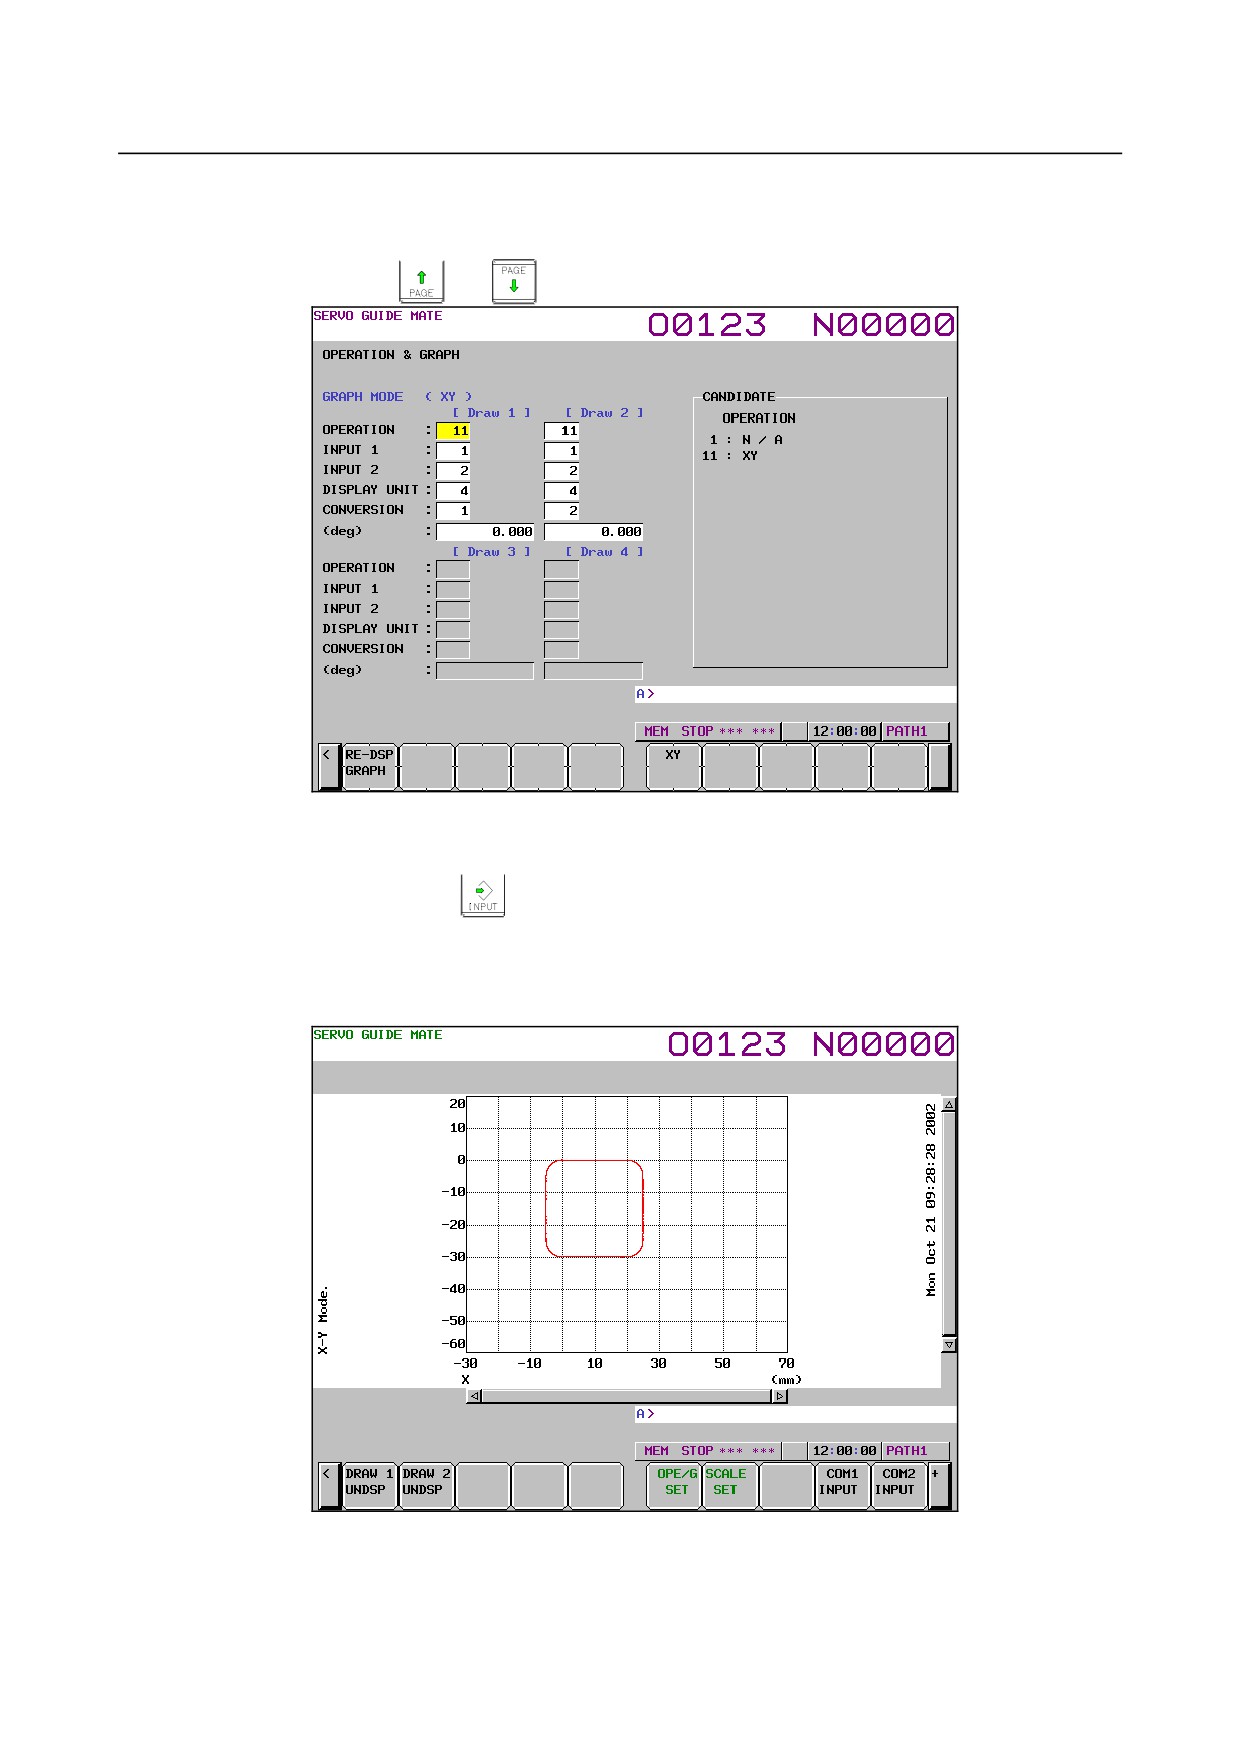
29 When the measurement is completed, the wave display screen is displayed as shown Fig. 1.9.1.2 (f).
Fig. 1.9.1.2 (f)
-
Changing the operation and graph setting screen
The procedure for changing the operation and graph setting screen as necessary is described below.
- 98 -
B-64485EN/01
1.DISPLAY AND OPERATION
1
Click the soft key [OPERATION & GRAPH].
The operation and graph setting screen is displayed as shown Fig. 1.9.1.2 (g).
To set any draw other than the one currently displayed, display the setting screen for the desired
draw by pressing the
or
key.
Fig. 1.9.1.2 (g)
2
Move the cursor to the parameter you want to set, by pressing the cursor key.
3
Enter data and the press the
key.
4
Repeat steps 2 and 3 until you set all the parameters.
5
Click the soft key [RE-DSPGRAPH].
Based on the new operation and graph settings, the wave display screen is displayed as shown Fig.
1.9.1.2 (h).
Fig. 1.9.1.2 (h)
-
Changing the scale screen
The procedure for changing the scale settings as necessary is described below.
- 99 -
1.DISPLAY AND OPERATION
B-64485EN/01
1
Click the soft key [SCALE SET].
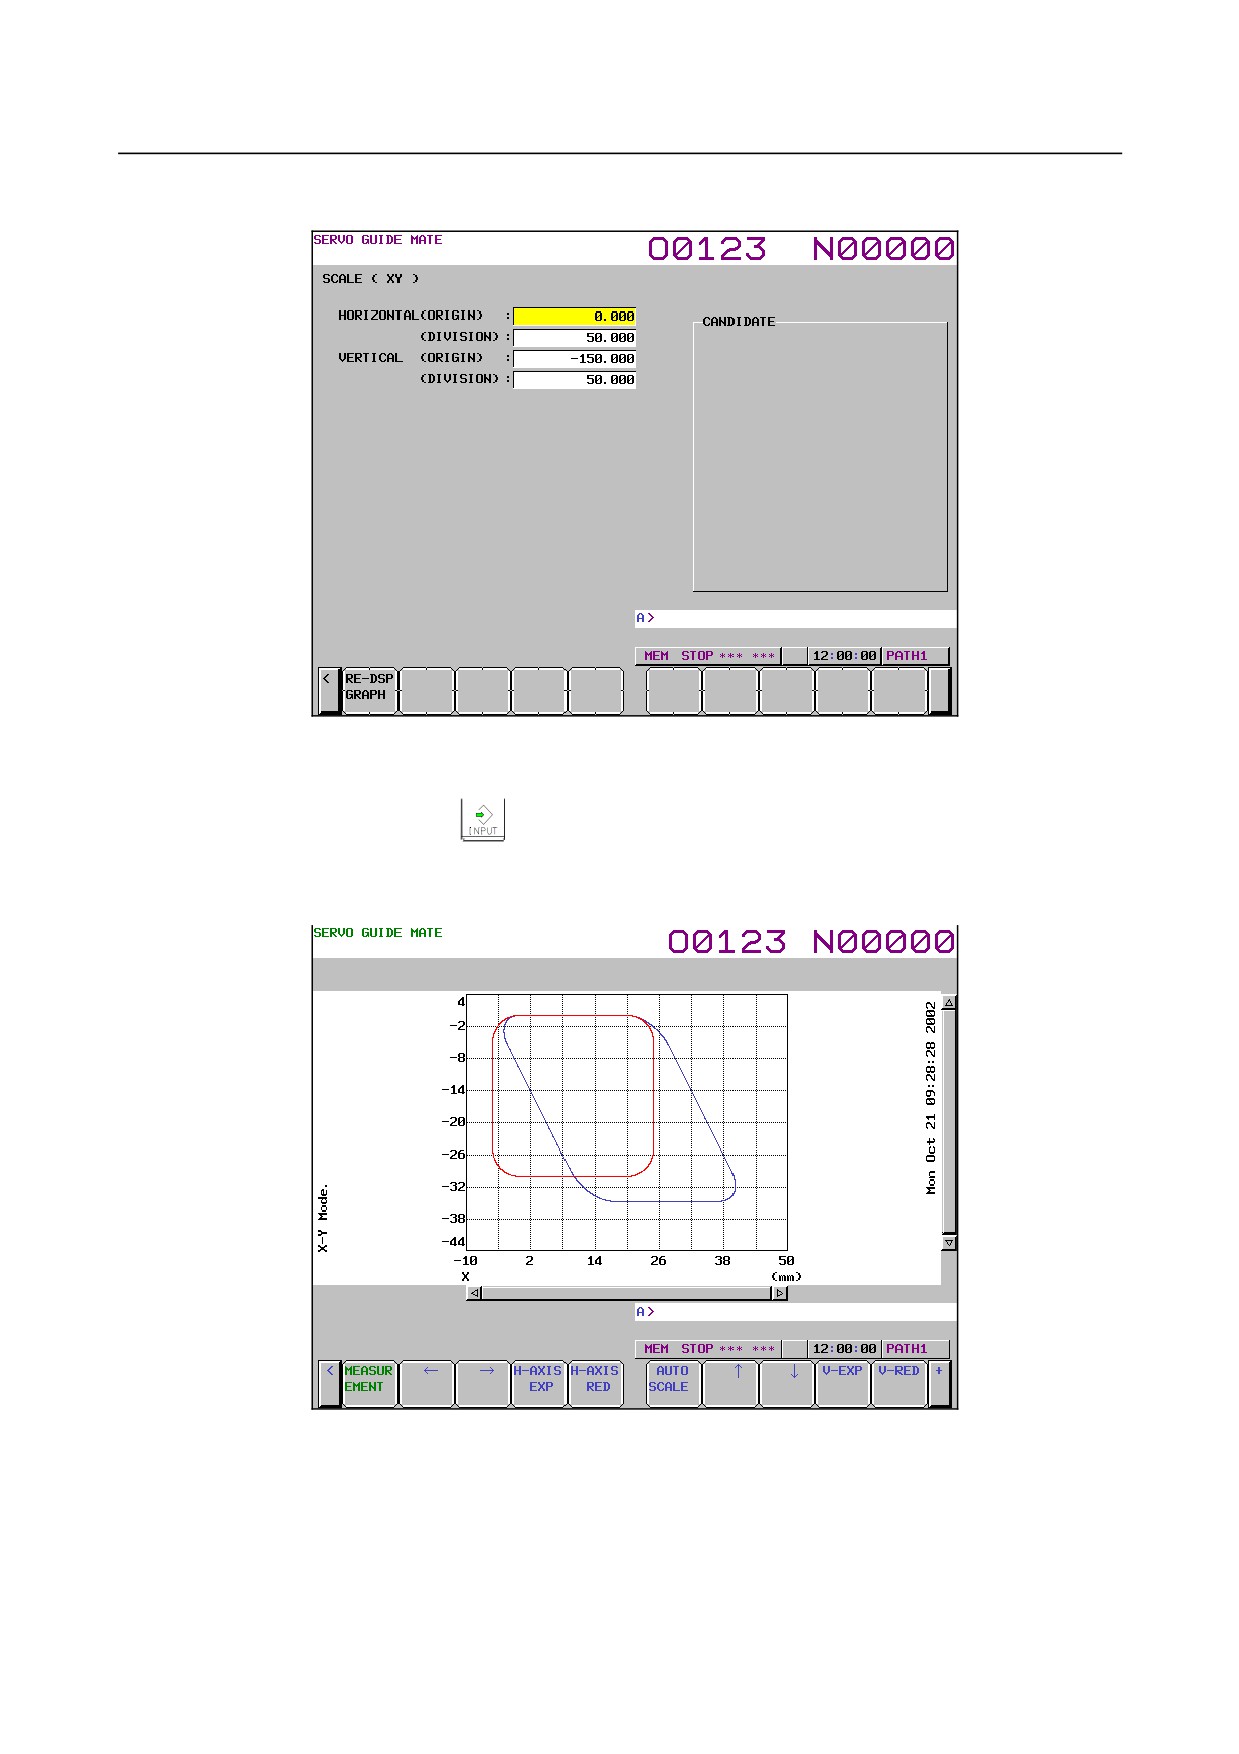
The scale setting screen is displayed as shown Fig. 1.9.1.2 (i).
Fig. 1.9.1.2 (i)
2
Move the cursor to the parameter you want to set, by pressing the cursor key.
3
Enter data and the press the
key.
4
Repeat steps 2 and 3 until you set all the parameters.
5
Click the soft key [RE-DSPGRAPH].
Based on the new scale settings, the wave display screen is displayed as shown Fig. 1.9.1.2 (j).
Fig. 1.9.1.2 (j)
-
Manipulating the XY graph
By clicking the following soft keys, you can perform the operations corresponding to them.
[MEASUREMENT] : Performs a measurement-related operation.
[←]
: Shifts the horizontal axis to the right.
[→]
: Shifts the horizontal axis to the left.
[H-AXIS EXP]
: Expands the horizontal axis.
- 100 -
B-64485EN/01
1.DISPLAY AND OPERATION
[H-AXIS RED]
: Reduces the horizontal axis.
[AUTO SCALE]
: Enables auto scaling.
[↑]
: Shifts the vertical axis downward.
[↓]
: Shifts the vertical axis upward.
[V-AXIS EXP]
: Expands the vertical axis.
[V-AXIS RED]
: Reduces the vertical axis.
[DRAW 1UNDSP]
: Sets whether or not to display Draw 1.
[DRAW 2UNDSP]
: Sets whether or not to display Draw 2.
[OPE/G SET]
: Sets operations and graphs.
[SCALE SET]
: Sets scales.
[COM1 INPUT]
: Inputs comment 1.
[COM2 INPUT]
: Inputs comment 2.
[Y-TIME]
: Switches to the Y-Time graph.
[CIRCLE]
: Switches to the Circle graph.
[FOURIER]
: Switches to the Fourier graph.
[BODE]
: Switches to the Bode graph.
-
Performing measurement
When you click the soft key [MEASUREMENT], you can perform the operations corresponding to the
menu items that follow.
[START]
: Starts measurement.
[ORIGIN]
: Sets the origin value.
[STOP]
: Stops measurement.
[DATA IN]
: Specifies measurement-related settings.
-
Changing measurement settings
1
When you click the soft key [MEASUREMENT] and then the soft key [DATA IN], you can perform
the operations corresponding to the menu items that follow.
2
Click the soft key [LIST].
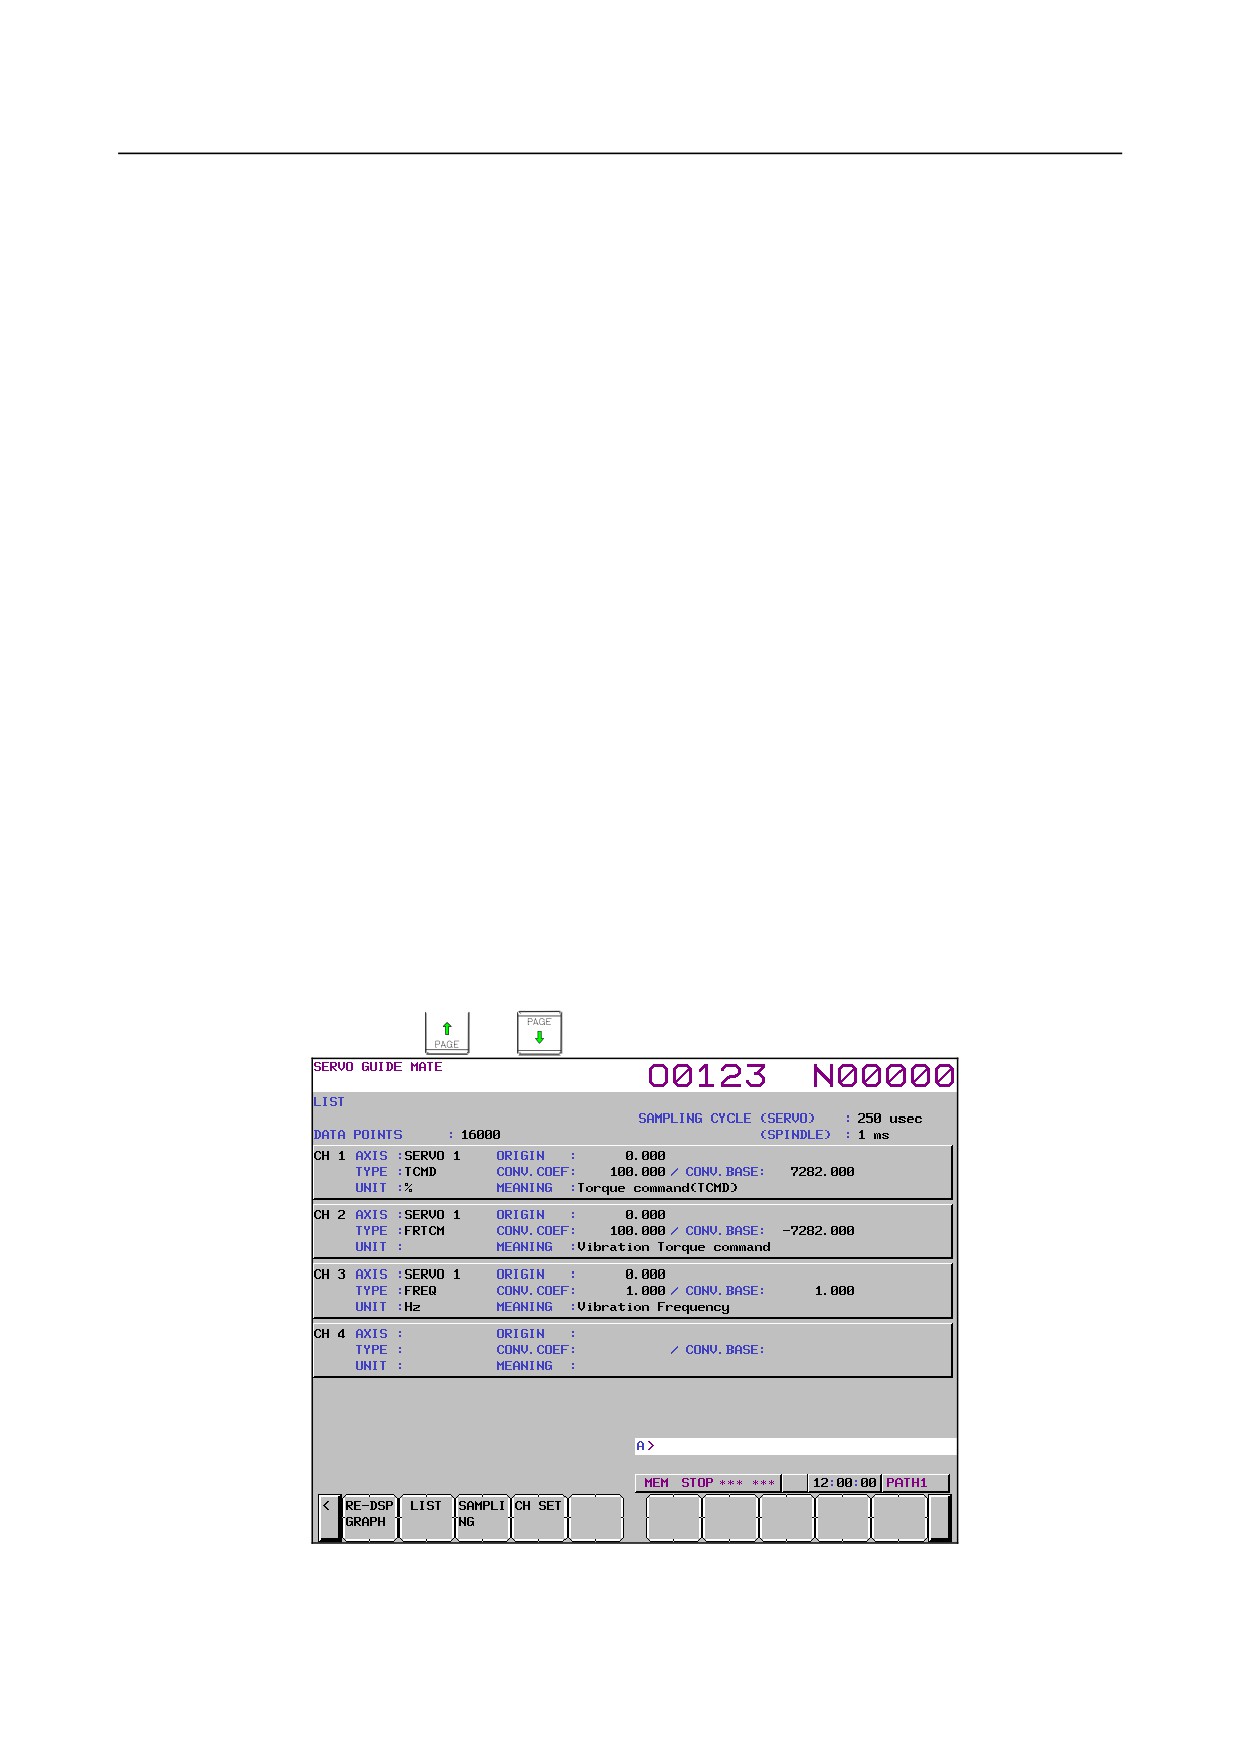
The list screen is displayed as shown Fig. 1.9.1.2 (k).
To display any channel other than the one currently displayed, display the list screen for the desired
channel by pressing the
or
key.
Fig. 1.9.1.2 (k)
3
Check the current settings on the list screen.
- 101 -