Network Management System Industrial HiVision 8.2. User Manual (2021) - page 14

References
8.9 MAC/IP List
Configuration > MAC/IP List
8.9
MAC/IP List
8.9.1
MAC/IP Addresses
This dialog displays a list of the IP addresses detected by Industrial HiVision
and their related MAC addresses. The list contains:
Designation
Meaning
MAC Address
IP Address
Netmask
Host Name
Host name from the /config/hosts.txt file in the installation directory if:
- the file exists
- there is an entry
- the determination of a device name is activated in the basic settings
Otherwise, the field remains empty.
DNS Name
Name from the Domain Name Service
Port No
Port number of the protocol.
Port
Device port
Management
Industrial HiVision communicates with the management of the device by
means of the IP address in this row.
User Generated The device in this row was generated by the user. Industrial HiVision has
not detected this device yet.
Router Entry
The IP address in this row comes from the routing table of the device.
With the “Export“ you can save the complete list as:
PDF file
HTML file
CSV file (see on page 457 “CSV export”)
411
References
8.9 MAC/IP List
With the “Print“ button you can print the complete list. Industrial HiVision
creates a temporary PDF file of the content of the list and opens this PDF file
in the PDF display program for example, Acrobat Reader, that is installed on
your management station.
8.9.2
MAC/IP Address Pair Security
This dialog lets you monitor the assignment of MAC addresses to IP
addresses and allows you to detect IP address duplicates.
Industrial HiVision is familiar with the following types of table entries.
“Existent“
This entry comes from an existing and discovered device in the network.
If you remove this device from the topology, then Industrial HiVision
removes this device from the list.
Industrial HiVision includes this entry in the event examination.
“User Generated“
A user created or edited this entry at this point. This entry stays in the list
until the user manually deletes it from the list.
Industrial HiVision includes this entry in the event examination.
“Excluded“
A user created or edited this entry at this point. This entry stays in the list
until the users manually deletes it from the list.
Industrial HiVision excludes this entry from the event examination.
The “Display“ pull down list allows you to filter the table contents according
to type.
To enable monitoring, mark the “Configure Schedule for Checking“
checkbox.
As soon as you leave the dialog using the button, Industrial HiVision
opens the “Scheduler“ dialog. This is where you specify the monitoring
criteria.
See “Scheduler” on page 312.
412
References
8.10 Refresh
8.10 Refresh
The “Refresh“ dialog enables you to have Industrial HiVision read values
from properties of a previously selected device, folder or property itself. After
Industrial HiVision has read in the values, Industrial HiVision refreshes the
display.
In edit mode, when you update a device, or folder within a device,
Industrial HiVision reads the existing properties within and below the
respective device or folder.
Thus, for example, you can make a module visible in Industrial HiVision
after adding the module to the hardware.
In Run mode, when a device or folder within a device is updated Industrial
HiVision reads in exclusively the existing properties within the respective
device or folder.
When updating a property, Industrial HiVision reads in the values of the
property.
413
References
8.11 IP Configuration
8.11 IP Configuration
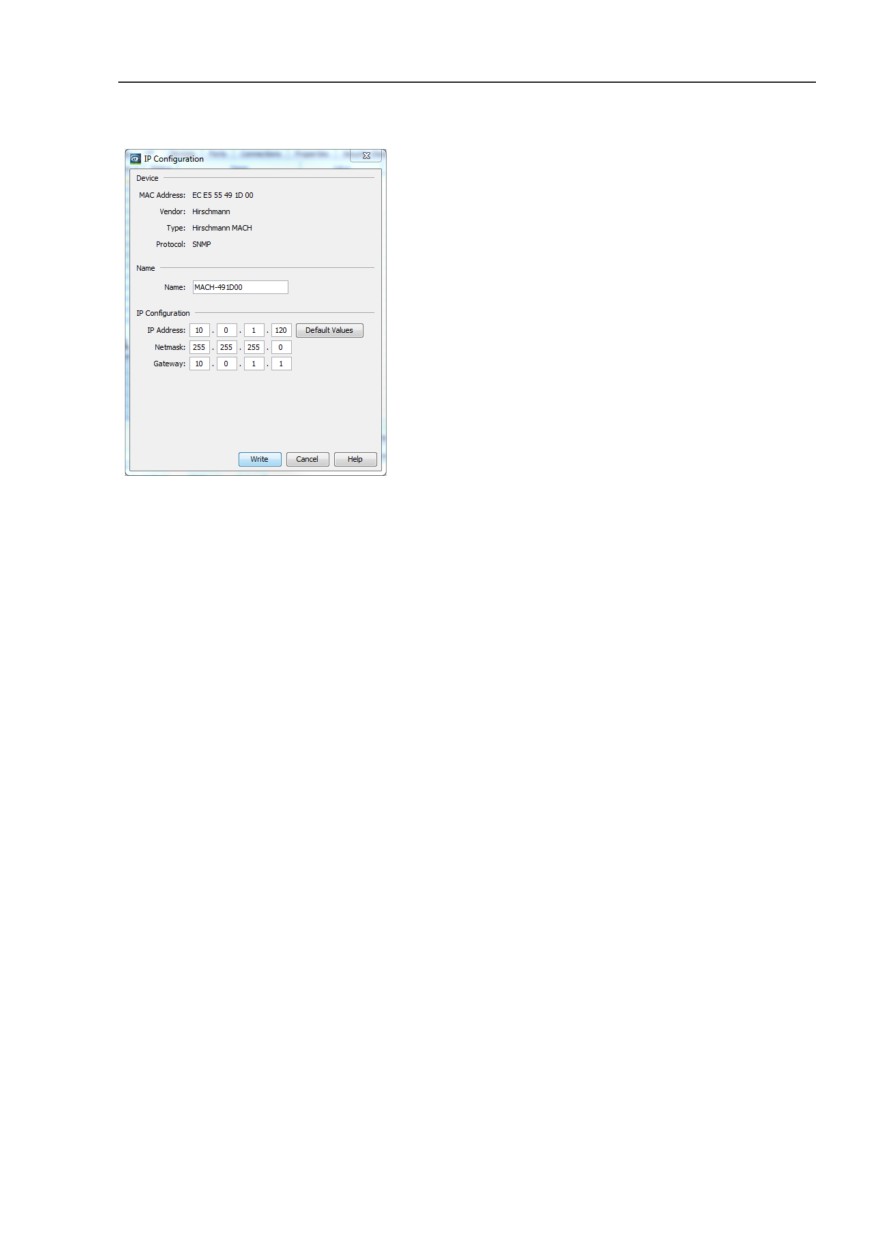
This dialog enables you to configure the IP parameters of a device detected
by HiDiscovery V1 without an IP address, or to change IP parameters already
configured.
You open the dialog for the IP configuration by right-clicking on the device
and selecting “IP Configuration“.
When you open the dialog, Industrial HiVision queries the device using the
HiDiscovery V1 protocol. If the query is successful, Industrial HiVision
displays the parameters of the device and the “Signal“ button. If the device
does not respond to the HiDiscovery V1 query, then Industrial HiVision
queries the device using SNMP. If the SNMP query is successful, Industrial
HiVision displays the parameters of the device.
You click the “Signal“ button to activate the flashing LEDs on the device
for the identification of the device. Click the “Signal“ button again to
deactivate the flashing.
Prerequisites for this function:
- The device has HiDiscovery V1 activated
- You have chosen the network interface card for this network in the
Configuration > Preferences > Advanced > Management Station
dialog under “Default Network Card“ (HiDiscovery V1).
You can enter a name for the device, in the “Name“ field.
You can assign a new IP address to the device, in the “IP address” field.
You can assign a new network mask to the device, in the “Network Mask”
field.
You can assign a new gateway IP address to the device, in the “Gateway”
field.
If you click once on the “Default Values“ button, then Industrial HiVision
enters the default values from “Management Station” on page 384 in the
IP configuration fields.
If you click the “OK“ button, then Industrial HiVision transfers the name and
the IP configuration to the device.
To close the dialog and keep the original entries, click the “Cancel“ button.
414
References
8.11 IP Configuration
Figure 104:IP configuration of a device
415
References
Configuration > MAC/IP List
8.12 Trap Destination
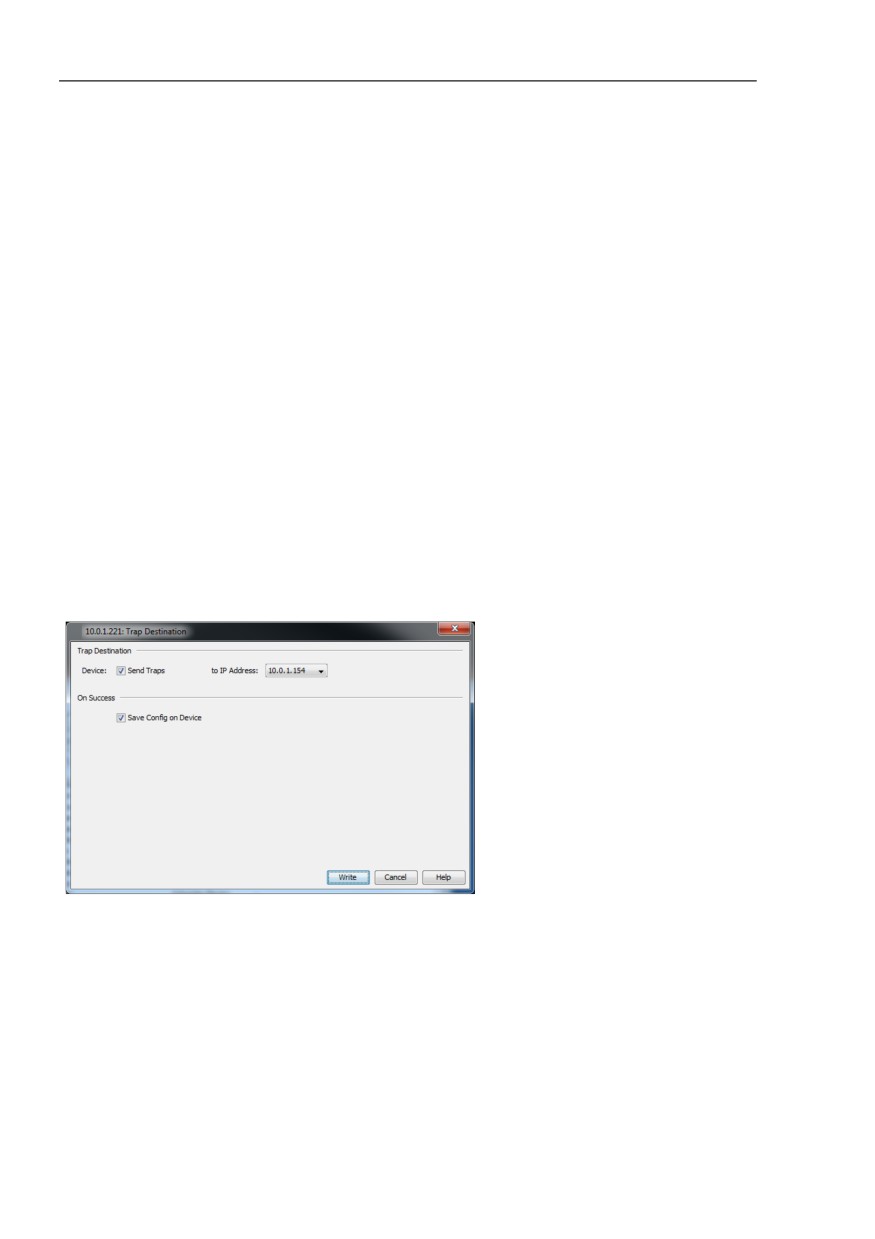
To open the dialog for the trap destination, you right-click on the device and
select “Trap Destination“.
When the dialog is opened, Industrial HiVision queries the trap settings of the
device and displays whether the device sends traps to the IP address
displayed.
If you want the device to send traps when defined events occur, then mark
the “Send Traps“ checkbox.
You select the IP address of your network management station, on which
you are operating Industrial HiVision, in the “to IP Address“ pull-down list.
If you want this trap configuration to be saved in the permanent memory
on the device, mark the “Save Config on Device“ checkbox.
Figure 105:Trap destination of a device
Note: If your Windows firewall is activated and no Windows Trap Service is
installed, the firewall can block you from receiving traps. However, if you still
want to receive traps, you add the /services/
HiVisionKernelDb.exe.exe file in the Industrial HiVision installation
directory to the firewall settings as an executable file.
416
References
Configuration > MAC/IP List
The Windows Trap Service is installed if you find "SNMP Trap Connection:
Trap Service" under Help > Kernel Info in Industrial HiVision.
You can configure the Windows firewall under Start> Settings> Control
Panel> Windows Firewall on the Exceptions tab. Click “Program” to select
the/services/HiVisionKernelDb.exe file in the Industrial HiVision
installation directory.
417
References
Tools > Dashboard
Tools > Dashboard
8.13
Tools
In the “Tools“ menu you can find various tools allowing you to access devices
in your network using Ping, graphical user interface, CLI, SNMP browser or
the HiDiscovery V1 Scan.
8.13.1 Dashboard
The Industrial HiVision “Dashboard“ is a valuable fault-finding tool which
allows an administrator to view the network statistics and useful information
about the performance of the network in real time.
Industrial HiVision allows you to create multiple dashboards with various
information, then preview the dashboards as a slide show. The function also
allows you to save and load the dashboard layouts.
The main window contains a time slider. The time slider allows you to adjust
how long the slide show displays each page.
When you close the Industrial HiVision application, the application saves the
size and position of the dashboard. The application also saves other active
dashboard options such as the full screen mode, timer slider status, and the
play or pause status.
418
References
Tools > Dashboard
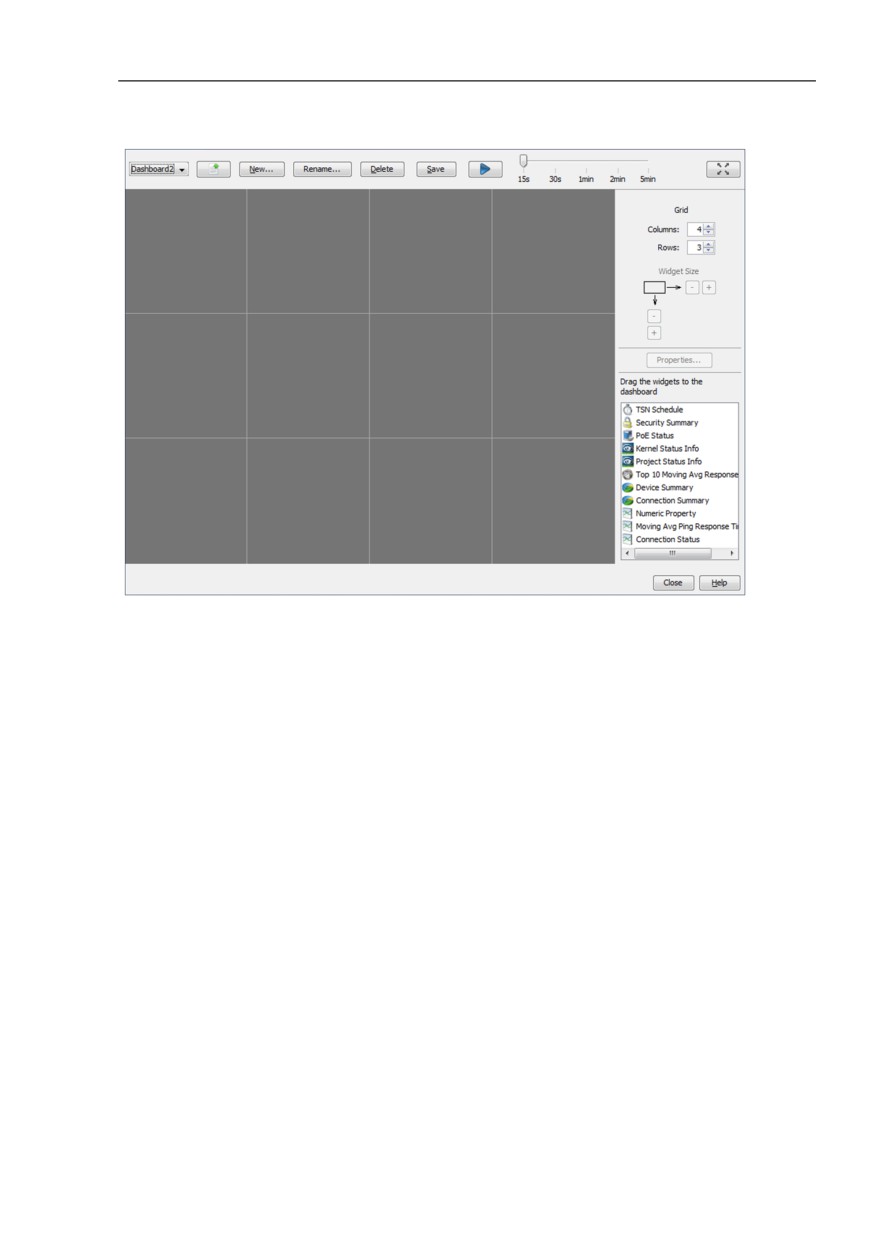
Figure 106:Industrial HiVision Dashboard
Note: If the dashboard does not display the “New“, “Delete“, and “Save“
buttons, then click the “Edit Mode“ button on the Industrial HiVision tool bar.
Widget Display and Configuration
Industrial HiVision allows you to customize the dashboards to suite your
requirements. Using the drag and drop function you can specify the type
and position of the widgets that a dashboard displays. You can also
specify the number of rows and columns of cells for each dashboard.
The background color of the widget represents the worst state displayed
in the widget. The background colors indicate the same statuses as in the
Graphical User Interface (GUI) of Industrial HiVision. The user can specify
the background colors (see “Status Colors” on page 364).
419

References
Tools > Dashboard
Widget Size
The dashboard allows you to increase or decrease the size of widgets.
To increase the size of a widget, verify that you have cells free on the right
or below the widget that you wish to enlarge. If there are no free cells
available, then add the required number of cells using the “Grid“ buttons.
Highlight the widget you wish to enlarge. Using the “Widget Size“ plus “+”
button increases the size of the widget. The size of the widget increases
one cell each time you click the plus “+” button.
Properties Button
Some widgets allow you to configure which parameters to monitor. To
specify which parameters the widget monitors click the “Properties“
button, then enter the values in the “Parameters“ dialog. The widgets also
allow you to drag parameters from various tabs in the GUI or the folder
frame and drop them into the widget.
The following widgets allow you to specify parameters to monitor:
“Connection Status“
“Moving Avg Ping Response Time“
“Numeric Property“
“Top 10 Moving Avg Response Time“ (no drag and drop)
Viewing Modes
Industrial HiVision allows you to view a slide show of the dashboard
pages using the following methods.
When you click the “Full Screen” button
, the dashboard changes
to the full screen mode and the slide show is in the “Pause” mode.
You can also open the slide show using the “Play” button . If you
open the slide show using the “Play” button, then the dashboard
changes to the full screen mode and the slide show begins to display
the pages of the current user.
420

References
Tools > Dashboard
In the “Full Screen” mode the dashboard also has a tool bar containing
the following control functions.
To stop the slide show at the current page, click the “Pause”
button
To restart the slide show, click the “Play” button
If you wish to open a specific page, then you can select the page from
the pull down list.
Note: To display the tool bar, move the mouse to the top of the screen.
To exit the full screen mode, click the “Restore” button
or press the
“Esc” button on the keyboard.
Renaming
The dashboard function allows you to change the name of existing pages.
To change the name of an existing page, use the following work steps:
Click the “Rename“ button.
Enter the new name in the “Dashboard Name“ field.
Click the “OK“ button.
Dashboard Order
When you have multiple dashboards Industrial HiVision allows you to
display the dashboards in any order. When you have multiple dashboards
or the selected dashboard is not at the top of the list, the move up button
is active. The move up button moves the selected dashboard one step up.
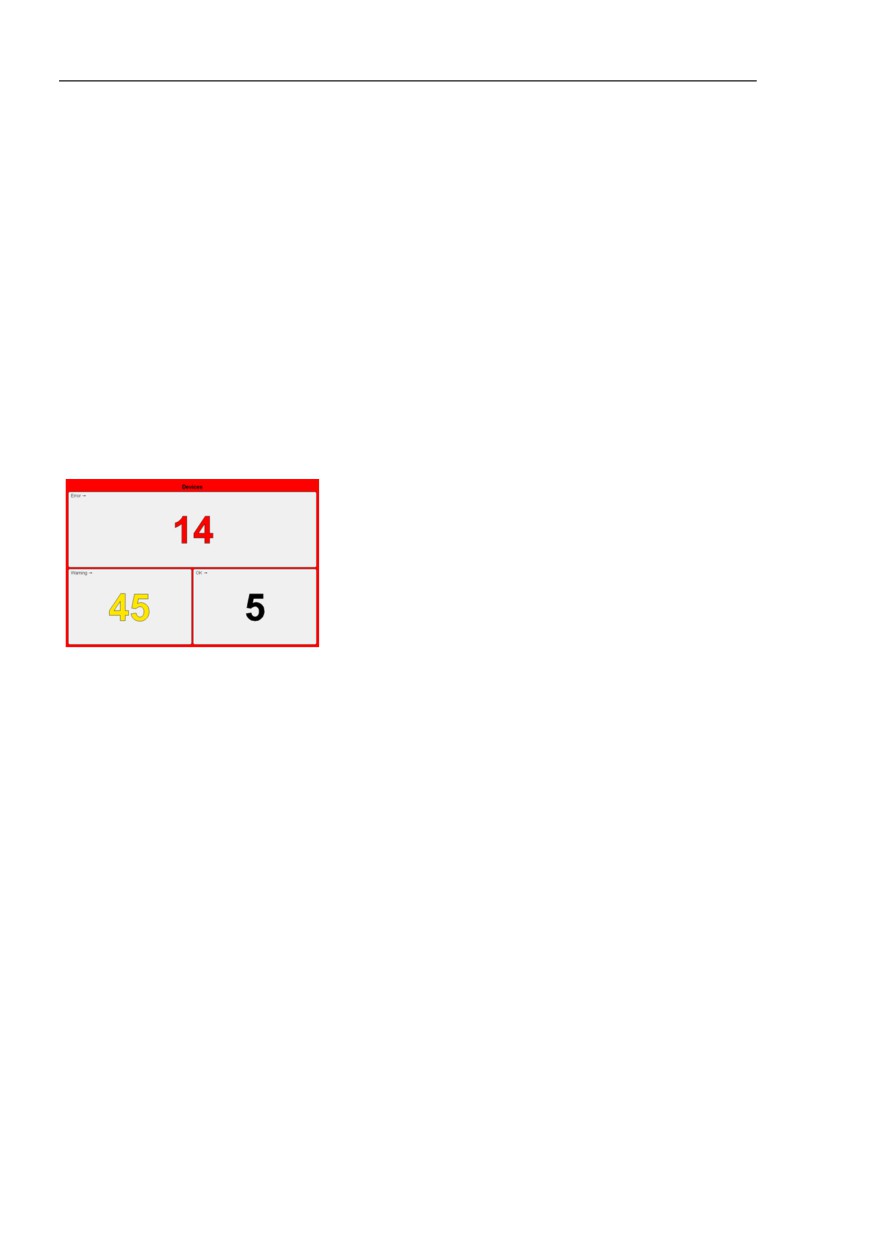
Device Summary Widget
The widget displays a summary of the devices contained in the entire
project. The summary displays devices according to the state of the
device. The widget only displays the state of managed and licensed
devices.
421
References
Tools > Dashboard
Industrial HiVision includes the device and copies of devices in the
summary. When you add a copy of a device to Industrial HiVision, the
“Device Summary“ widget counts the device twice. The reason that the
widget counts the device twice is because the status of the copy can differ
from the original. The “Device Summary“ widget excludes links from the
count.
The widget displays the state of the device regardless of whether the state
of the device is confirmed or not (see “Acknowledge events” on page 92).
After each name in every field is an arrow. The arrow displays the trend
of the field since the last update. For example: the “Warning“ field in the
previous scan displayed 3, the current scan returns 2. The field displays
a down arrow in this case.
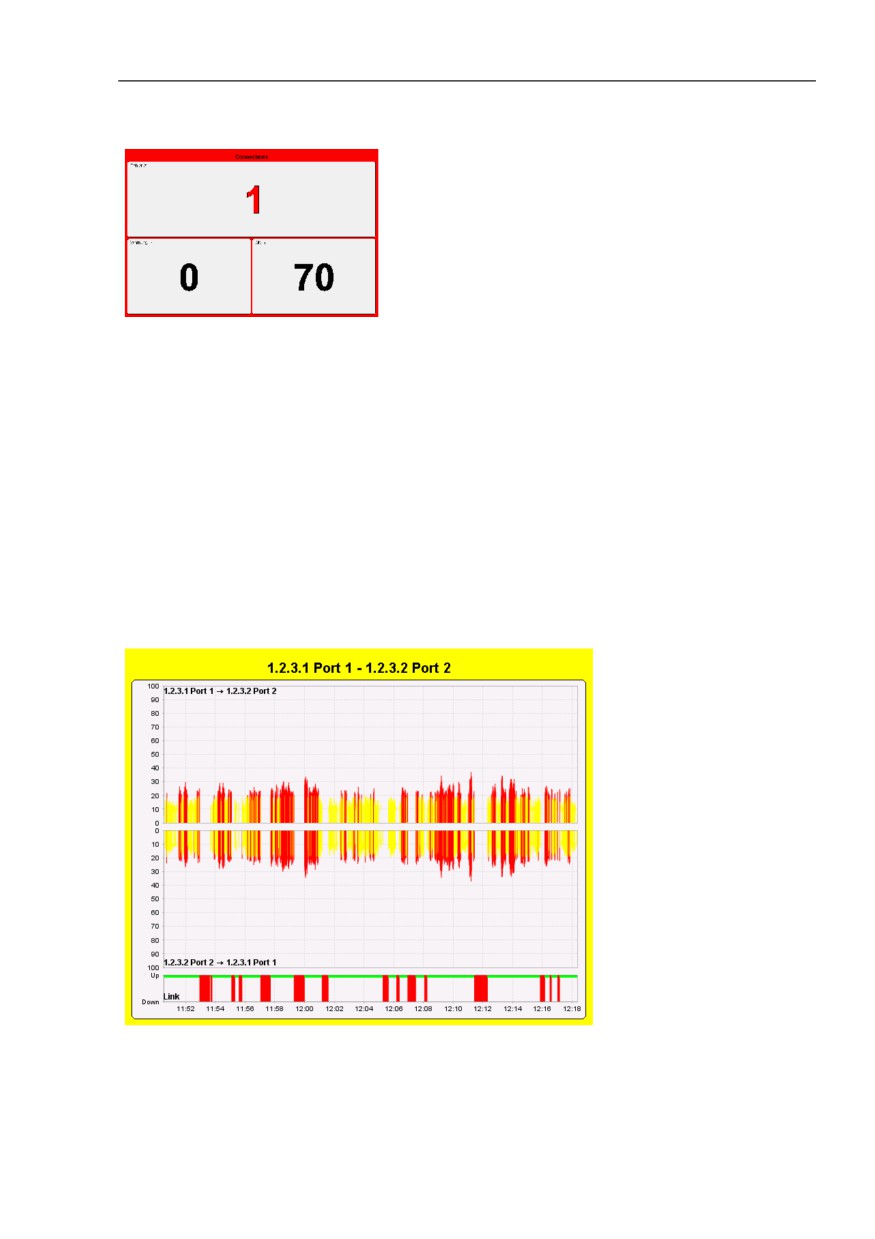
Connection Summary Widget
The widget displays a summary of the connections contained in the entire
project. The summary displays connections according to the state of the
connection.
The widget displays the state of the connections regardless of whether
the state is confirmed or not (see “Acknowledge events” on page 92).
The arrow displays the trend of the field since the last update. For
example, the “Warning“ field in the previous scan displayed 3, the current
scan returns 2. In this case, the field displays a down arrow.
422
References
Tools > Dashboard
Connection Status Widget
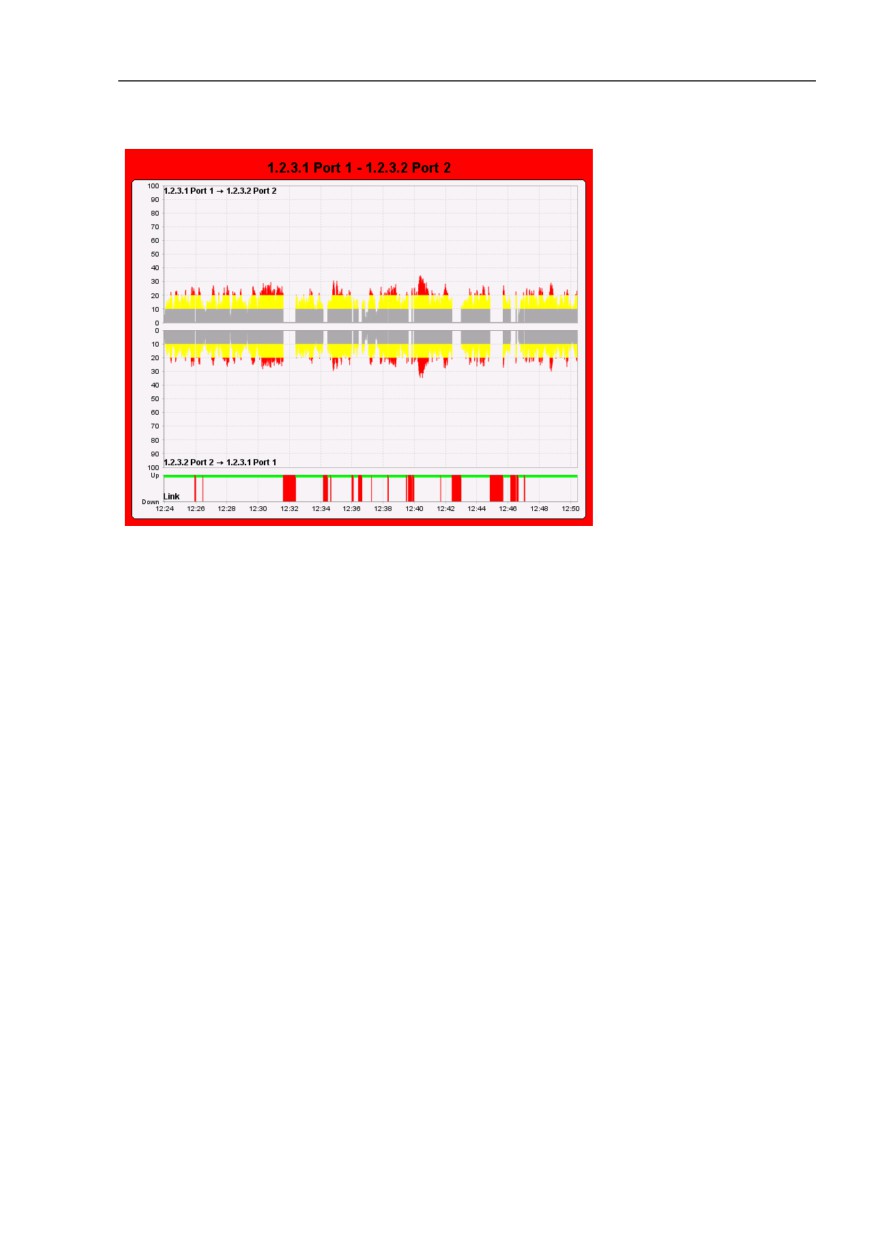
You can add multiple “Connection Status“ widgets to the dashboard. The
“Connection Status“ widget displays the link state and load of selectable
connections as graphs. The graphs display the load values and link state
in separate diagrams. The widget frame displays the color of the current
connection status. The widget retrieves the connection status from the
Industrial HiVision database. If Industrial HiVision detects an error on the
connection for any reason, then the widget frame displays the color
specified for a detected error.
Figure 107:“Connection Status“ widget with “Top to bottom“ function activated.
423
References
Tools > Dashboard
When you create a new widget, the widget is in the unconfigured state.
For example, you have not yet associated the widget with a connection
from a project. In this state the widget displays empty diagrams.
To configure the widget, use the following steps:
Drag and drop the widget to a cell in the dashboard.
To open the “Widget Parameters“ dialog, click the “Properties“ button
on the right side of the dashboard.
Enter the desired history duration, in the “History Size“ field.
The “History Size“ range is from 1 min to 2 h. Default value is 30 min.
Using the pull-down list, select the unit of measure.
Assign a connection to the widget. In the “Connection“ field highlight a
connection.
Click the “OK“ button.
Note: If you select an item that is not a connection, the widget displays
“Widget Configuration Error“.
The widget collects the “In Load“ and “Out Load“ data from the server and
displays it on a history graph. The history graph slowly scrolls across the
widget allowing you to read the information. The widget displays the graph
until you close the widget or specify a different connection.
The “Widget Parameters“ dialog also allows you to configure the visual
aspects of the widget. To configure the widget to display the lower “Out
Load“ diagram directly underneath the upper “In Load“ diagram, mark the
“Top to bottom“ checkbox. To change the load graph from a solid bar type
to a stacked bar type, mark the “Stacked“ checkbox. Each bar displays
the status of the data set according to the diagram type for example, solid
or stacked bars. The widget stores and displays the status configuration
of each data set.
Note: The solid bar diagram draws the bar using the color that represents
the status of the value at that time. The stacked bar diagram displays the
parts of the bar that are below, between or above the thresholds in a
different color. This makes it possible to display changes in the status
configuration.
The widget uses the same thresholds configured in the graphical user
interface. See “Properties of a connection” on page 290.
424
References
Tools > Dashboard
Figure 108:“Connection Status“ widget with “Top to bottom“ and “Stacked“ functions
activated.
The widget attempts to determine the load in both directions using various
means. The widget obtains the values from the database in the following
order:
“In Load“ property values from both end ports of the connection. The
legend displays the direction of the traffic.
If one side does not provide an “In Load“ property, then the widget
uses the “Out Load“ property of the opposite side. The legend displays
the direction of the traffic.
If only one side of the connection is a port, then the widget uses the “In
Load“ and “Out Load“ of this port. The legend displays the name of the
end point with either “In Load“ or “Out Load“ appended.
If the direction of traffic cannot be determined, the diagram and the
legend remains empty.
If you change the connection associated with a widget, then the widget
reflects the changes immediately. If you delete the connection, then the
widget displays “Widget Configuration Error“.
425
References
Tools > Dashboard
Kernel Status Info Widget
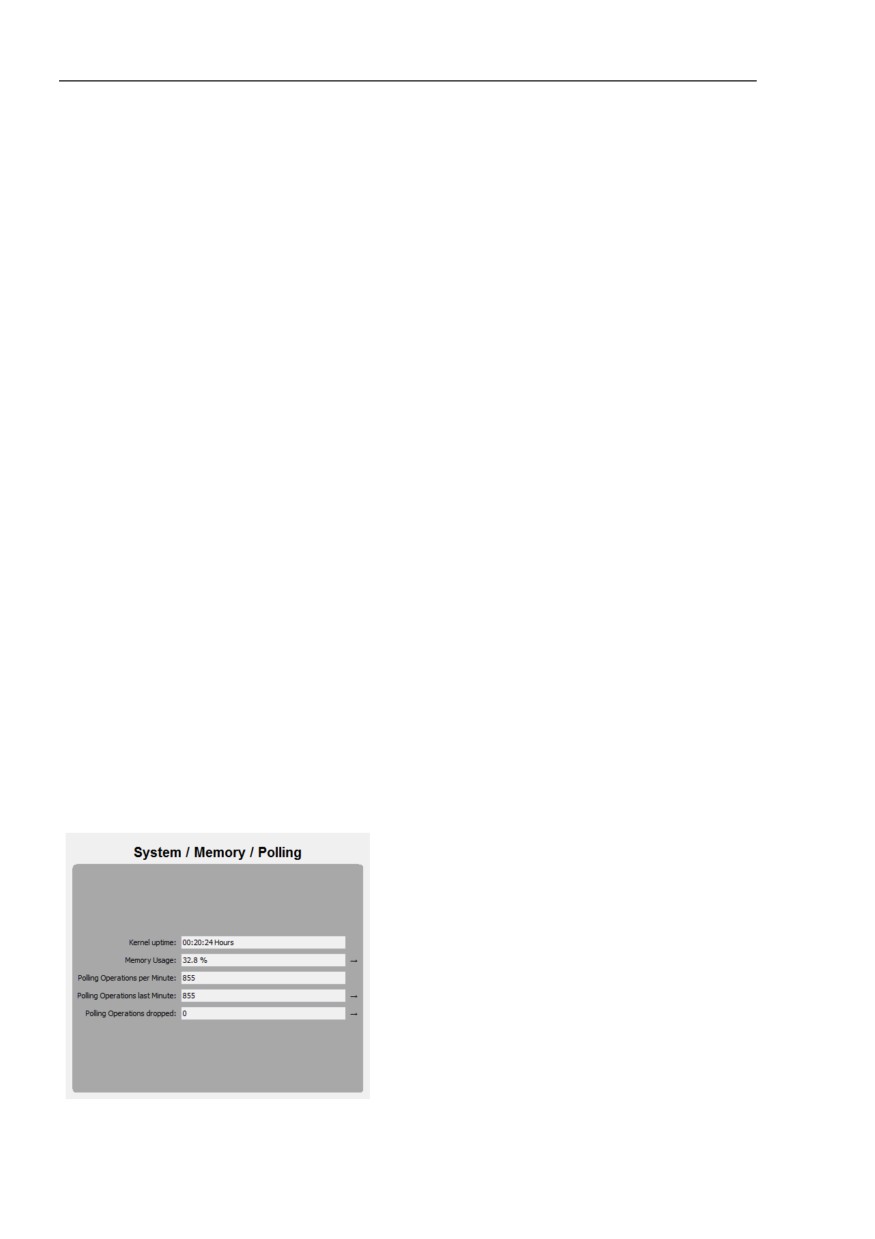
The “Kernel Status Info“ widget displays information about the Industrial
HiVision kernel.
Additional information about the Industrial HiVision kernel is located in a
following chapter, See “Kernel Info” on page 449.
The widget displays the following information:
“Kernel uptime“
The elapse time since Industrial HiVision was started.
“Memory Usage“
The percent of memory that the services are using. Industrial HiVision
calculates the percent of memory as follows:
percent = actual memory used/reserved memory
“Polling Operations per Minute“
The specified number of operations that the kernel can perform in a
minute.
“Polling Operations last Minute“
The number of operations that the kernel was able to perform in the
last minute.
“Polling Operations dropped“
The number of operations that the services dropped in the last minute.
You can influence the number of polling operations dropped by
changing the number of polling operations monitored or changing the
polling interval.
Note: For further information about configuring the parameters that the
kernel polls See “Monitor” on page 304.
426
References
Tools > Dashboard
Security Summary Widget
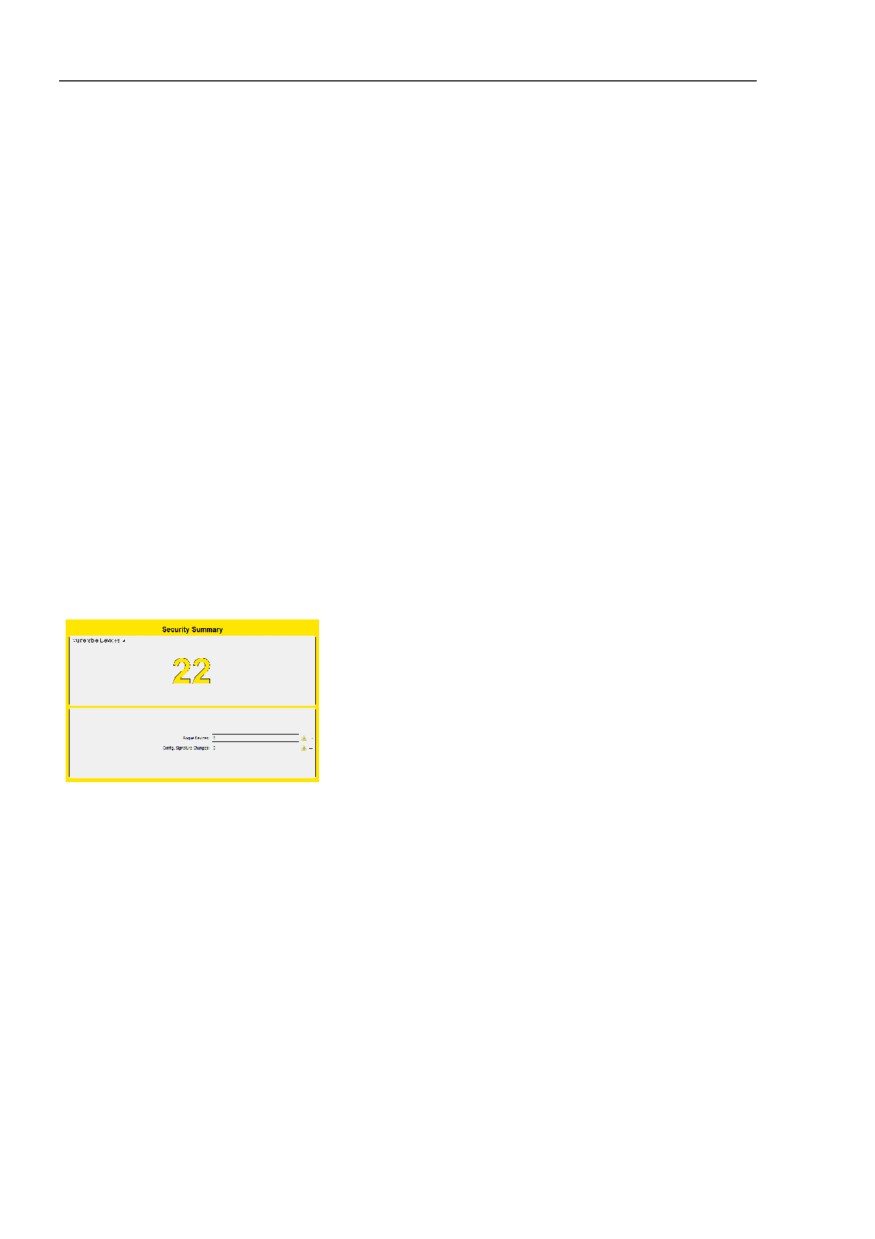
The “Security Summary“ widget displays the security relevant
parameters.
The “Vulnerable Devices“ field displays the number of devices that are
vulnerable to attack. Vulnerable devices have at least 1 function enabled
that is recommended to be disabled, such as the http or SNMP v1/v2
protocols. The widget also counts devices which have the security
functions disabled. The number displayed in the widget represents the
number of devices in your project with a security status worse than OK.
The Industrial HiVision GUI “Security Status“ tab identifies which devices
the widget has included in the results and the security risks. To decrease
the number of devices in the count and increase network security, disable/
enable the functions identified in the “Security Status“ tab. You can also
use the MultiConfig™ “Security Lockdown“ function.
The “Rogue Devices“ field displays the number of devices in the rogue
device map See “Detecting rogue devices” on page 206. When the
number of rogue devices is more than 0, the widget displays the color that
you specified as „Warning“.
Note: The widget displays a warning triangle to the right of the “Rogue
Devices“ field. The triangle is to remind you to activate the function. The
widget hides the triangle after you activate the “Rogue Device Detection“
function.
The “Config. Signature Changes“ field displays the number of devices
with a configuration change. The field counts every change even when
the changes were returned to the original value.
In order for the widget to display the properties, specify a reference value
and configure status calculation as follows:
Open the “Properties“ tab in the Industrial HiVision Graphical User
Interface (GUI).
Open the “Property:“ drop down list, select “Configuration Signature“.
Highlight the device or devices in the table without an active
“Configuration Signature“.
The devices with an active “Configuration Signature“ have a check
mark in the “Status“ column. You can filter the table to locate the
devices that require activation. To filter the table, click on the “Status“
column header until the table displays the entries at the top.
427
References
Tools > Dashboard
Open the “Status Config“ dialog using Configuration >
MultiConfig™ > Status Config.
Mark the “Set current to reference“ checkbox.
Mark the “Value is Reference Value“ checkbox.
Open the “Value is Reference Value“ drop down list, select “OK”.
Mark the “Other Value“ checkbox.
Open the “Other Value“ pull-down list, select “Warning“ or “Error“.
To save the changes, click the “Write“ button.
Note: The widget displays a warning triangle to the right of the “Config.
Signature Changes“ field. The triangle is to remind you to configure the
function. The triangle is hidden after you configure the references for
every device.
The status of the “Config. Signature Changes“ field is either OK for the
value zero or the worst status of the configured “Configuration Signature“
properties.
The arrows indicate the trends of the individual fields.
Numeric Property Widget
The “Numeric Property“ Widget allows you to track the status of
parameters containing numeric values. The widget allows you to track up
to 10 numeric parameters.
The procedure for using the “Widget Parameters“ dialog to enter the
parameters that you want to monitor is described in the following steps:
To open the “Widget Parameters“ dialog, click the “Properties“ button.
Specify the length of time that you want to monitor the devices in the
“History Size“ field.
Default: 30
428
References
Tools > Dashboard
Specify the “History Size“ units of measure for the length of time that
you want to monitor the parameters.
Default: “Minutes“
Select up to 10 parameters from the project tree.
You can specify a different name for the widget in the “Title“ field.
Click the “OK“ button.
The following list contains some of the numerical parameters that the
widget can monitor:
“Ports“:
“In Load“
“Out Load“
“Speed“
Agent:
“Number of Users“
Protocol:
“Moving Avg Response Time“
“Avg Response Time“
“Min Response Time“
“Max Response Time“
“Std. Deviation“
“Message Loss“
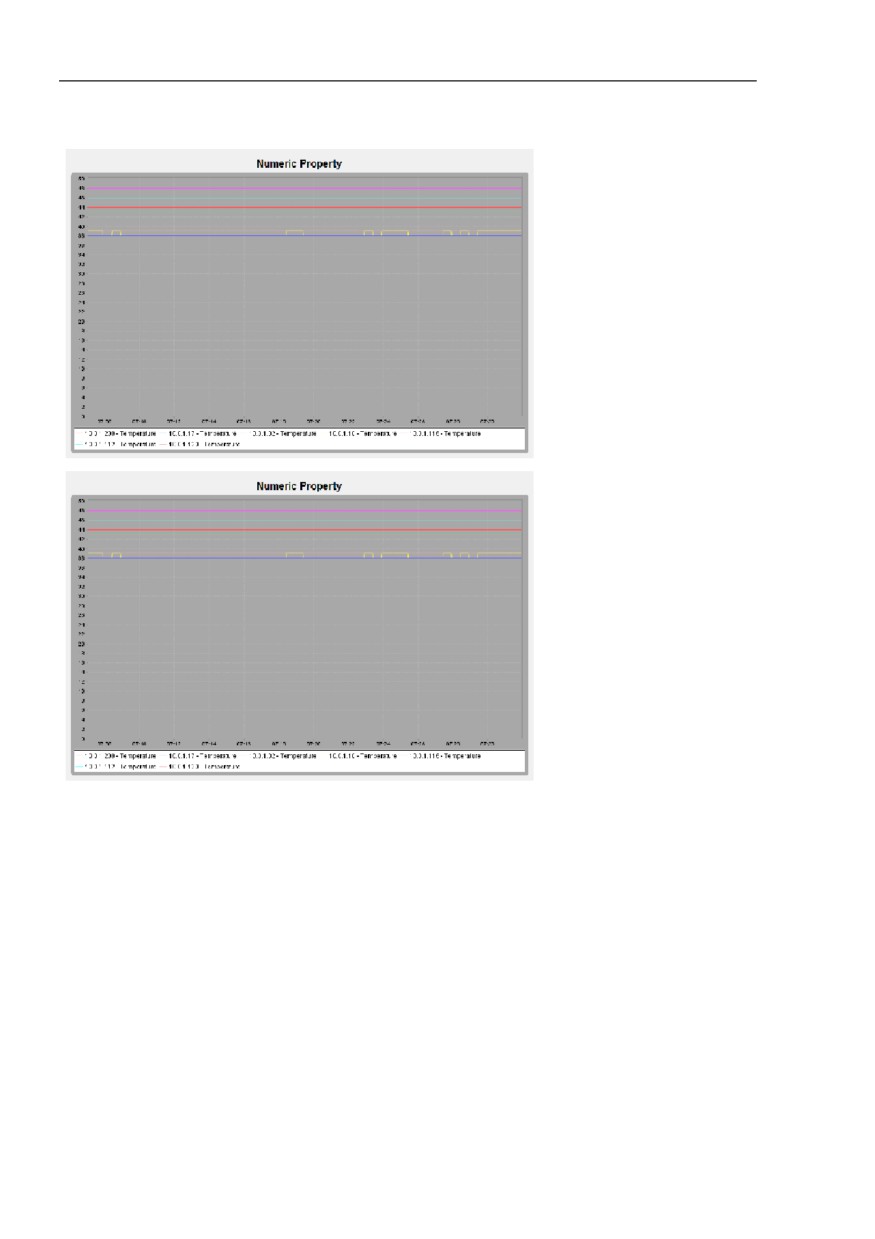
Note: It is possible that 2 devices have the same value for a parameter
for example, devices 10.0.1.10, 10.0.1.17 and 10.0.1.200 have a
temperature of 38° and 39°. In this case, one trace covers the other. See
the blue, yellow and orange traces in the “Numeric Property“ figure below.
429
References
Tools > Dashboard
Moving Avg Ping Response Time Widget
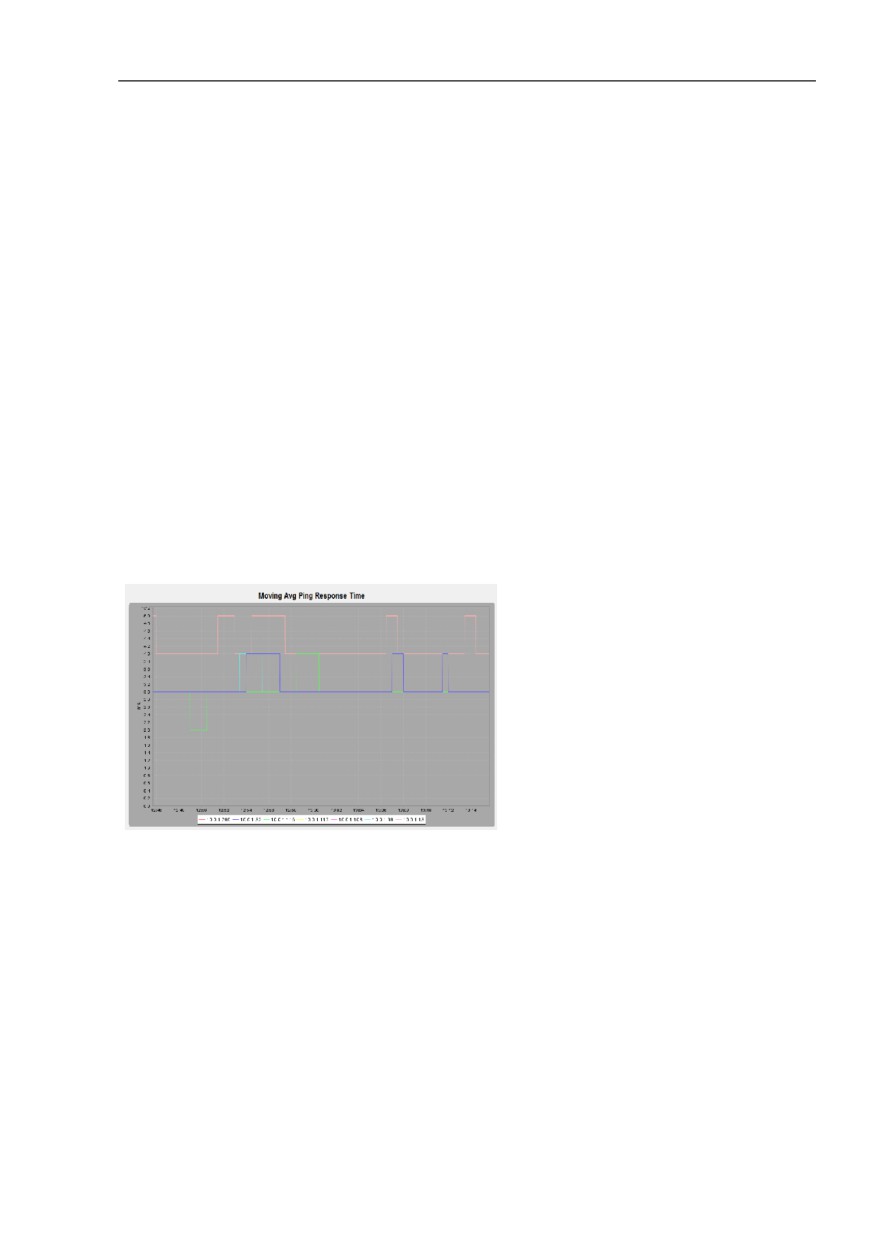
The “Moving Avg Ping Response Time“ widget allows you to display the
response time of a ping request for up to 10 devices. You can enter the
devices using either drag and drop or the “Widget Parameters“ dialog.
The procedure for using the “Widget Parameters“ dialog to enter the
devices that you want to monitor is described in the following steps:
To open the “Widget Parameters“ dialog, click the “Properties“ button.
Specify the length of time that you want to monitor the devices in the
“History Size“ field.
Default: 30
430
References
Tools > Dashboard
Specify the “History Size“ units of measure for the length of time that
you want to monitor the devices.
Default: “Minutes“
Select up to 10 devices from the project tree.
Click “OK“.
The procedure for using the drag and drop method to enter the devices
that you want to monitor is described in the following steps:
Open the GUI Map tab.
Highlight the device or devices you want to monitor.
Drag and drop the highlighted devices in the “Moving Avg Ping
Response Time“ widget.
Note: Each time you select new devices to monitor, the widget replaces
the current devices with the newly selected devices.
For further information about ICMP moving averages See “Service
Parameters” on page 388.
Top 10 Moving Avg Response Time Widget
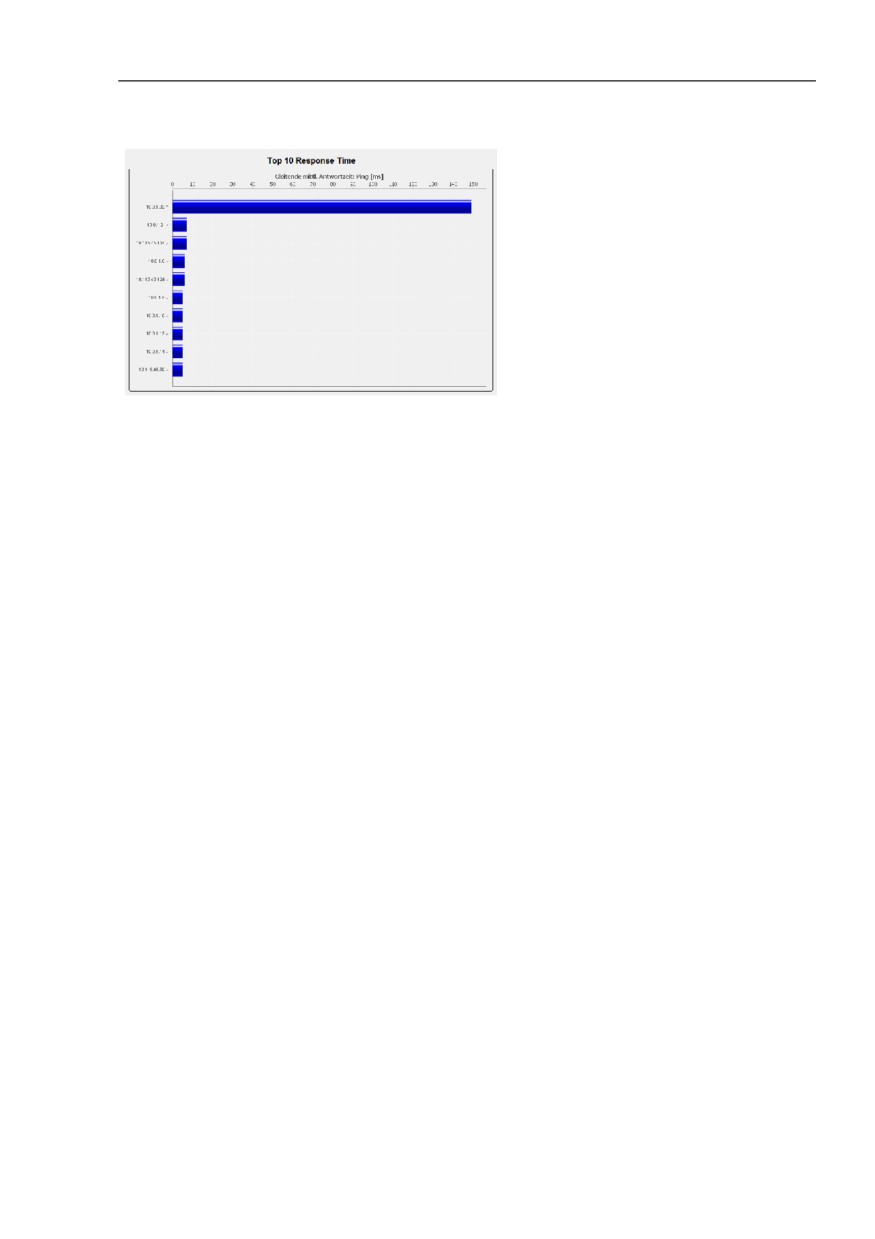
The widget displays the moving average response time of up to 10
devices. The devices with the higher moving average response time are
displayed at the top of the chart.
431
References
Tools > Dashboard
To configure the widget, open the “Widget Parameters“ dialog using the
“Properties“ button. The dialog allows you to specify which protocol the
widget displays. You can select from the following protocols using the
drop down list:
Ping (default setting)
SMNP V1
SMNP V3
The widget displays a trend arrow next to the IP address of each device.
The trend arrow indicates the movement in position of a device, with
reference to the other devices displayed in the widget, since the last poll.
The information provided in the widget helps you to plan for optimal
performance in your network. For example, the widget displays which
device has a high average response time. A high average response time
can cause a bottle neck in your network. If a device with a high response
time is in the middle of your network, then the device can effect the other
devices in your network. Replacing the slow device allows the data
stream to be transmitted unhindered.
The following list contains some possible causes of high response times:
Device is overwhelmed with data being sent to the CPU.
Receiving and forwarding data is the primary task of a network device.
Processing management requests are secondary tasks.
The path to the device is slow.
- Slow connection
- Slow connection of neighbor
- Old fiber or Ethernet cable
Note: When you configure the widget for the first time, there is a
possibility that the widget displays high response times. In this case, allow
the display to stabilize before taking action. If after 1 minute the average
response time for a device remains high, then consider taking action.
432
References
Tools > Dashboard
PoE Status
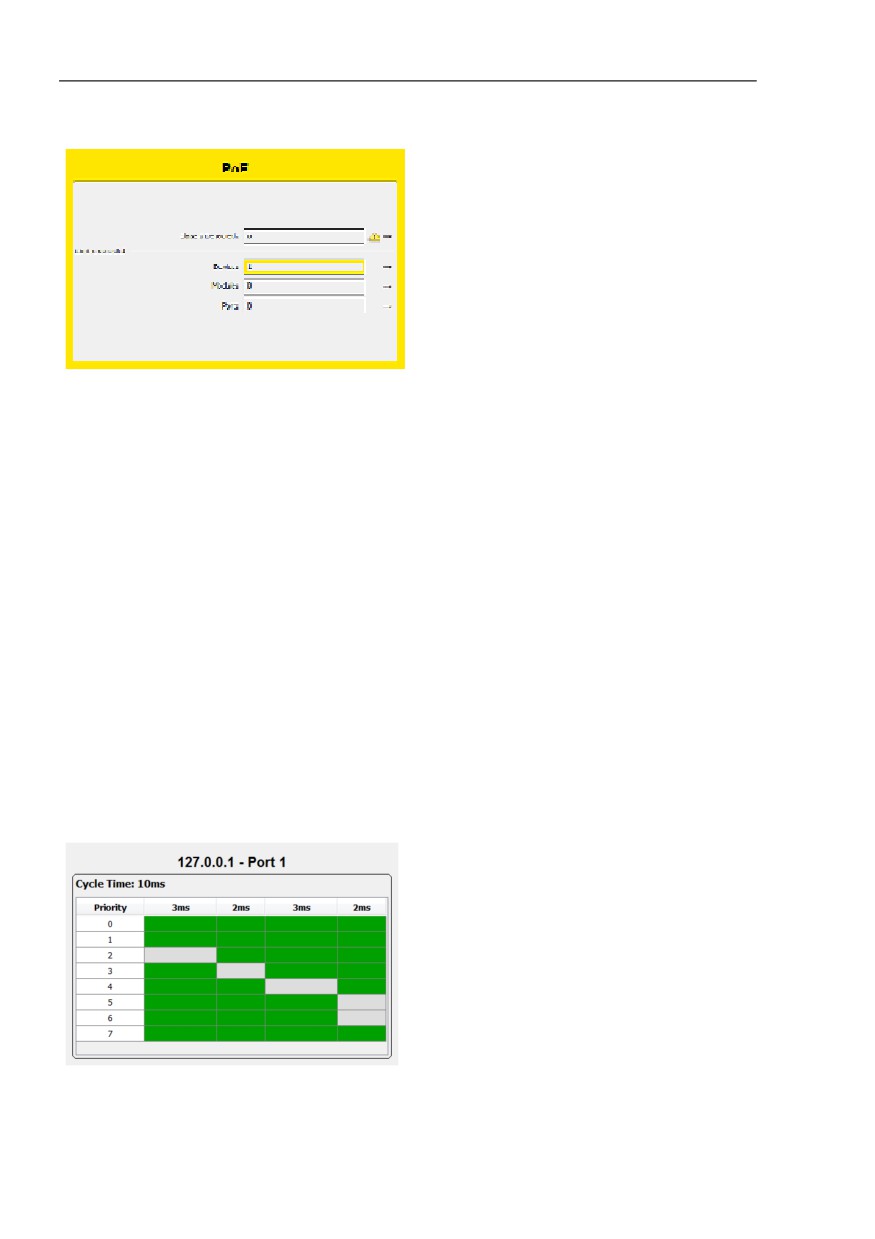
The “PoE Status“ widget allows you to monitor the status of the PoE
devices in your network.
The widget displays the sum of the warnings found in the “PoE“ tab for the
following parameters:
“Class 0 Detected“
Displays the sum of the ports on which the device has detected that a
class 0 device is connected.
“Device“
Displays the sum of the devices on which the “Device Limit“ is
exceeded.
“Module“
Displays the sum of the modules on which the “Module Limit“ is
exceeded.
“Port“
Displays the sum of the ports on which the “Port Limit“ is exceeded.
The arrow displays the trend of the field since the last update. For
example, the “Class 0 Detected“ field in the previous scan displayed 3, the
current scan returns 2. In this case, the field displays a down arrow.
If you disable the “PoE Class 0 Detection“ function on ports in the “PoE“
tab, then the widget displays a warning triangle next to the “Class 0
Detected“ field. Ports on which you disabled the detection function are not
included in the number entered in the “Class 0 Detected“ field.
Note: If the widget displays a warning triangle next to a field, then there
can be more items effected than the number indicates.
433
References
Tools > Dashboard
Figure 109:“PoE Status“ Widget
TSN Schedule Widget
The widget displays the TSN cycle time, and gate control of a port in a
table. The table displays a row for each “Priority“ class. The columns left
of the “Priority“ class display the status of each gate.
A gate is a period of time during which the port is either opened or closed
for the priority class. An open gate forwards the traffic of the priority class,
and a closed gate blocks the priority class traffic. A green cell displays an
open gate and a gray cell displays a closed gate. The width of the column
displays the length of time that the gate is either opened or closed in
relation to the cycle time.
To configure the widget, click the “Properties“ button. Industrial HiVision
opens the “Widget Parameters“ dialog. The dialog allows you to specify
which TSN compatible port the widget displays.
Figure 110:“TSN Schedule“ Widget
434
References
Tools > Dashboard
8.13.2 Web Interface
The “Web Interface“ tool enables you to open, from the Industrial HiVision
interface, the Web-based interface of the device selected in the window in the
web browser.
435
References
Tools > Dashboard
8.13.3 Device Configuration
The “Device Configuration“ tool allows you to open, from the Industrial
HiVision the Web-based interface of the device selected in the window, as a
Java application. Here, Industrial HiVision uses the login name and the
password from the SNMP configuration settings (see on page 376 “Device
Credentials”). Thus, Industrial HiVision spares you having to login and you
go directly to the start page of the device.
The following series of devices support this function:
MACH 4000
MACH 1000
MACH 100
GREYHOUND
PowerMICE
MS20/MS30
MSP
RS20/RS30/RS40
RSP/RSPS/RSPL
RSR20/RSR30
RED
EES20/EES25
OCTOPUS
and EAGLE 20/30/40
Magnum 12KX
TCSESM
TCSESM-E
TCSG
TCSN
TCSEFEC
MCSESM
MCSESP
ESM 801-TG
ESM 802-TG
ERT
AFF650
AFS650/655
AFS66x
AFS670/675
AFS677
AFR677
436
References
Tools > Dashboard
Note: Industrial HiVision allows you to use the graphical user interface of
Hirschmann products with the “Device Configuration“ function independent
of other applications, such as a browser or an installed Java environment.
Hirschmann has developed Industrial HiVision as an application that enables
you to use the graphical user interface easily with the “Device Configuration“
function in a closed network.
When Industrial HiVision sets up a secure connection with HTTP or SSH,
Industrial HiVision does not check the identity of the device with which
Industrial HiVision is connecting. Additionally, Industrial HiVision does not
display the identity of the device to the user. Someone attacking the network
could take advantage of this omission of a check to access sensitive
information.
Recommended actions use Industrial HiVision in a closed network. Do not
use the “Device Configuration“ function and MultiConfig™ dialogs that use
HTTPS in an open network. Perform an update of Industrial HiVision as soon
as a newer version is available.
8.13.4 CLI
The “CLI“ tool allows you to create a connection to the selected device from
the Industrial HiVision interface. Industrial HiVision opens its own window.
Industrial HiVision automatically checks whether the device allows an SSH
session or a Telnet session. Industrial HiVision preferably establishes an
SSH session.
Note: Under Linux, the “CLI“ tool requires that Telnet and SSH clients are
installed and that the environment variable PATH contains the name of the
directory in which the “xterm” program is installed.
437
References
Tools > Dashboard
8.13.5 SNMP Browser
The “SNMP Browser“ tool enables you to read and write the MIB of a
selected device. Industrial HiVision displays the MIB in a new window.
Note: The “SNMP Browser“ is a freely usable additional software. The
“SNMP Browser“ is not subject to the system test.
8.13.6 Ping
The “Ping“ tool enables you to send a Ping query to the devices selected in
the window. Industrial HiVision opens a separate Ping window.
Note: Under Linux, the “Ping“ tool requires that the environment variable
PATH contains the name of the directory in which the “xterm” program
is installed.
8.13.7 HiDiscovery Scan
The “HiDiscovery Scan“ lets you discover the devices in the network that
support the HiDiscovery V1 protocol, as long as these devices have the
HiDiscovery V1 v1 protocol activated.
438
References
Tools > Dashboard
Note: As far as HiDiscovery V1 is concerned, Industrial HiVision only
supports the HiDiscovery V1 v1 protocol.
Example configuration
In this example you scan your network to discover devices which have the
HiDiscovery V1 protocol active.
Open the Preferences > Advanced > Management Station dialog.
Select the adapter connected to the network that you wish to scan from
the Network Card Management Station > Default Network Card
(HiDiscovery V1) drop-down list.
To save the values in Industrial HiVision and close the dialog, click the
“OK“ button.
To scan the network, click the “HiDiscovery Scan“ button.
8.13.8 Scan Network
The “Scan Network“ function enables you to detect every device within an IP
address range of the network specified see “[Basics ]” on page 322. To start
a search for new devices, select the “Scan Network“ option from the drop-
down list.
The “Scan Network“ tool has a toggle function. The toggle function starts and
stops a network scan. If a network scan is in progress, then to stop the
current network scan, click the “Scan Network“ button.
439
References
Tools > Dashboard
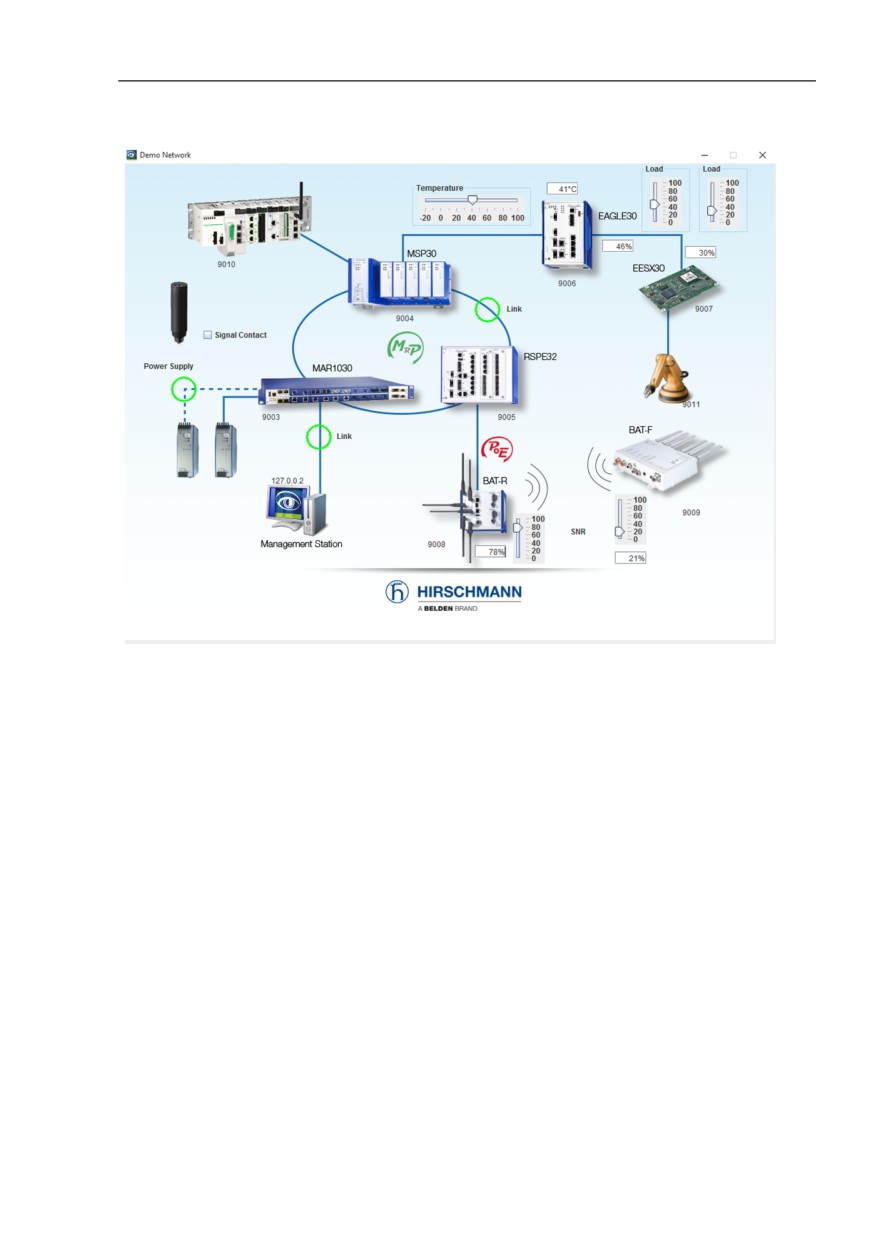
8.13.9 Demo Network
The “Demo Network“ program supplied allows you to simulate a network on
your computer in order to familiarize yourself with Industrial HiVision without
being connected to a network.
To start the simulation of the demo network, select Tools > Demo
Network.
In the default state, the device discovery is activated by a trap, and Industrial
HiVision detects the demo devices. Industrial HiVision displays the demo
devices in the “New Devices“ folder. Because the demo network functions
without a network connection, the demo network is simulated using the local
host interface with the IP address 127.0.0.1 and differentiates the devices
through the port numbers: 127.0.0.1:9003, 127.0.0.1:9004, 127.0.0.1:9005.
The simulation replicates the following management functions of the devices:
Topology discovery based on LLDP
Line interruptions
Line interruption in the MRP
Missing power unit
Network load on device 9010
Switch signal contact on/off
Change device temperature
440
References
Tools > Dashboard
Figure 111:Demo network
8.13.10Calculate Availability
Due to their physical properties, each component in the network has a limited
lifetime. The MTBF is the mean time between failures.
Repairs of the components also take a certain amount of time. The MTTR is
the mean time to repair.
Industrial HiVision calculates the availability of a path based on the MTBF
and MTTR values of the affected devices along that path.
Industrial HiVision also considers redundant paths here.
The type of a connected device affects the availability of the network. A
redundantly connected switch/router has a bigger effect on the availability of
the network than a redundantly connected terminal device.
441