Network Management System Industrial HiVision 8.2. User Manual (2021) - page 10
References
8.2 Edit
Figure 63: Configuring detail properties
285
References
8.2 Edit
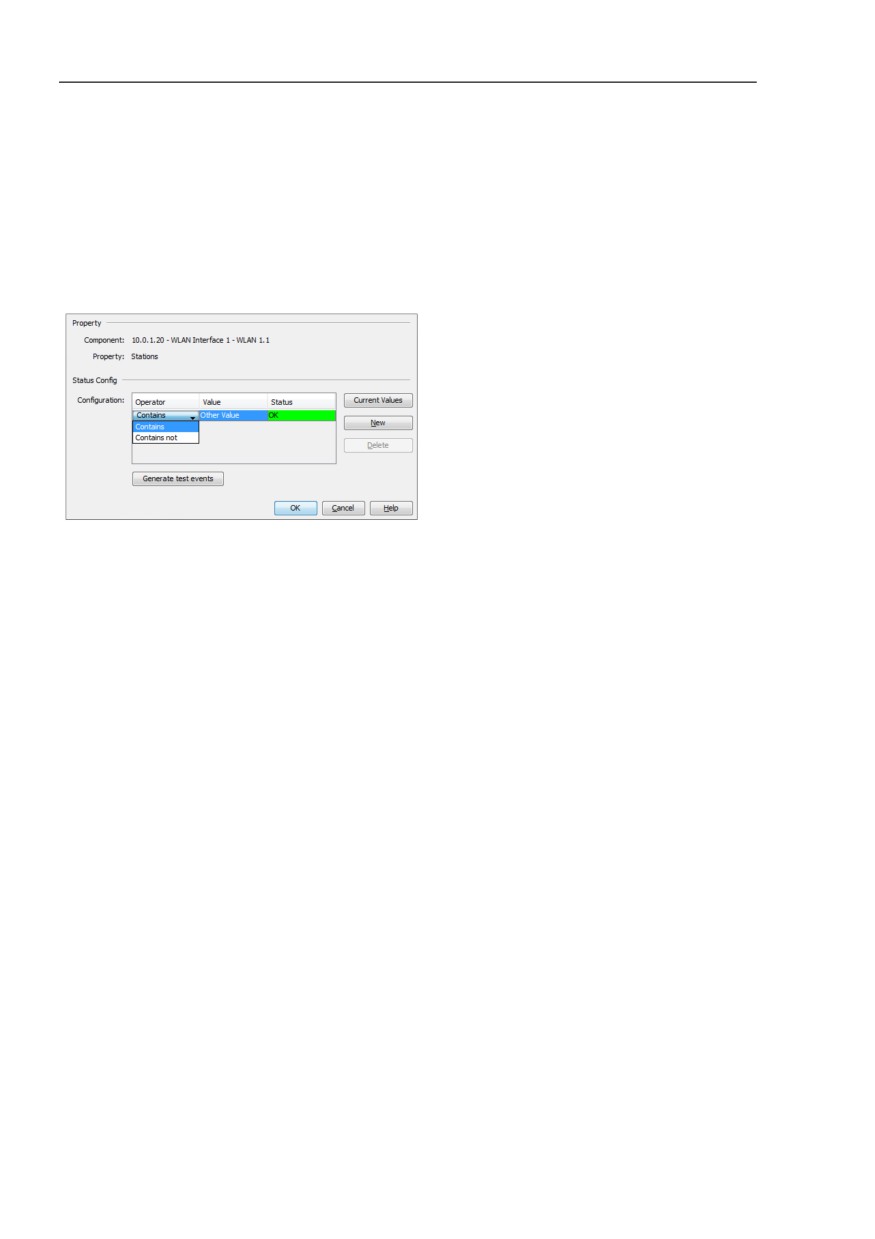
Specified values
The “Status Config“ dialog displays the possible values of the component
detail.
Use the drop-down list to assign the statuses you require to the values.
The operators provide you with further options for the definition of the
status configuration.
Figure 64: Example for the status display of default values
286
References
8.2 Edit
List values
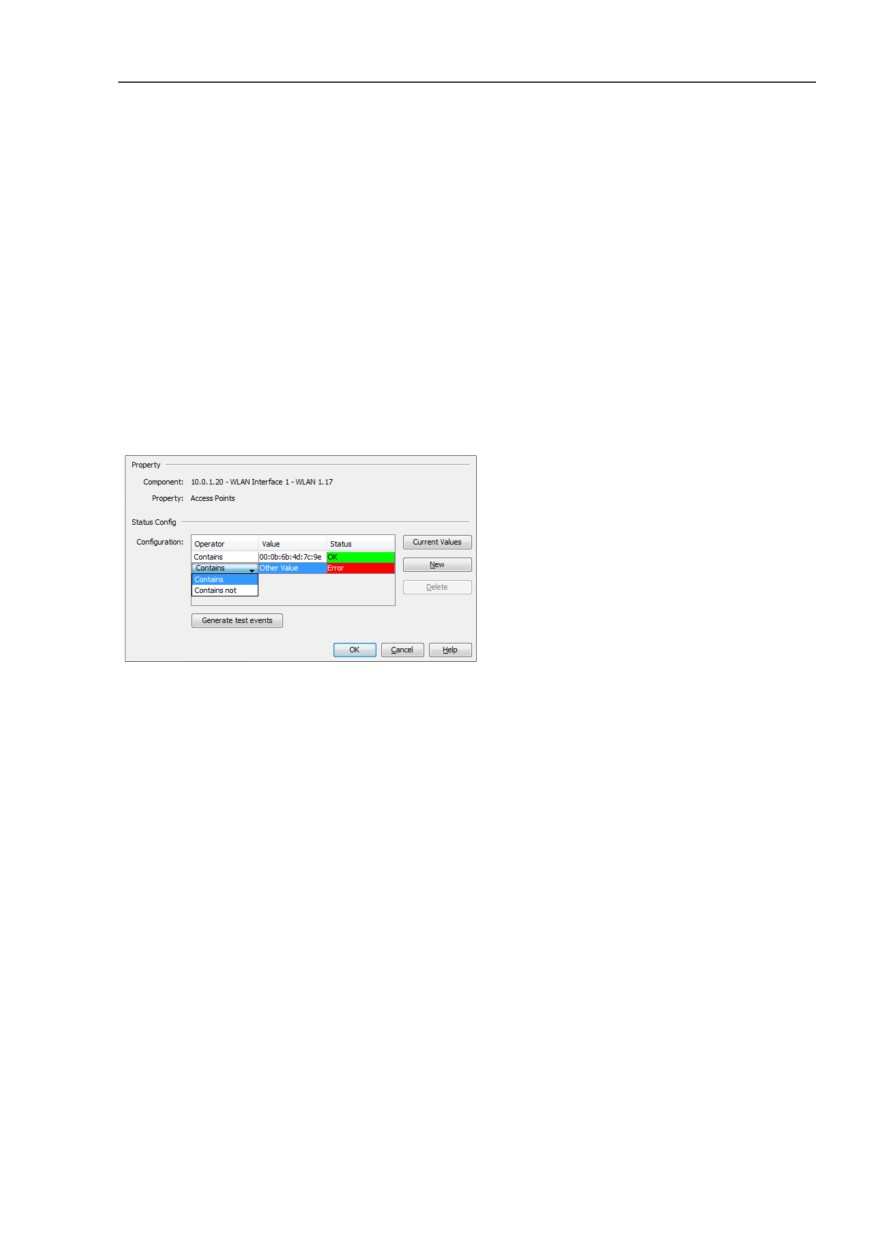
The “Status Config“ dialog displays a list with current values of the
component detail.
Use the drop-down list to assign the statuses you require to the values.
In contrast to “Defined values”, the values are variable and you can use
“Current values” to read in the currently available values, use the “New“
button to enter your own values in the list and use the “Delete“ button to
delete values from the list.
Application example: You want an error message when unauthorized
stations login to an access point. Enter the permitted stations in the list
and set “Other Value” to “Error” (see figure 65).
Figure 65: Status display for list values
287
References
8.2 Edit
Numeric values
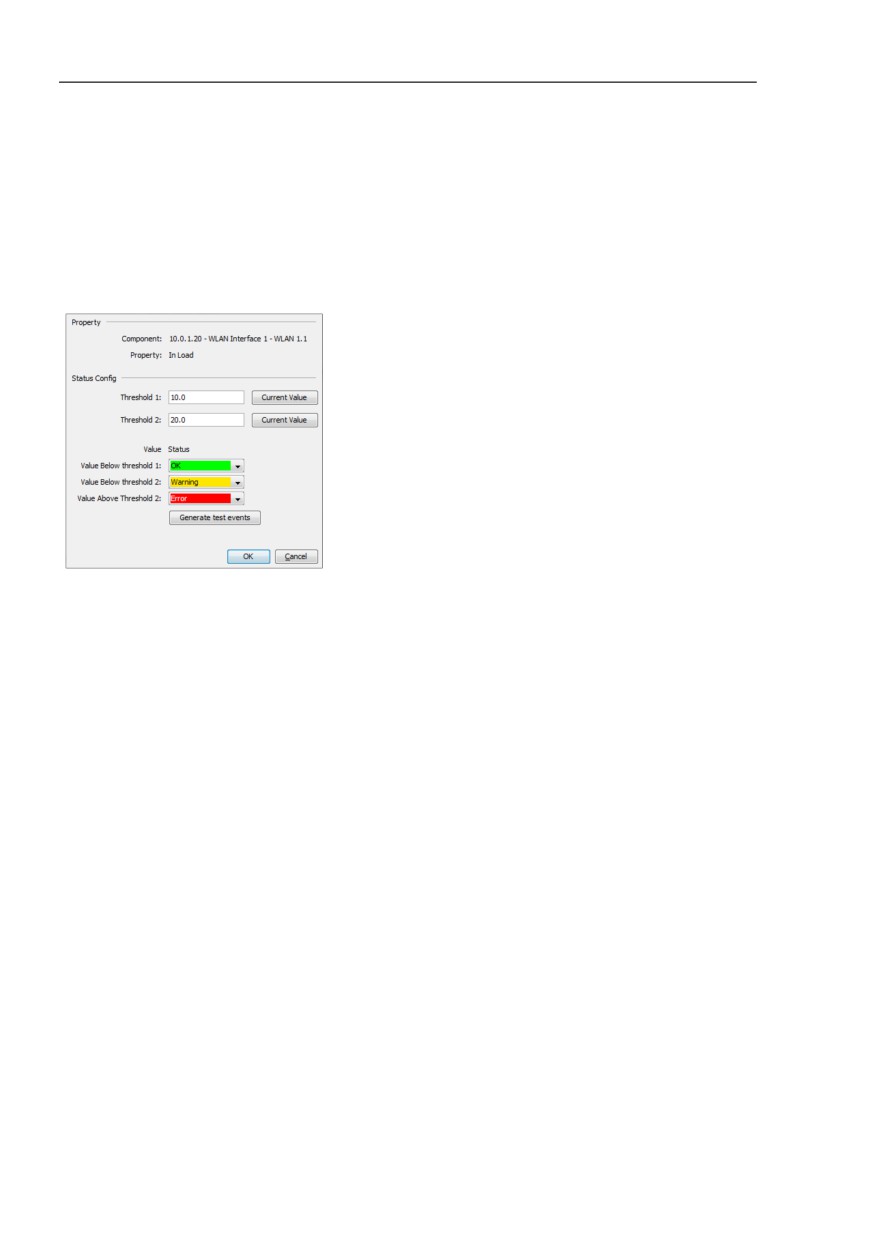
The “Status Config“ dialog allows you to enter threshold values
numerically.
Use the drop-down list to select the statuses which Industrial HiVision
assigns to the device when these threshold values are exceeded or not
reached.
Figure 66: Status display for numeric values
288
References
8.2 Edit
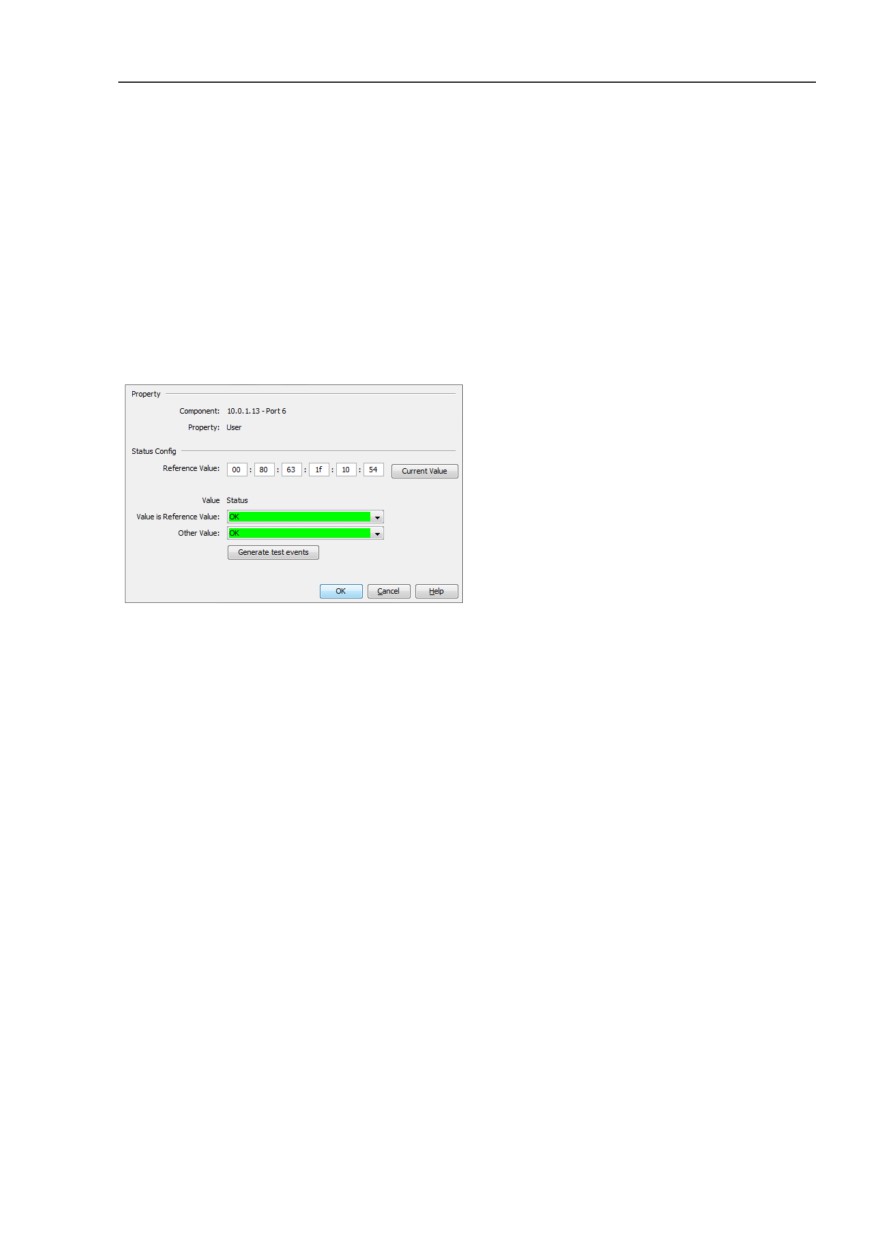
Alphanumeric character string
The “Status Config“ dialog allows you to assign an alphanumeric value to
the device detail.
Use the drop-down list to select the statuses which Industrial HiVision
assigns to the device for other character strings.
Example: On a port enter the MAC address of the connected device. If the
MAC address of the connected device is correct, assign the status “OK“.
If the MAC address of the connected device is different, assign the status
“Error“. As soon as the MAC address changes, you get an error message.
Figure 67: Status display for alphanumeric values
Generate test events
The “Generate test events“ button offers you the possibility to generate
events related to properties status changes. You can then assign one of
the newly generated events to an alarm.
After you click the “Generate test events“ button, Industrial HiVision opens
the “Test Events“ dialog so that you can review the generated events. You
can view the same generated events in the “Test Events“ tab of the
“Import event“ dialog. If you select an event in the “Test Events“ tab, then
you can assign it to an alarm.
Industrial HiVision does not enter the test events in the event list.
In this example, you generate test events, then assign an action to an
event. To generate test events proceed as follows:
Double-click on a device for which you wish to generate a test event.
In the “List“ tab, right-click on the property for which you wish to
generate a test event.
In the drop-down list, select the “Properties...“ option.
289
References
8.2 Edit
In the “Status“ frame, mark the “Determine“ checkbox.
Click the “Status Config“ button.
In the “Status Config“ frame, configure the property to generate the
necessary event.
Click the “Generate test events“ button.
Click the “Close“ button.
To assign an action to an event proceed as follows:
Open the “Preferences“ dialog.
Select “Event Actions“ from the menu tree.
Verify that an action is available in the “Actions“ table.
In the “Alarms“ frame, click the “New“ button.
In the “Filter“ frame, click the “Import...“ button.
In the “Import event“ dialog, select the “Test Events“ tab.
Select the event for which you wish to assign an action.
Click the “OK“ button.
Industrial HiVision takes the information from the event and enters it in
the “Filter“ frame.
Mark the checkbox in the “Actions“ table for the action that you wish
Industrial HiVision to perform.
Click the “OK“ button.
8.2.25 Properties of a connection
The properties dialog of a connection consists of 2 tabs: “Connection“ and
“Properties“
You can access a third property, the history of the connection, by double-
clicking on the connection.
To access the properties dialog, right-click on a connection and select
“Properties...“ from the drop-down list.
290
References
8.2 Edit
Connection
On the “Connection“ tab you select the ports which are connected. To
give you a better overview, the dialog provides you with an option of
selecting the ports that will appear in the selection display.
If the speed display is activated, when the speed is increasing Industrial
HiVision increases the line thickness in 2-point steps at 10, 100, 1000,
10000 MBit/s. If the speed display is activated, Industrial HiVision
displays the current connection setting in the bubble help.
If the speed display is deactivated, Industrial HiVision displays the current
speed setting even if you have activated the speed display in the
connection properties dialog (see on page 359 “Device”).
With automatic display of the connection medium using the connection
end icon, Industrial HiVision selects the respective icon. Industrial
HiVision allows you to define the connection end icon for a connection
yourself. This option enhances clarity when conditions prevent
determination of the medium.
If observing the connection is important for you, you can query the
following standard parameters at freely specified intervals:
Link status
Load (incoming load)
If a terminal device on a connection does not supply a value for the
incoming load, then Industrial HiVision displays the outgoing load of
the other end of the connection as the incoming load at this end.
Port redundancy
WLAN port properties
Industrial HiVision uses “Record““Load History“ to store the value of the
queried incoming load on an ongoing basis.
Properties
The “Properties“ tab for the connection allows you to give the connection
any name you want and to specify the status handling.
The status display can be used for monitoring your network. Here you
select whether Industrial HiVision determines the status of this connection
and whether Industrial HiVision forwards the status determined to the next
highest level. In the default setting, Industrial HiVision determines the
status and forwards it to the next highest level, as soon as you have
assigned the connected ports (see below).
291
References
8.2 Edit
Under “Availability“, you can find the fields for entering the “MTBF“ and
“MTTR“ values that Industrial HiVision uses for calculating availability
(see on page 441 “Calculate Availability”).
8.2.26 Adding a component detail to a port
Industrial HiVision provides the monitoring of many component details for the
individual components. Industrial HiVision provides an overview of a
selection of these details.
To add another component detail to a port, proceed as follows:
Select a port from the folder frame
Open the “List“ tab.
Right-click on the empty space in the “List“ dialog.
Select New > Property.
Industrial HiVision then provides you with a list of additional component
details. A component detail is available as a “Delta“ type and “Absolute“ type.
“Delta“: The monitoring refers to the difference between the values for two
consecutive inquiries. The symbol of the delta property is a triangle in the
top right corner.
“Absolute“: The monitoring refers to the absolute value for each particular
inquiry.
292

References
8.2 Edit
Figure 68: Symbols for Delta and Absolute properties
You double-click on a row to select the corresponding component detail
and thus create a symbol for this component detail in the detail display.
Right-click on the symbol and select “Properties“ to open the “Properties
of a component detail” dialog, See “Properties of a component detail” on
page 283.
8.2.27 Add to reporting
The reporting function allows you to manage long-term statistics outside of
the database of the network management system program.
You can add the following items to the reporting function:
Pollable device details
Connections between 2 devices, at both ends of which Industrial HiVision
has detected a link status.
To add a device detail or a connection to the reporting function, right-click
on the device detail or the connection detail and select “Add to
Reporting...“.
To add more than 1 device detail at a time to the reporting function,
proceed as follows:
Open the “Properties“tab.
Highlight the items that you want to add.
Right-click on a property.
Select the “Add to Reporting...“ option.
293
References
8.2 Edit
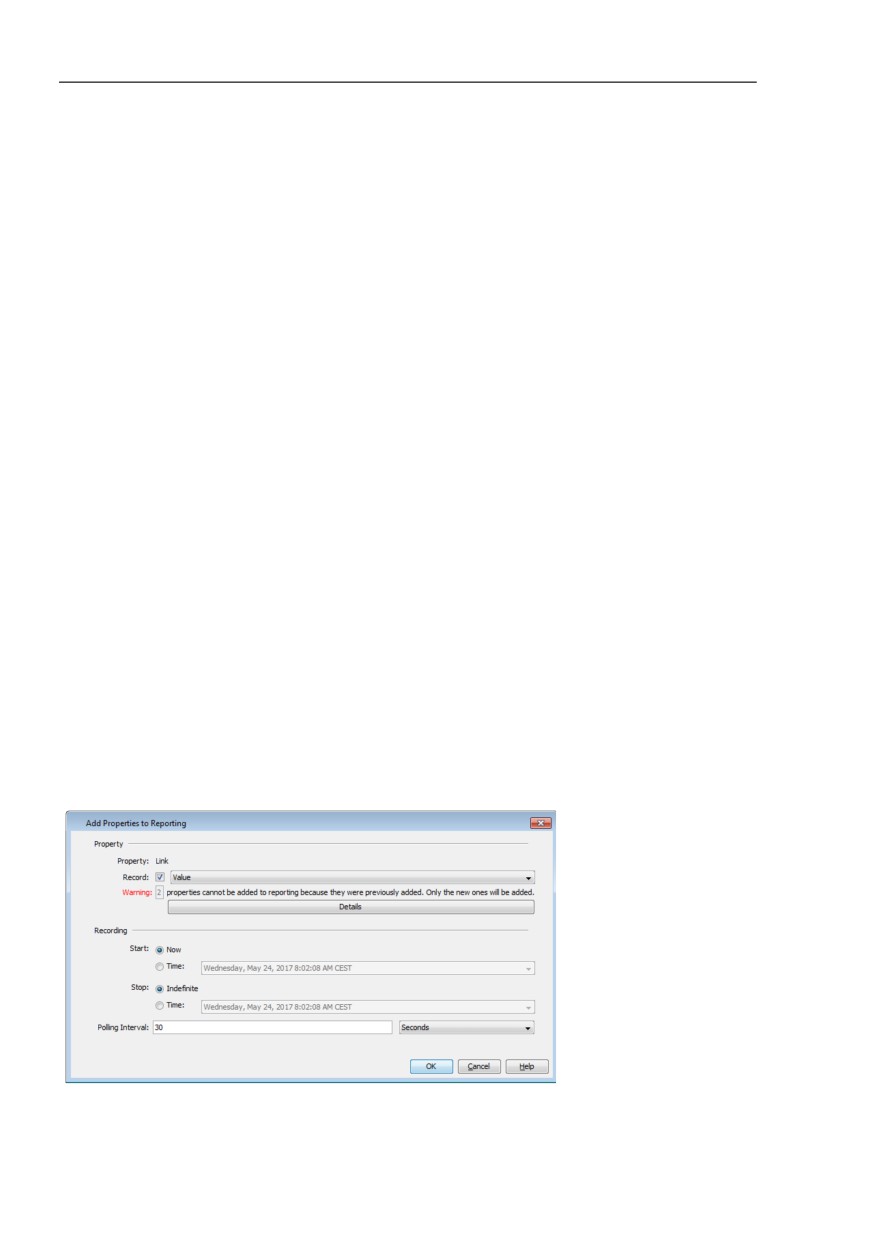
Note: If a device detail was previously added to the reporting function, then
Industrial HiVision displays a message stating how many items were not
added in the “Add Properties to Reporting“ dialog. The “Reporting“ dialog
displays the monitored items (see on page 307 “Reporting”).
The dialog allows you to use “Record“ to activate/deactivate the reporting for
this property or this connection. If you deactivate the reporting, the entry
remains in the reporting function (see on page 307 “Reporting”). For the
reporting, you have the choice of recording the value or recording the status.
“Start“ and “Stop“ allow you to define when the recording starts and when it
stops. With the default setting, the recording begins right after you click the
“OK“ button and continues for as long as the Industrial HiVision service is
running.
If you previously activated the polling for the property or the connection, or if
you changed the polling interval, this setting is kept. Otherwise Industrial
HiVision activates the polling and sets the polling interval to the minimum
value of 30 seconds.
Polling interval setting:
Minimum value: 30 seconds
Possible values: multiples of 30 seconds
Figure 69: Add property to reporting
294
References
8.2 Edit
8.2.28 Device and Port Signaling
The signaling function lets you to identify a device or port using the LEDs of
the device. When making new connections, this function allows you to verify
the proper device and port.
You can also activate the function using HiMobile.
Note: The HiMobile signaling function is available on devices with the
following software releases:
Device signaling is supported on Classic devices beginning with software
version 09.0.03.
Device signaling is supported on HiOS devices beginning with software
version 06.0.01.
Port signaling is supported on HiOS devices beginning with software
version 06.0.01.
Port signaling is only supported by HiSecOS devices beginning with
software version 03.0.01.
Connection signaling is supported on directly connected HiOS devices
beginning with software version 06.0.01.
Signaling devices and ports
To activate the signaling function on a device, proceed as follows:
Verify that Industrial HiVision is in the “Edit Mode“.
Double click on the device on which you wish to activate the signaling
function.
Open the “List“ tab.
Right click on the “Signaling“ entry.
Select “Properties“ from the pull down list.
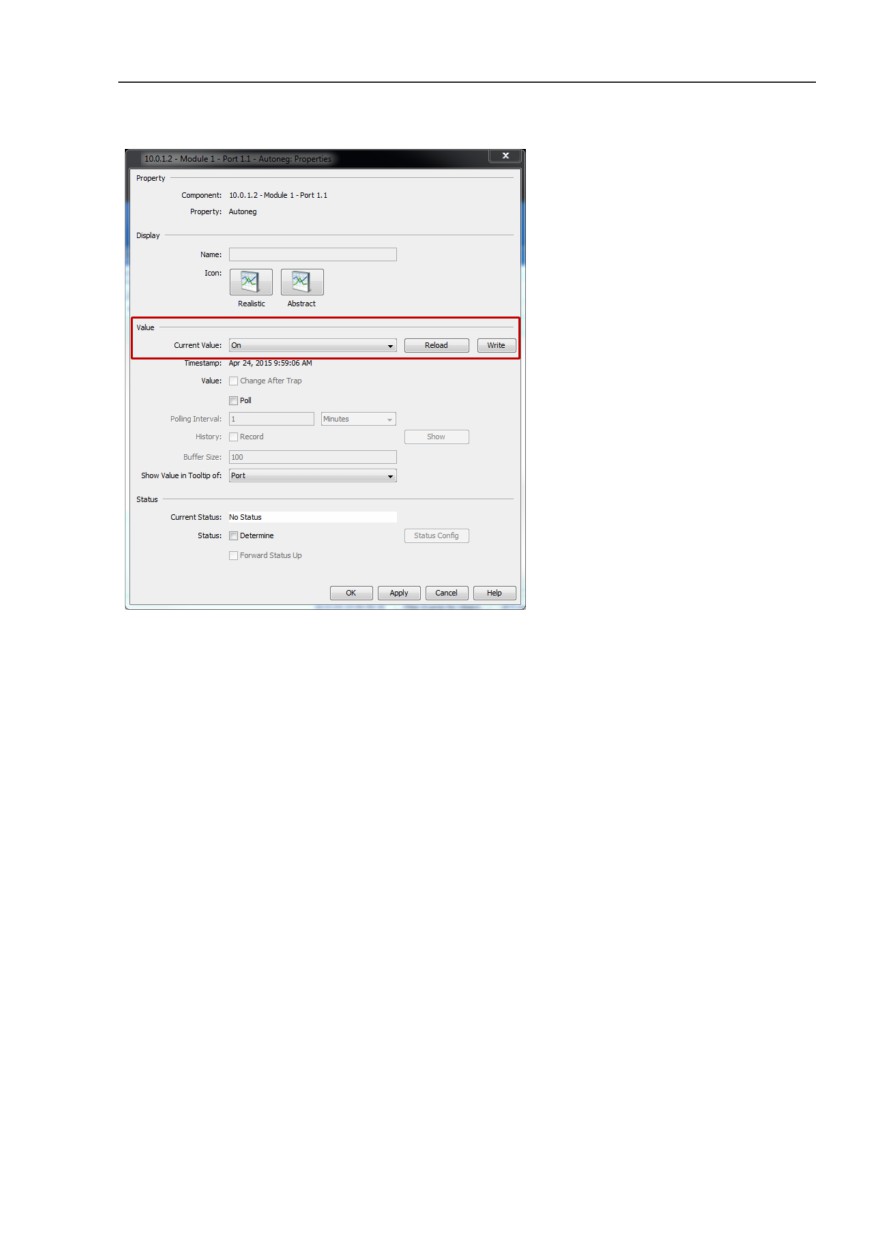
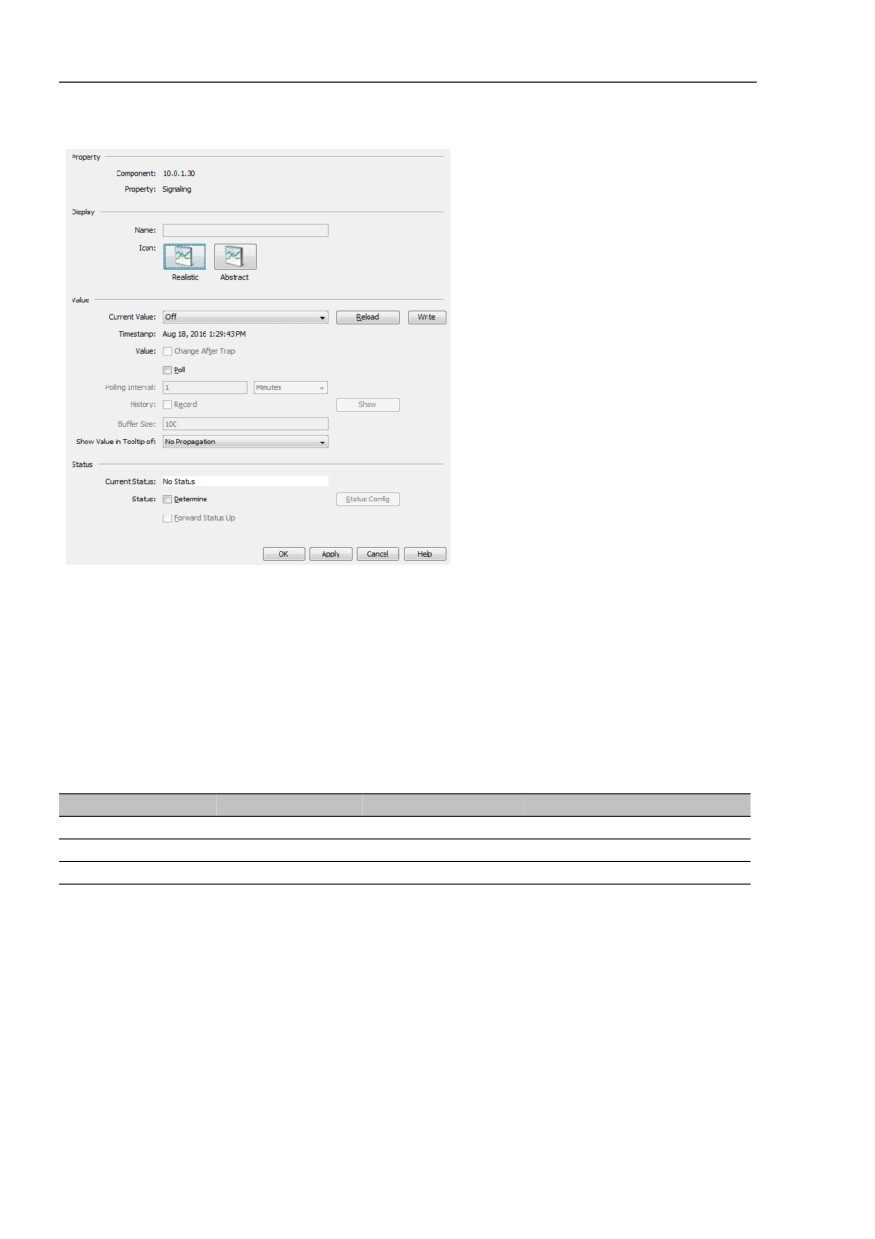
In the “Value“ frame, in the “Current Value“ pull down list, select the
“On“ option.
Click the “Write“ button.
The table in the “List“ tab displays the “Signaling“ function as “On“, and
the LEDs on the device blink for 10 seconds. After 10 seconds the entry
changes to “Off”.
The steps to activate the “Signaling“ function on a port are similar to the
steps described above. The only difference is that you highlight the port
for which you wish to activate the “Signaling“ function.
295
References
8.2 Edit
Figure 70: Signaling proprieties dialog
Signaling function support
The following list contains the devices and software versions that support
the Industrial HiVision “Signaling” function:
Type of device
Since Version
Device Signaling Port/Connection Signaling
Classic
09.0.01
X
HiOS
04.0.00
X
X
HiSecOS
03.0.00
X
Table 29: Signaling supported software
296
References
8.3 View
8.3
View
The “View“ menu contains functions to navigate through the history of the
content of the detail display frame.
8.3.1
Select VLAN
This function allows you to see the VLAN membership of the detected
devices and links based on the colors in which they are displayed.
Select View > Select VLAN.
Industrial HiVision opens a dialog for selecting a VLAN.
In the drop-down list, select the VLAN ID for the VLAN whose VLAN
membership you want to see.
Industrial HiVision displays the devices and links that belong to other
VLANs in light gray. The devices of the selected VLAN remain in color or
in dark gray.
At the top of the folder frame, Industrial HiVision displays the selected VLAN.
8.3.2
Refresh VLANs
This function allows you to refresh the VLAN information on the Hirschmann
devices.
To refresh the VLAN information select a node in the object frame.
On the menu bar, select View > Refresh VLANs.
Industrial HiVision refreshed the information in the subcomponents of the
selected node.
297

References
8.3 View
8.3.3
Protocol Statistics
The Protocol Statistics give you an overview of the response time behavior
of the devices with Industrial HiVision with regard to the protocol
communication. This overview helps you find out whether the response time
behavior is the cause if Industrial HiVision cannot set up the communication
with individual devices.
You can specify the number of samples from which Industrial HiVision
calculates the movable average response time for both ICMP and SNMP.
Open the Configuration > Preferences > Services dialog.
You can specify the number of ICMP samples using the “ICMP Statistics
- Moving Average Number of Samples“ parameter.
You can specify the number of SNMP samples using the “SNMP Statistics
- Moving Average Number of Samples“ parameter.
The dialog displays the moving average as 0 until Industrial HiVision
calculates the first average.
Parameter
Meaning
Device
IP address of the device to which the entries in this line apply
Protocol
Relevant protocol via which Industrial HiVision communicates with the
device
Requests
Number of requests from Industrial HiVision since the last reset
Responses
Number of responses from the device since the last reset
Timeouts
Number of cases in which the device required longer for a response than
was entered in the settings
Errors
Number of packets deviating from the standard
Msg Loss [%]
Pkt. loss [%] = packet loss [%] = 1-(replies/requests) * 100
Avg Resp [ms]
Average value of response times
MAvg Resp [ms]
Movable Average value of response times.
Min Resp [ms]
Minimum wait period for a response
Max Resp [ms]
Maximum response time for a reply
Std Dev
Standard deviation of the response times = measurement for the
variation
Try 1
Number of responses received after the first request attempt.
Depending on your settings in the SNMP configuration in Industrial
HiVision, Industrial HiVision creates columns with “Try“ 2, “Try“ 3, etc.
The “Try“ 2 column then only contains the number of responses received
after the 2nd request attempt.
Table 30: Log statistics
298
References
8.3 View
Industrial HiVision provides you with a portion of the protocol statistics as
detailed information for each device. You will find “Avg Resp [ms]“ and “Std
Dev“ in the log properties of a device.
You can use the reporting function to analyze the behavior of individual
devices more precisely. To do this, you add these log details in a report.
With “Export“ you can save the complete table as a:
PDF file
HTML file
CSV file (see on page 457 “CSV export”)
With “Print“ you can print the complete table. Industrial HiVision creates a
temporary PDF file of the content of the list and opens this PDF file in the PDF
display program, e.g. Acrobat Reader, that is installed on your management
station.
With “Reload“ you get Industrial HiVision to update the values in the tables of
this dialog.
With “Reset“ you get Industrial HiVision to reset the table values to “0”.
8.3.4
Filter Events for Object
With “Filter Events for Object“, you filter the events list based on the GUI
object selected. You have the possibility to filter events with these types of
objects:
• devices
• connections
• ports
• device properties
To filter events for object, proceed as follows:
Select the number of necessary objects, on the tab or tree view. When
you select at least one object, the “Filter Events for Object“ button
becomes active.
Click the “Filter Events for Object“ button.
299
References
8.3 View
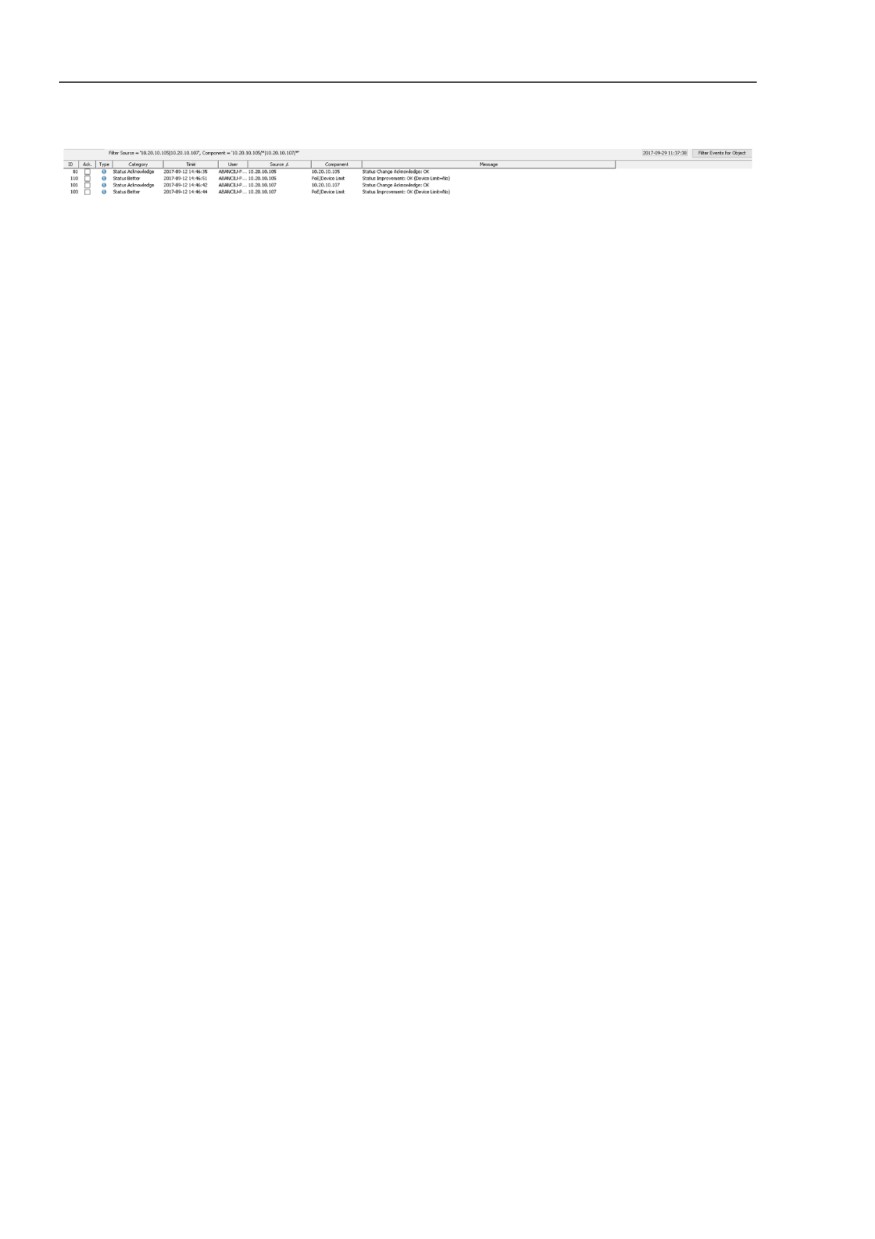
Figure 71: List generated with the "Filter Events for Objects" function
The event list displays the object-based filtered events. The “Filter“ section
on the event list info-bar displays information about the objects used for
filtering. Here are a few scenarios:
When you filter events based on a connection between two devices, the
“Filter“ section displays this information:
• IP addresses and labels, if the devices are renamed, of the connected
devices, in the “Source“ column
• Port number and label, in the “Component“ column
• Component path, if the port is part of a WLAN interface or a module, in
the “Component“ column.
When you filter events based on folders, the “Filter“ section displays this
information:
• IP addresses and labels, if the devices are renamed, of the devices in the
folder, in the “Source“ column.
Note: If you rename the property of a device, Industrial HiVision will search
only for the new label. The rule does not apply to the ports.
8.3.5
Back
You use “Back“ to return to the previous view of the detail display frame.
300
References
8.3 View
8.3.6
Forward
You use “Forward“ to go to the next view of the detail display frame.
8.3.7
Up
You use “Up“ to go to the next highest level of the detail display frame.
8.3.8
Home View
The “Home View“ button allows you to return the window size and detail view
parameters to the settings that you defined with the “Set Home View
Settings“ button.
The following parameters are permanent default settings:
VLAN “All“
Event Filter “Last 24 Hours Events“
Tab view “Map“
For an example of the function proceed as follows:
Click the “Home View“ button.
Note the parameter settings and window size.
Specify the VLAN to monitor VLAN 1 only.
Specify the window size as full screen.
Select a different folder in the menu tree.
Select a device in the “List“ tab.
Filter the events for “Unacknowledged Warnings & Errors“.
301
References
8.3 View
Industrial HiVision now displays the events for the selected settings in the full
screen mode. Industrial HiVision also displays the devices that are members
in VLAN 1 with the status color for each device. To reset the display to the
previously save configuration, click the “Home View“ button.
8.3.9
Set Home View Settings
The “Set Home View Settings“ function allows you specify the window size
and content of the detail view that Industrial HiVision displays when you click
the “Home View“ button.
For an example of the function proceed as follows:
Verify that the “Edit Mode“ is active.
Specify the view as you wish.
Industrial HiVision allows you to save the following settings:
- Specify a different folder in the menu tree.
- Specify a different screen size.
- Specify either the maximize or normal view.
Click the View > Set Home View Settings function.
You can also specify the settings in the Configuration > Preferences >
Display > Appearance > Home View Settings > Home Folder list (see on
page 362 “Appearance”).
8.3.10 Geographical Location View
Industrial HiVision allows you to display the location of a device on a map.
Right-click on a device in the detail view and select “Geographical
Location View“.
302
References
8.3 View
If you have met the following conditions, Industrial HiVision shows you the
location of the device on a map.
The coordinates are entered in the “Location Coordinates“ property of the
device.
See “Properties of a component detail” on page 283.
Under Configuration > Preferences > Advanced > External
Applications, the map display application for the URL is entered under
“Geographical Location View“.
See “External Applications” on page 392.
8.3.11 Zoom
Use “Zoom“ to increase the size of the display in the detail frame in steps
of 10 %.
303
References
8.4 Configuration
8.4
Configuration
8.4.1
Monitor
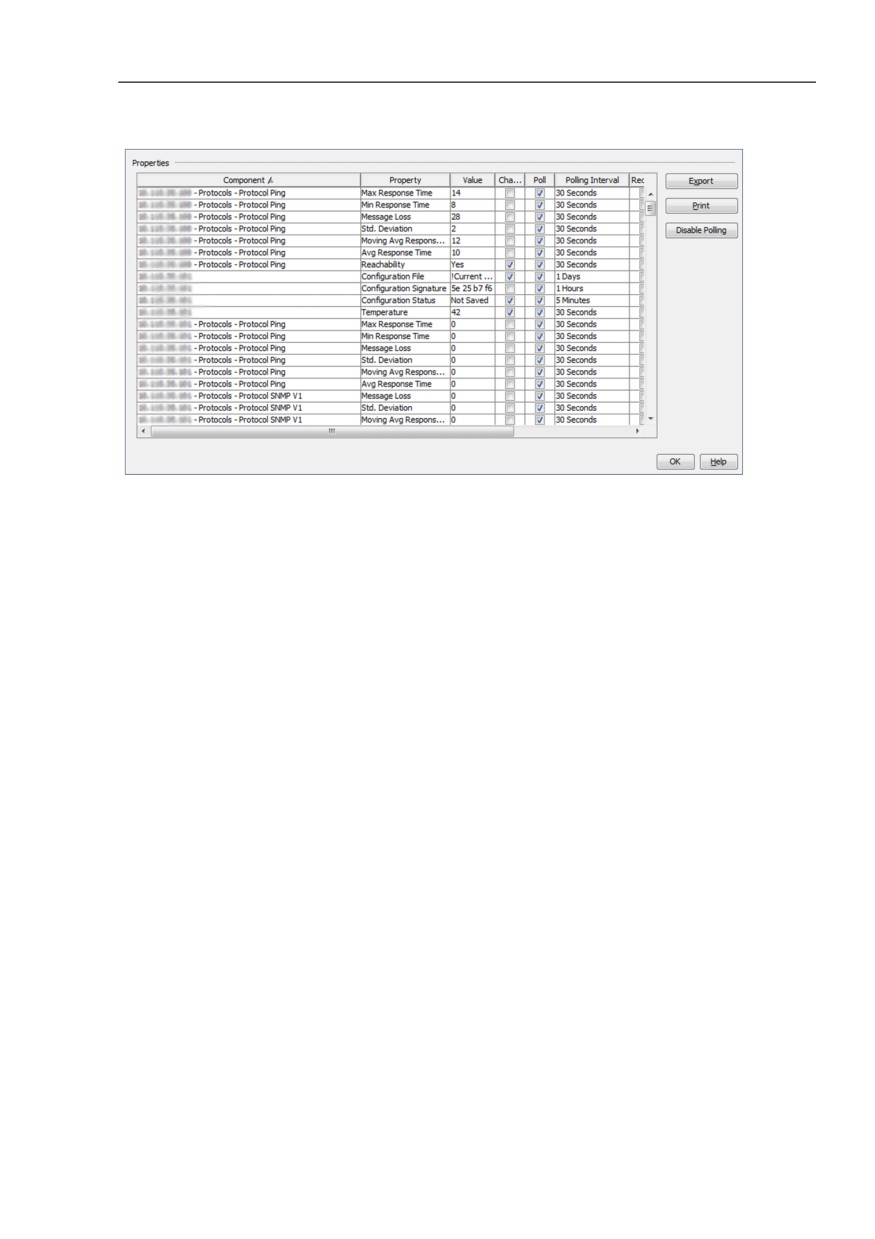
The “Monitor“ dialog lists in a table the monitoring functions for the
components currently being monitored:
Property
Value of the property
Take the value from an alarm message (trap) relating to this property
Query the value of this property periodically from the device
Query interval
Record history for this property
Size of the Ring memory for the history recording (number of entries)
Derive status of property from the value of the property
Propagate status to the next highest level
Double-click on a row in the table to edit the status configuration of the
property.
Note: Before you click the “Disable Polling“ button save your project
See “Save” on page 257. The button disables polling for the current
properties and deletes the list. The button also deactivates the default polling
function in the dialog Preferences > Default Polling.
304
References
8.4 Configuration
Figure 72: Configuration > Monitor
305
References
8.4 Configuration
8.4.2
PSM Manager
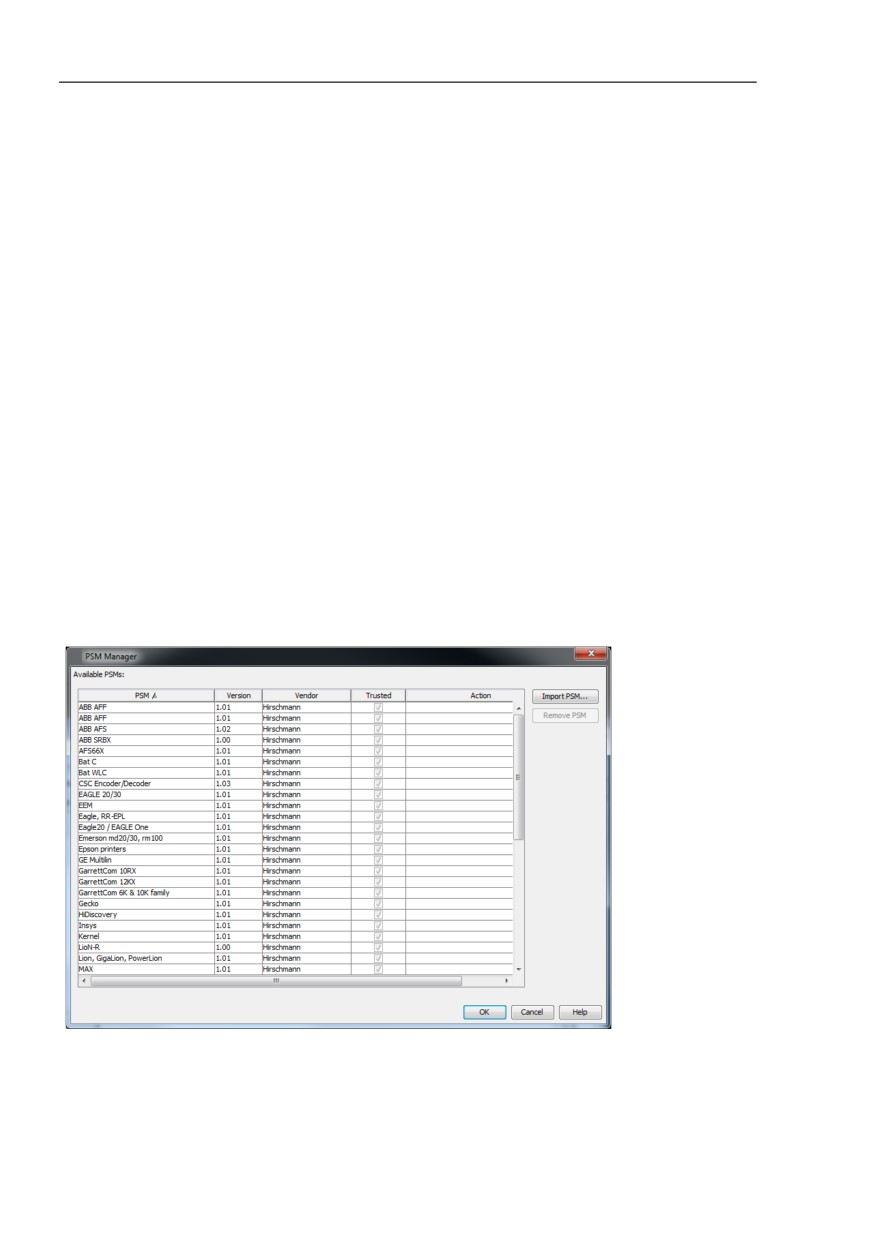
Product-Specific Modules (PSMs) describe the properties of a device which
Industrial HiVision can read for monitoring or write to for configuration.
The PSM Manager gives you the opportunity to update PSMs or import
additional PSMs beyond the ones included with delivery and remove them
again.
Industrial HiVision assigns the device class “Switch” to devices for which
Industrial HiVision has no PSM.
During import, Industrial HiVision compares the version of the PSM to be
imported with any existing PSM. If the PSM to be imported already exists,
Industrial HiVision opens a dialog. The dialog offers you the opportunity
to keep or overwrite an existing PSM.
Note: Industrial HiVision accepts the changes made after a restart of the
service.
Figure 73: Configuration > PSM Manager
306
References
8.4 Configuration
8.4.3
Reporting
The reporting function allows you to manage long-term statistics outside the
database of the network management system program.
Monitor
This table lists the properties that you selected for monitoring (see on
page 293 “Add to reporting”).
To change an entry in this table, select the entry and click the “Edit“
button.
To delete one or more entries in this table, select the entry or entries
and click the “Delete“ button.
If entries are contained in templates, Industrial HiVision refuses the
deletion of these entries.
Delete these entries in the template table so that you can delete the
entries in the monitoring table.
To check whether the entries are still valid, as they could have
changed during the editing in this dialog, click the “Refresh“ button.
An entry is valid if Industrial HiVision can access and query the
component.
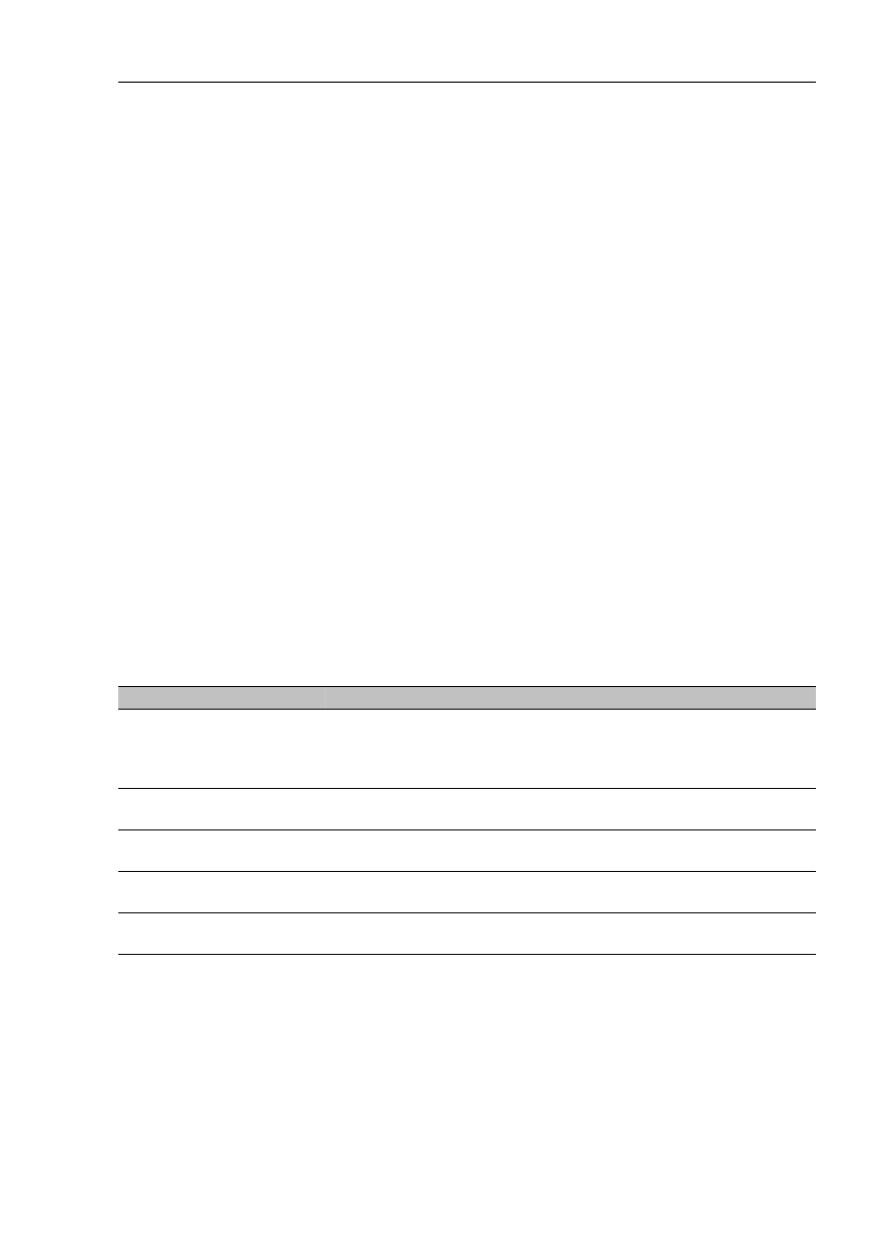
Parameter
Meaning
Record
Activate this entry.
If you close this dialog, then click “OK” or “Apply” in the “Monitor”
dialog, Industrial HiVision starts the recording according to the
settings below.
Recording > Start > Now If you close this dialog, then click “OK” or “Apply” in the “Monitor”
dialog, Industrial HiVision starts the recording.
Recording > Start > Time If you close this dialog, then click “OK” or “Apply” in the “Monitor”
dialog, Industrial HiVision starts the recording at this time.
Recording > Stop >
After the recording starts, Industrial HiVision continues the
Indefinite
recording indefinitely until this entry is deleted or changed.
Polling Interval
Time interval at which Industrial HiVision cyclically queries the
value from the device.
Table 31: Editing an entry in the monitoring table
Note: Industrial HiVision can record values as long as Hirschmann
Industrial HiVision 8.2 Service is active. When you stop Hirschmann
Industrial HiVision 8.2 Service, the recording also stops until Hirschmann
Industrial HiVision 8.2 Service is started again.
307
References
8.4 Configuration
Templates
This dialog allows you to define the format of reports.
Click the “New“ button to define a new template.
Click the “Edit“ button to change a template.
Click the “Delete“ button to delete one or more templates.
Click the “Display Report“ button to check how a template looks.
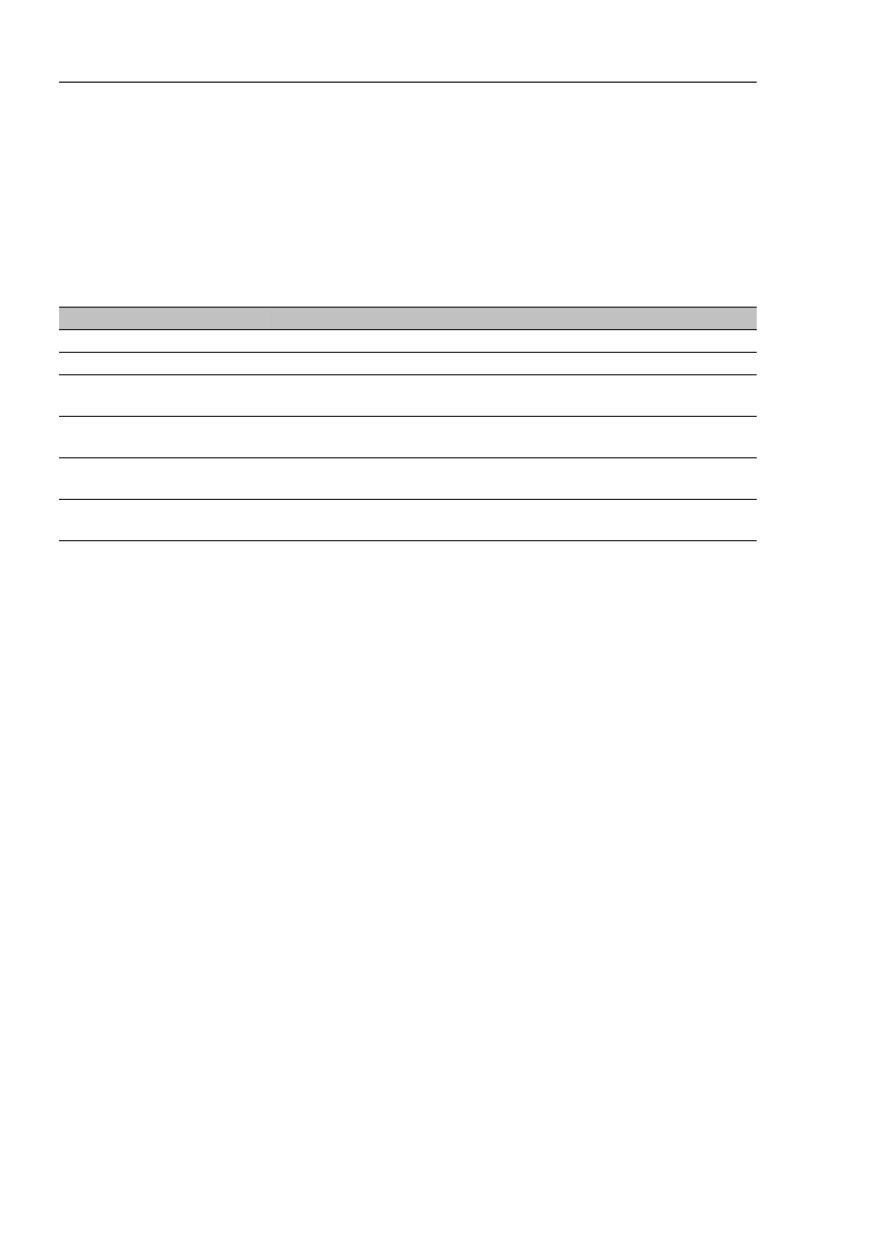
Parameter
Meaning
Report > Name
Name to identify this template.
Report > Title
Header that Industrial HiVision writes above the report.
Report Type > Type
Output format of the report.
Options: “PDF“, “Excel“
Report Type > Layout
Layout of the report.
Possible: “Chart“, “Table“
Report Type > Chart Type Options for layout of diagram.
Possible: “Line“ (for presenting numeric values), “Bar“
Data
Selection of properties that you previously added to the reporting
(see on page 293 “Add to reporting”)
Table 32: Defining a new template
To avoid gaps in line graphs, combine only properties with the same
polling intervals.
To improve the appearance of diagrams, Industrial HiVision fills the
gaps between the data with repetitions of the latest data. You can
recognize the values inserted for filling-out purposes in table reports
and Excel files by their grey color.
Scheduling
This dialog allows you to get Industrial HiVision to generate reports for
defined time periods.
Click the “New“ button to define a new time period.
Click the “Edit“ button to change a time period.
Click the “Delete“ button to delete one or more time periods.
308
References
8.4 Configuration
Industrial HiVision distinguishes between 3 different time period types:
- Absolute start and end times (“Absolute“)
- Absolute start and relative end times (“Relative Stop“)
- Relative start and end times (“Relative“)
Absolute start and end times (“Absolute“)
Industrial HiVision generates a report from the data that lies between
the start time and the end time.
Parameter
Meaning
Name
Industrial HiVision provides a selection of existing templates.
From
The first time this dialog is opened, Industrial HiVision displays the
time at which Industrial HiVision began recording the data for the
selected template. If the report to be generated should start with
data from a later point in time, you enter this time here.
Possible: Point in time after recording has started and before report
generation.
Until
End time of the reporting period.
Possible: Point in time after the start time.
Table 33: Scheduling with absolute start and end times
Absolute start and relative end times (“Relative Stop“)
Industrial HiVision generates several reports.
The report period begins at the same start time in each case.
The report period ends at a later time in each case and thus comprises
increasingly large periods.
Parameter
Meaning
Begin of report period
The first time this dialog is opened, Industrial HiVision displays the
time at which Industrial HiVision began recording the data for the
selected template. If the report to be generated should start with
data from a later point in time, you enter this time here.
Possible: Point in time after recording has started and before report
generation.
Offset to execution
Designates the relative end of the data to be included in the report.
The relative end of the data to be included in the report relates to
the time at which the report was generated.
The offset to execution is the amount of time between the relative
end of the data to be included in the report and the time at which
the report is generated.
Possible: Amount of time between the start of recording and the
first report generation.
Table 34: Scheduling with absolute start and relative stop times
309

References
8.4 Configuration
Parameter
Meaning
First Execution
Time at which Industrial HiVision is to generate the first report.
Schedule every
Amount of time between the generation of a report and the
generation of the following report.
Table 34: Scheduling with absolute start and relative stop times
Relative start and stop times (“Relative“)
Industrial HiVision generates several reports.
Each report starts after the end of the preceding report.
The reports contain data from successive periods of equal length.
Parameter
Meaning
Duration
With the duration you set the relative start of the data to be included
in the report.
Possible: Period smaller than the repetition interval minus the
offset between successive executions
Offset to execution
Designates the relative end of the data to be included in the report.
The relative end of the data to be included in the report relates to
the time at which the report was generated.
The offset to execution is the amount of time between the relative
end of the data to be included in the report and the time at which
the report is generated.
Possible: Amount of time between the start of recording and the
first report generation.
First Execution
Time at which Industrial HiVision is to generate the first report.
Schedule every
Amount of time between the generation of a report and the
generation of the following report.
Table 35: Scheduling with relative start and stop times
Generated reports
This dialog lists the generated reports. Industrial HiVision stores the
generated reports in the installation directory in the directory
\var\report_files.
To display a report, select the report and click the “View“ button.
To save a report, select the report and click the “Save“ button.
To delete one or more reports, select the reports and click the “Delete“
button.
To refresh the list, click the “Refresh“ button. After refreshing,
Industrial HiVision adds to the list those reports generated since the
last refresh.
310
References
8.4 Configuration
Industrial HiVision displays the path where Industrial HiVision stores the
reports below the table. For remote connections, the specified path refers
to the file system on which Hirschmann Industrial HiVision 8.2 Service is
running.
The data recorded by the reporting function are snapshots of a moment
in time. They represent the value of a property as saved by Industrial
HiVision at a particular point in time. Individual values have no bearing on
the values from other points in time.
8.4.4
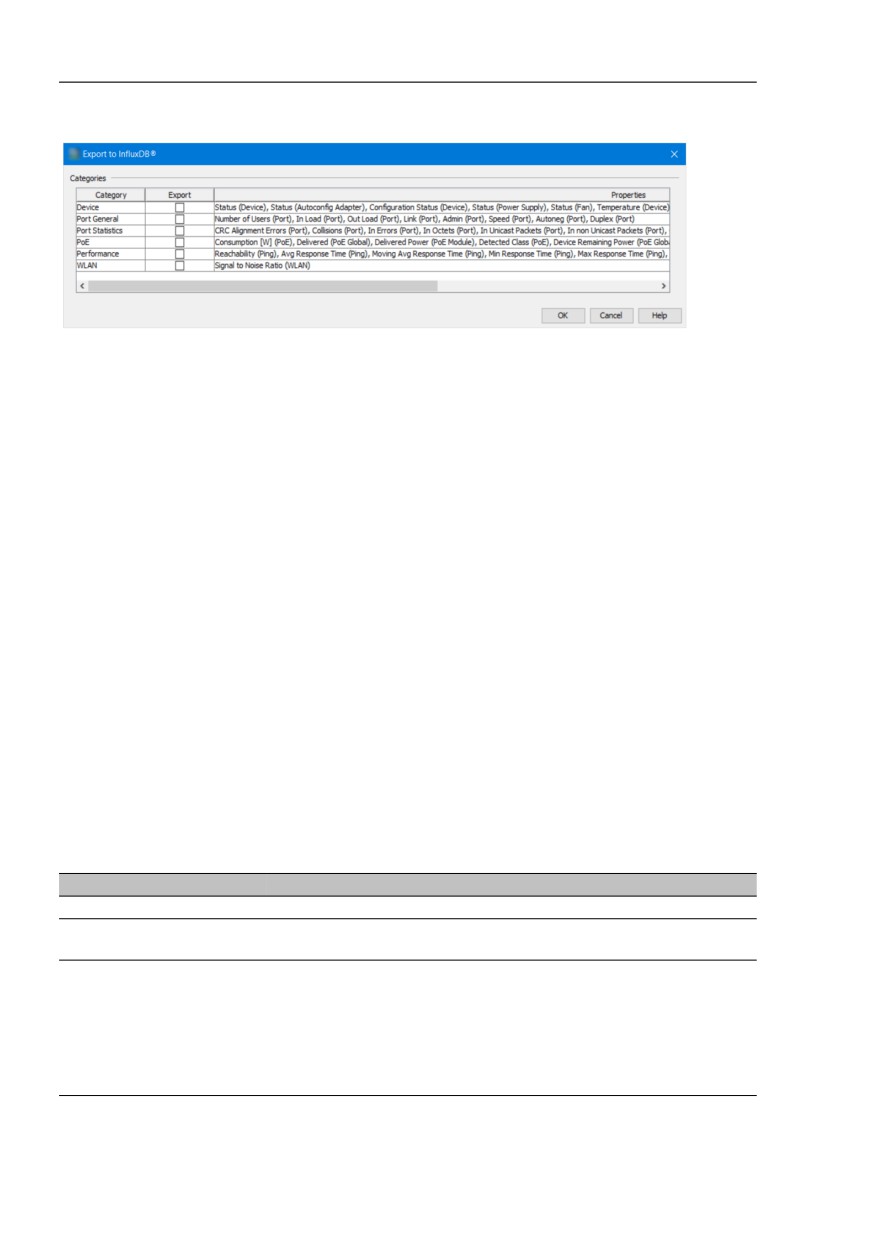
Export to InfluxDB®
The “Export to InfluxDB®“ dialog lets you configure the InfluxDB® server
export policy.
The “Categories“ table contains the properties that Industrial HiVision can
export to the InfluxDB® server. These properties are classified in different
categories.
To select the desired categories of properties, perform the following steps:
Mark the checkboxes related to the desired categories in the “Export“
column.
Default setting: unmarked
Note: You can only select a category of properties, and not an individual
property to be exported.
To accept the changes and close the window, click the “OK“ button.
Note: When you click the “OK“ button, Industrial HiVision starts the data
export to InfluxDB® independent of the export interval you set previously.
311
References
8.4 Configuration
Figure 74: Configuration > Export to InfluxDB®
8.4.5
Scheduler
The “Scheduler“ dialog offers the possibility of having repeating tasks of
Industrial HiVision carried out automatically.
Task
This table shows you already defined tasks that Industrial HiVision carries
out according to the stored schedule.
To define a new task, click the “New“ button.
To change a task, click the “Edit“ button.
To delete one or more tasks, click the “Delete“ button.
Parameter
Meaning
Task Name
Any name to identify this task.
Device
Selection of the device on which Industrial HiVision will run the
task.
Task Type
Industrial HiVision makes the following types of tasks available:
“Standard“
“Advanced“
“Save Device Configuration“
“Save Project“
Depending on the selection, the subsequent part of this dialog
changes.
Table 36: Defining new tasks
312

References
8.4 Configuration
Parameter
Meaning
Standard
Standard belongs to task type SNMP action.
As SNMP actions, Industrial HiVision offers the following actions:
- Switching a port on/off
- Switching the PoE voltage of a port on/off
After you have selected the action, the table below provides the
port selection of the device and the corresponding parameter (On/
Off).
Advanced
Advanced belongs to the task type script action.
As script actions, Industrial HiVision offers the following actions:
- Cisco: show running config
- Cisco: show running config all
- HiOS: show running config
- HiOS: show running config all
Under Executable you have the option to use the built-in Telnet
client for executing the action, or you can select your own program
with parameter transfer.
Save Device Configuration
The option allows you to schedule saving device configurations.
You can select multiple devices, then specify the path and rules for
saving the files.
Save Project
Use the option to schedule a task to save the project database to
a location of your chose.
The database contains the following device information:
- The location of the devices as displayed in the “Map“ tab
- The device connections as displayed in the “Map“ tab
- The device credentials
- The Industrial HiVision device status configuration
Table 36: Defining new tasks
Scripts
The “Scripts“ dialog offers you the opportunity to add your own scripts to
the selection of scripted actions.
To define a new script, click the “New“ button.
To change or import a script, click the “Edit“ button.
To delete one or more scripts, click the “Delete“ button.
To duplicate a script, click the “Duplicate“ button.
Parameter
Meaning
Script Name
Any name to identify this script.
Content
Import script or enter script as text.
Table 37: Define new scripts
313
References
8.4 Configuration
Note: Industrial HiVision uses Telnet or SSH sessions to run scripts on a
device. After a successful login, the session waits for a specific output
from the device. Wireless devices do not send the output which results in
a timeout. To work around this behavior, you can schedule Industrial
HiVision to open a command-line tool for example, Putty and then run
your script.
Schedules
The “Schedules“ dialog offers you the opportunity to define a schedule for
carrying out a task.
To define a new task, click the “New“ button.
To change a task, click the “Edit“ button.
To delete one or more tasks, click the “Delete“ button.
Parameter
Meaning
Task Name
List of defined tasks for selection in the “Tasks“ dialog.
Execution
Type of execution: once or several times with entry of the start date
and repeat interval for repeated execution.
Repetition
Entry of the repetition conditions for repeated execution: Number
of repetitions, end date.
Table 38: Define a new schedule
Note: You can only schedule 1 task for a device.
Results
The “Results“ table lists the results of the executed tasks.
To view a marked result, click the “View“ button.
To delete a result, click the “Delete“ button.
To refresh the results list, click the “Refresh“ button.
314
References
8.4 Configuration
Example of Scheduling an Event for a Single Device
This example demonstrates how to schedule an event to save a device
configuration. If Industrial HiVision detects an error during the
configuration saving process, then the detected error is entered in a log.
Industrial HiVision saves the log file in the following location:
\log\services\HiVisionKernelDb.0.stderr.log.
Note: If the “Save Device Configuration“ task fails during device
configuration retrieval, then proceed as follows:
Verify that Industrial HiVision can reach the selected device.
Verify that the protocols, SNMP and HTTP or HTTPS, are active on the
device.
Verify that Industrial HiVision has administration rights for SNMP,
HTTP, and HTTPS on the selected device.
Verify that the selected device supports the “Save configuration to
PC”, or “Export configuration” functions.
To schedule an event in Industrial HiVision for saving the configuration file
for a single device, proceed as follows:
Open Industrial HiVision.
Verify that the “Edit Mode“ is active.
To open the “Scheduler“ dialog, click Configuration > Scheduler.
The following work steps pertain to the “Tasks“ tab:
To open the “New Entry“ dialog, click the “New“ button.
Enter a name that describes the event for example, “Save Device
Configuration“.
Select a device from the “Device“ list.
In the “Task Type“ field, select the “Save Device Configuration“ option
from the drop down list.
When the selected device supports the function the fields in the “Save
Config“ frame are active. In the “Save Config“ frame, enter the
appropriate information in the following fields:
- In the “Destination folder“, enter or browse to the location where
you wish to save the configuration.
- Industrial HiVision enters IP_Address in the “File name“ field.
- The “On multiple task execution“ field allows you to select how
Industrial HiVision handles multiple files. To maintain a history of
the configuration changes, select “Add timestamp to target file
name“.
315