Network Management System Industrial HiVision 8.2. User Manual (2021) - page 8

Monitoring the network
7.8 Effect on system resources
7.8.1
Detecting utilization of system resources
Polling operations and history records are the main activities that affect your
system resources.
In extreme cases, when you change such settings you can see that your
system has slowed down.
In other cases, you require objective indicators to back up your subjective
perception. You can find these indicators in Help > Kernel Info > Polling.
Indicator
Meaning
Number of polled
Displays the number of properties for which polling is activated.
properties
This display takes into account the devices (see on page 267
“Manage”) monitored by Industrial HiVision and their properties.
Number of properties
Displays the number of properties for which the history recording is
recording history
activated.
This display takes into account the devices (see on page 267
“Manage”) monitored by Industrial HiVision and their properties.
Polling operations per
Industrial HiVision sums up the properties for which polling is activated
minute
and relates the total to the polling interval. As some polling intervals are
greater than 1 minute, the number of polling operations can exceed
this calculated value within the last minute.
This display takes into account the devices (see on page 267
“Manage”) monitored by Industrial HiVision and their properties.
Polling operations in
Displays the number of polling operations performed in the last minute.
the last minute
This display takes into account the devices (see on page 267
“Manage”) monitored by Industrial HiVision and their properties.
Total number of history
Displays the number of entries saved by Industrial HiVision (see on
entries set
page 215 “Protocol Configuration”).
Total number of actual
Displays the number of entries actually saved by Industrial HiVision.
history entries
Table 21: Indicators for system resource utilization in the kernel info
223
Monitoring the network
7.8 Effect on system resources
7.8.2
Influencing utilization of system resources
You have the most influence on the utilization of your system resources by
using the settings for polling operations and history recording. You can see
for which properties you have currently activated the polling or the history
recording in the “Monitor“ dialog (see on page 304 “Monitor”).
To keep the utilization of your system resources as low as possible, note the
following points:
Every property that you have activated in Industrial HiVision for periodic
querying creates a load on your network management station and
increases the network traffic.
Check which properties you really want to monitor.
Check which query frequency you require for this monitoring.
Every history entry creates a load on your network management station
and uses up the free memory space on your network management
station.
Check which properties you really want to record.
Check which buffer size you require.
The MultiConfig™ function allows you to set up statistic counters on
multiple devices at the same time. By setting up statistic counters, you
activate the polling and recording operations.
Before you use the MultiConfig™ function, verify what effect the
settings has on your system resources.
Many events increase the memory requirement, the program start time
and the start time of the event filter dialog.
For a sufficient performance of your network management station, consider
the following additional factors:
Network range
Number of nodes
Complexity of the node management
Network load
Computer resources of your network management station
Memory size (RAM and hard drive) of your network management station
224
Monitoring the network
7.8 Effect on system resources
7.8.3
Minimizing polling
Industrial HiVision gives you the option of adjusting polling gradually to your
requirements. You can change the polling interval and also determine which
properties are to be queried by Industrial HiVision.
Changing the polling interval for the properties of several
devices
The table (see on page 455 “Monitored properties in the basic setting”)
displays which properties Industrial HiVision monitors with the basic
polling setting.
To reduce the polling volume from temperature monitoring for the devices
in the detail display, proceed as follows:
Select the “Properties“ tab in the detail display.
In the “Device Class:“ drop-down list, select “All“
In the “Property:“ drop-down list, select "Temperature (Device)".
Select every device in the table with “Ctrl”+“a”.
Right-click on a device and select MultiConfig™.
In the function frame of the MultiConfig™ dialog, select “Property
Properties“.
In the “Polling Interval“ text box, enter 15 minutes.
To save the change in Industrial HiVision, click the “Write“ button.
You can also turn off polling completely in the same way.
Turning off polling for connection properties
With the default value, Industrial HiVision polls the network load every 30
seconds.
To turn off network load polling, proceed as follows:
Select the “Connections“ tab in the detail display.
Select every connection in the table with “Ctrl”+“a”.
Right-click on a connection and select MultiConfig™.
In the function frame of the MultiConfig™ dialog, select “Connection
Properties“.
In the function frame of the MultiConfig™ dialog, unmark the
Monitor > Polling > Load checkbox.
To save the change in Industrial HiVision, click the “Write“ button.
225
Monitoring the network
7.8 Effect on system resources
7.8.4
Minimizing network load
Industrial HiVision gives you the option of reducing the network load caused
by the device detection.
Select Configuration > Preferences > Advanced > Service
Parameters.
Under “Device Discovery“, reduce the “Scan Rate [devices/min]“.
Under “Device Discovery“, reduce the value for “Simultaneously
Discovered Devices“.
226
Monitoring the network
7.9 Process visualization systems
7.9
Process visualization
systems
7.9.1
Link to process visualization system
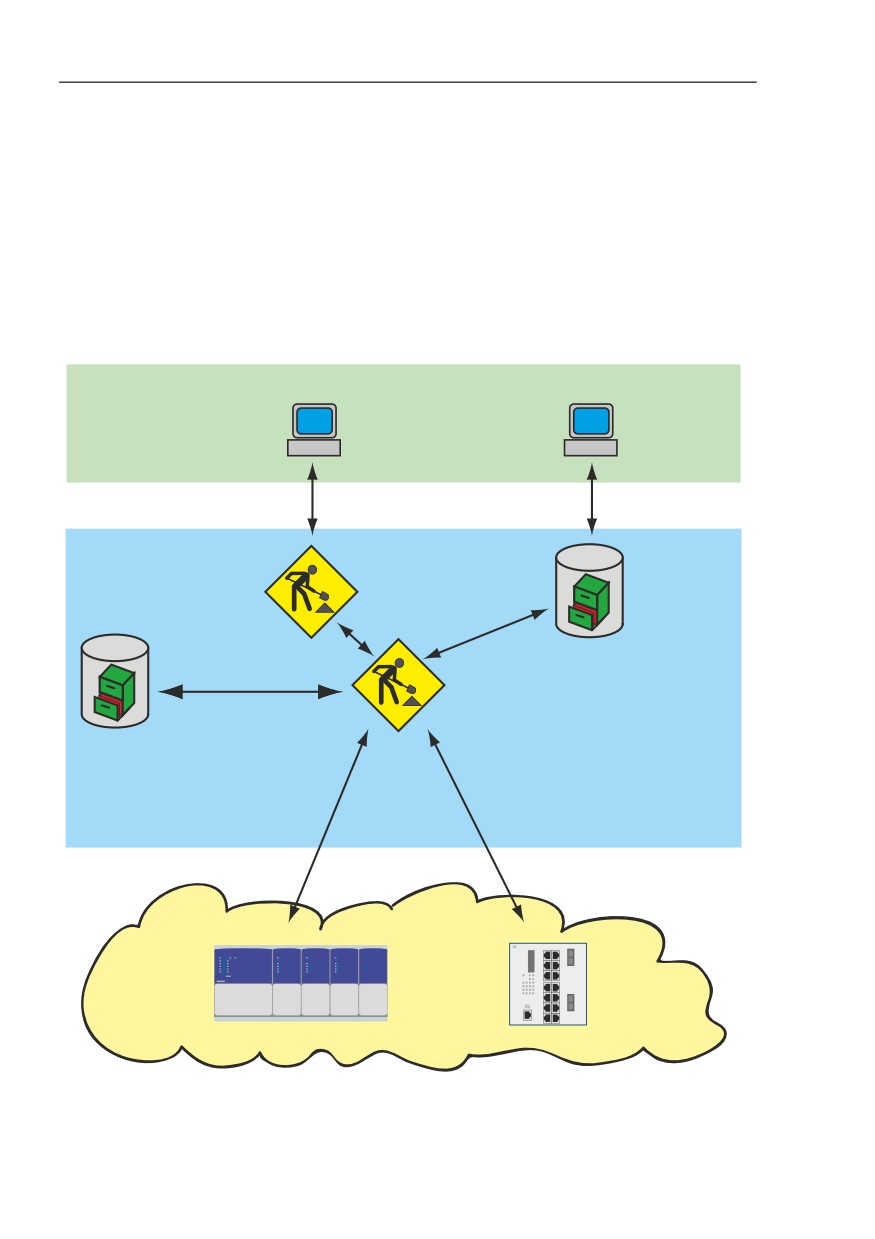
As an interface to process visualization systems (SCADA, Supervisory
Control and Data Acquisition) Industrial HiVision contains OPC services and
an ActiveX control element on Windows operating systems.
A process visualization system can use the ActiveX control element to
graphically represent data from Industrial HiVision.
If the Hirschmann Industrial HiVision 8.2 Service is active, then the OPC
services can read data from Industrial HiVision and make it available to the
process visualization systems. The OPC services can also write data in
Industrial HiVision. The OPC services support Data Access V1 to V3 and
OPC Unified Architecture for communication purposes.
OPC DA is based on the Distributed Component Object Model (DCOM)
protocol from Microsoft. DCOM is designed as a transport protocol on
multiple layers for example, on the HTTP Internet protocol. Thus DCOM
supports direct communication between software components through the
LAN.
Windows 2008 R2, Windows Server 2012 R2 support DCOM. For further
information on DCOM, visit the Microsoft website.
Activate the DCOM protocol and the remote access to the network
management station, in order that an OPC client has remote access to the
OPC server.
OPC UA is an XML-based, operating-system-independent protocol.
Initial setting for the Industrial HiVision OPC server service: OPC UA Server
is set as the default server and the server is active (see on page 373
“Services Access”).
227
Monitoring the network
7.9 Process visualization systems
Note: If you activate the Industrial HiVision OPC server service, an OPC
client uses the OPC service and Industrial HiVision with write permission to
access devices managed by Industrial HiVision.
To deactivate the write permission, open the Configuration >
Preferences > Advanced > Services Access dialog, in the “OPC Server“
frame, unmark the “Global Write“ checkbox.
ActiveX Client
OPC Client
SCADA System
ActiveX
OPC-Server
read/write
Services
Database
Trap
Ping
EtherNet/IP
HiDiscovery
SNMP-Get/Set
Industrial HiVision
HIRSCHMANN
h H
h H
h H
h H
h H
Figure 49: Link to process visualization system
228

Monitoring the network
7.9 Process visualization systems
7.9.2
Structure of the transfer data for OPC
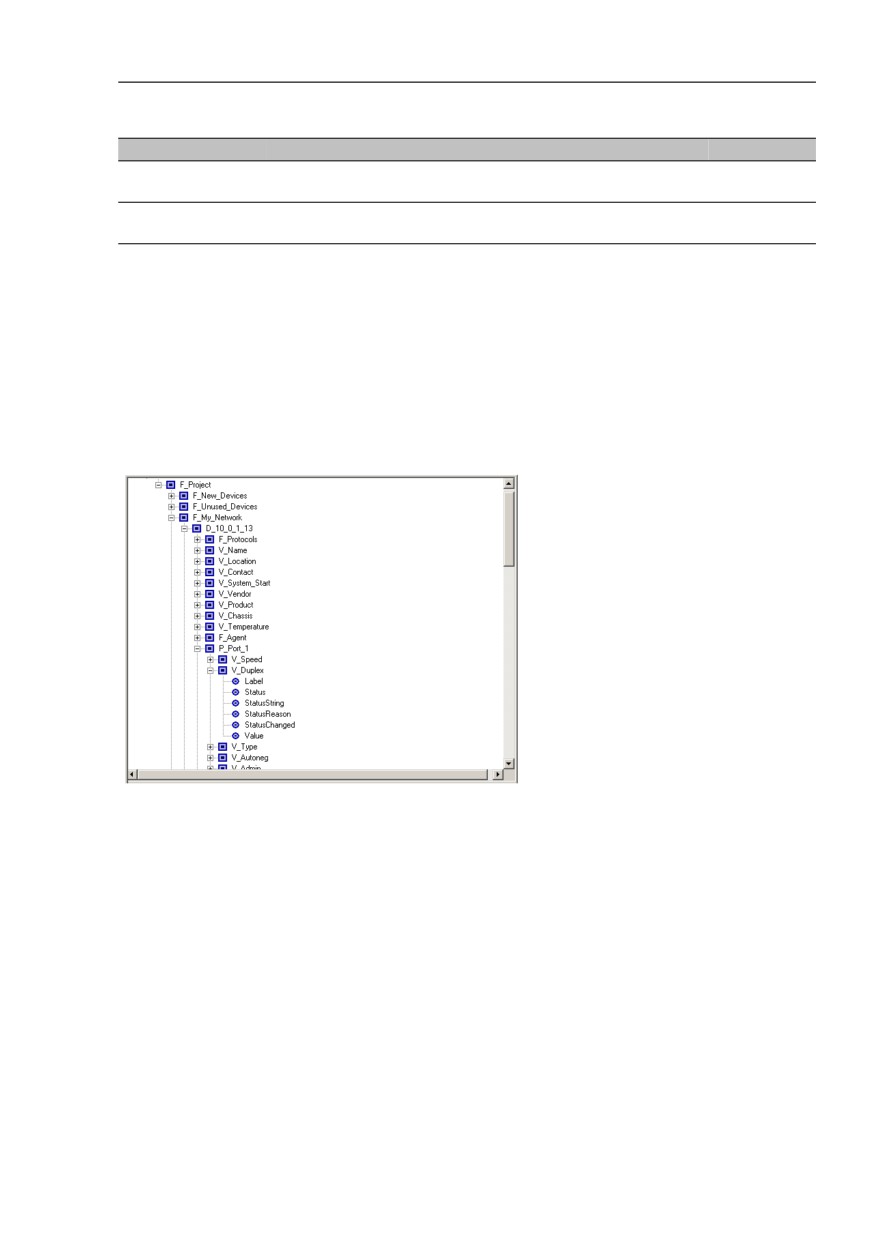
The Industrial HiVision OPC server maps the data to be transferred in the
same tree structure in which Industrial HiVision represents it in the folder
frame. The individual elements and their values are known as tags. To
indicate the hierarchy, Industrial HiVision uses prefixes which Industrial
HiVision puts before the tag name. The tag names correspond to the names
of Industrial HiVision in the English language version.
Changing the names in Industrial HiVision has the effect that OPC clients
cannot access the tags any more. The same applies to moving components
into other folders.
Note: If you intend to move components regularly, you can put a link to the
components in your own folder (e.g. Folder/OPC) and access the link using
OPC. This method can be useful if your process visualization system has a
length restriction for the tag name.
Prefix Type of component
C_
Link
D_
Device
F_
Folder
L_
Link
P_
Port
V_
Device detail
Table 22: Tag name for OPC
229

Monitoring the network
7.9 Process visualization systems
For device names, Industrial HiVision represents the IP addresses with dots
instead of underscores. The Industrial HiVision OPC server replaces dots
and spaces with underscores.
Every node/folder in the structure consists of 5 tags, with the exception of
devices, device details and links.
A device also has the “Managed” tag.
A device detail also has the “Value” tag.
A link also has the “ConnectionState”, “Utilization_AB” and “Utilization_BA”
tags.
Tag name
Meaning
Component
Label
Name of the component, as displayed by the program
all
interface.
Security status
Current status as numerical value.
all
0=No Status,
1=Unavailable,
2=Ok,
3=Warning,
4=Error
Status
Current status as numerical value.
all
0=No Status,
1=Unavailable,
2=Ok,
3=Warning,
4=Error
StatusString
Current status as readable (English) text for example, "OK",
all
"Error"
StatusReason
List of all the reasons that contribute to the status of the
all
component, in readable (English) text form.
StatusChanged
Shows whether the status of the object is unconfirmed.
all
0=Confirmed
1=Unconfirmed
You can use OPC to set the value to "0".
Managed
Shows whether Industrial HiVision is monitoring the device. Device
Value
Current value of the component detail.
Device detail
ConnectionState
Link status, as displayed by the program interface through
Link
line representation:
1=Unavailable
2=Active (unbroken line)
3=Standby (dotted line)
4=Inactive (chain line)
Table 23: Available tags
230
Monitoring the network
7.9 Process visualization systems
Tag name
Meaning
Component
Utilization_AB
Load on the line from the first terminal point to the second
Link
terminal point (sequence as represented in the OPC tree).
Utilization_BA
Load on the line from the second terminal point to the first
Link
terminal point (sequence as represented in the OPC tree).
Table 23: Available tags
Note: The OPC server from Industrial HiVision supports the querying of up
to 3000 OPC tags.
Figure 50: Example of the representation as an OPC tree structure
231
Monitoring the network
7.9 Process visualization systems
7.9.3
Connection as ActiveX control element
To connect Industrial HiVision to a process visualization system, you require
the ActiveX control element, which you can optionally install with Industrial
HiVision.
During the installation of Industrial HiVision with the ActiveX control element,
the installation program registers the ActiveX control element in the Windows
operating system.
Incorporate the ActiveX control element “HiVisionAxControl Control” into
your process visualization system.
The ActiveX control element requires a link to the Industrial HiVision service.
By transferring the parameters to your process visualization system, you
create the link to the Industrial HiVision service. Under
Object:Properties, you enter the name or the IP address of the
computer on which the Industrial HiVision service is running. If the
Industrial HiVision service is running on the local computer, you enter
localhost.
You can now operate Industrial HiVision in “running mode” on the interface
of your process visualization system (see on page 84 “Edit Mode”).
232

Monitoring the network
7.9 Process visualization systems
7.9.4
Supported applications for ActiveX
Hirschmann has tested Industrial HiVision with the following applications:
Software
Version
Manufacturer
Microsoft ActiveX Container
-
Microsoft Corporation
Internet Explorer
6.0
Microsoft Corporation
7.9.5
Supported applications OPC DA
Hirschmann has tested Industrial HiVision with the following applications:
Software
Version
Manufacturer
RS View 32
7.20.00
Rockwell Automation
Genesis 32
8.00.138.00
Iconics, Inc
Simatic WinCC
6.0
Siemens AG
Citect SCADA
6.0
Citect Corporation
Softing OPC Demo Client
4.10 Built 512
Softing AG
7.9.6
Supported applications OPC UA
To connect a SCADA client with the Industrial HiVision OPC UA server, the
SCADA client requires the following URL:
opc.tcp://<IP-ADDRESS>:11196/OPCUA/HiVisionUaServer
233

Monitoring the network
7.9 Process visualization systems
You can find the OPC UA Server Port in the Preferences > Advanced >
Services Access dialog.
Hirschmann has tested Industrial HiVision with the following applications:
Software
Version
Manufacturer
Ignition
7.9.6
Inductive Automation
Prosys
2.3.3-170
Prosys OPC
UaExpert
1.03.0.201
Unified Automation
7.9.7
OPC UA Connection Example
The OPC UA server is active in the default setting. To verify that the OPC UA
server is active, open the Preferences > Advanced > Services Access
dialog. The “Services Access“ dialog also displays which OPC server type is
installed.
If you wish to change the OPC server type, then proceed as follows:
The following work steps are only applicable to version 6.0 and 7.0.
If you have the Industrial HiVision service running, then stop the service.
Open the Windows Control Panel> Programs and Features dialog.
Highlight the Industrial HiVision program and select the Change option.
In the Industrial HiVision maintenance dialog, select the Modify option
and click the Next button.
In the Select Components dialog, mark the desired OPC service
checkbox.
Verify that you have only one checkbox marked, then click the Next
button.
In the Setup Needs The Next Disk dialog, click the Browse... button.
On the installation disk, navigate to the folder that contains the file named
data2.cab and click the OK button.
In the InstallShield Wizard Complete dialog, mark the desired
checkboxes and click the Finish button.
234
Monitoring the network
7.9 Process visualization systems
If your Industrial HiVision version is 7.1 or later, Industrial HiVision requires
a re-installation.
Make a backup of your database before you begin the re-installation.
Deinstall Industrial HiVision.
In the Attendant question dialog, click the No button. If you click the No
button, then Industrial HiVision keeps the installation folder which
contains your database, PSMs and license files.
Re-install Industrial HiVision.
In the Select Components dialog, mark the desired OPC service
checkbox.
This example explains how to connect the Industrial HiVision OPC UA server
to an Inductive Automation Ignition OPC UA client. The prerequisite for
this example is that the OPC UA server and client are installed on the same
PC.
Install and open the OPC UA client software.
In the Ignition Gateway Control Utility> Port field, enter the value
8088.
Restart the gateway.
In the Ignition Gateway Control Utility dialog, click the Start the
Ignition Service button.
In the Message dialog, click the OK button.
In the Ignition Gateway Control Utility dialog, select the Go to
webpage option.
In the Ignition localhost dialog, select the Configure option.
In the Sign In dialog, enter the default sign in credentials:
User name = admin, Password = password
In the Configuration dialog, select the OPC Connections> Servers
option.
In the OPC Server Connections dialog, select the Create new OPC
Server Connection... option.
In the Add OPC Server Connection Step 1: Choose Type dialog, select
the OPC UA option.
In the Discover OPC-UA Endpoints dialog, enter the following URL:
opc.tcp://127.0.0.1:11196/OPCUA/HiVisionUaServer
During the discovery process Industrial HiVision saves the Ignition
certificate in the installation directory under services\PKI\CA\rejected.
If you wish to use a secure connection, then cut the certificate from the
rejected directory and paste it in the services\PKI\CA\cert directory.
The Discover OPC-UA Endpoints dialog now displays various options.
To use a secure connection, select the SecurityPolicy:
Basic128Rsa15, MessageSecurity: SignAndEncrypt option.
235
Monitoring the network
7.9 Process visualization systems
In the New OpcUaConnectionSettings> Main frame, enter a meaningful
name and description. You can edit the parameters after the configuration
is done.
Click the Create new OPC Server Connection button.
The OPC Server Connections dialog opens and displays the new server
with the status.
You are now ready to configure the Ignition Designer dashboard.
7.9.8
OPC UA Server Custom Certificates
The Industrial HiVision OPC UA installation functions in accordance with the
Tier 2, Server Authentication OPC UA specifications. Industrial HiVision
provides an OPC UA server that uses CA certificates for server identity. The
OPC UA clients then can trust the connection to the server. The syntax of
these certificates conform to the X509 specification.
The OPC UA server uses the following types of certificates for identification:
a Certification Authority (CA) certificate, which you can use for signing
certificates in a corporate environment for example,
HirschmannSampleCA
an application identity certificate, which identifies the OPC UA server for
example, HiVisionUaServer
an HTTPS certificate, which identifies the OPC UA HTTPS server for
example, HiVisionUaServer_https
Each CA certificate contains the following files:
a private key using the .der format
a public key using the .pem format
When the OPC UA server starts, the server verifies that the certificates are
present in the installation subdirectory. If the certificates are missing, then the
server creates the default certificates.
236
Monitoring the network
7.9 Process visualization systems
Note: The CA certificates are located in the services/PKI/CA/private
Industrial HiVision installation subdirectory. The CA certificates are highly
sensitive data. Safeguard the subdirectory against unauthorized read or write
access.
The OPC UA server configuration file, server.properties.xml, is located
in the lib/opcua/config/ subdirectory. The configuration file contains the
following parameters that control the behavior of the server with respect to
certificate handling:
OpcUaServer.issuer.name: is the base file name of the CA certificate.
The default base file name is HirschmannSampleCA. If the CA certificate
does not exist, the server creates the certificate with the specified file
name, and uses the default base file name as the issuer name.
OpcUaServer.private.password: this is the password that the server
uses to encrypt or decrypt the private keys of the certificates. The default
password is opcua. If you change the password, then verify that you use
the new password for every certificate that you create. Replace or
recreate existing certificates based on the obsolete password.
Note: The private key password is highly sensitive data. Safeguard the
configuration file, server.properties.xml, against unauthorized read or
write access.
Default Certificates
If there is no specific requirement regarding certificates, then the server
uses the default CA certificates and values in the installation bundle to
create self-signed certificates. The client then imports or trusts the self-
signed certificates.
237
Monitoring the network
7.9 Process visualization systems
Corporate CA Certificates
If an organization issues a corporate CA certificate to sign the certificates,
then you can use the corporate CA certificate with the OPC UA server. To
use the corporate CA certificates with the OPC UA server, proceed as
follows:
Delete the certificates located in the services/PKI/CA/private
subdirectory.
Convert your CA certificates to the .pem and .der formats, and copy
the certificates to the services/PKI/CA/private subdirectory.
Open the server.properties file.
Enter the base name of the corporate CA certificate files on the
OpcUaServer.issuer.name line.
Enter the password of the private key on the
OpcUaServer.private.password line.
- If you do not use a password, then use an empty string.
When the OPC UA server starts for the first time, the server creates an
application identity certificate and an HTTPS certificate based on the
corporate CA certificate.
Application Identity Certificates
If you have a certificate that either your organization, or a trusted authority
has created for you, then you can use the certificate as the application
identity certification for the HTTPS server. To use the application identity
certification with the OPC UA server, proceed as follows:
Delete the certificates in the services/PKI/CA/private subdirectory.
Convert your certificates to the .pem and .der formats. Copy the
certificates to the services/PKI/CA/private subdirectory.
- Set the base filename to HiVisionUaServer for the application
identity certificate.
- Change the HTTPS certificate, to HiVisionUaServer_http.
Open the server.properties file.
Enter the password of the private key in the
OpcUaServer.private.password line.
- If you do not use a password, then use an empty string.
When the OPC UA server starts for the first time, the server creates a CA
certificate. The CA certificate created during startup certificate is not used
in this situation. The OPC UA server also creates any other missing
certificates.
238
Monitoring the network
7.10 Remote access to Industrial
HiVision
7.10 Remote access to Industrial
HiVision
7.10.1 Web access to Industrial HiVision
Industrial HiVision allows you to access the Web server of Industrial HiVision
with a browser using the HTTP or HTTPS protocol. We recommend that you
use the secure HTTPS protocol and certificate (see on page 245 “Certificate
for the HTTPS connection”). You can thus monitor your network from
anywhere in the world.
Example of an Internet address entry:
https://[IP address of your network management station]:11194
You can restrict the access with a password. To have information on
accessing, Industrial HiVision can create an event for every successful
access (see on page 369 “Program Access”).
Note: Verify that this communication is possible. This is particularly important
if the connection is made using firewalls / port forwarding.
When using a firewall, take note of this information (see on page 25
“Installation”).
The Industrial HiVision Web server provides the following pages:
Selection of the different websites
Graphic user interface
Event view
239
Monitoring the network
7.10 Remote access to Industrial
HiVision
Note: If you wish to test Industrial HiVision before connecting the application
to an actual network, then use the demo network provided by Industrial
HiVision (see on page 440 “Demo Network”).
Selection of the different websites
On this page, the Industrial HiVision Web server presents for selection the
websites provided by Industrial HiVision.
URL for this website:
https://[IP address of your network management station]:11194/idx
Graphical user interface
The Industrial HiVision Web server provides the same graphic interface
as the one used in your network management station. This enables you
to monitor and configure your network remotely in the same way as you
are accustomed to doing on-site.
URL for this website:
https://[IP adresse of your network management station]:11194
Events on the website
PDAs, smartphones and other portable devices are increasingly
important tools for IT administrators. For administrators, the event list is
an important part of Industrial HiVision. The event list contains a
concentrated overview of the state of the monitored network (see on
page 112 “Event list”).
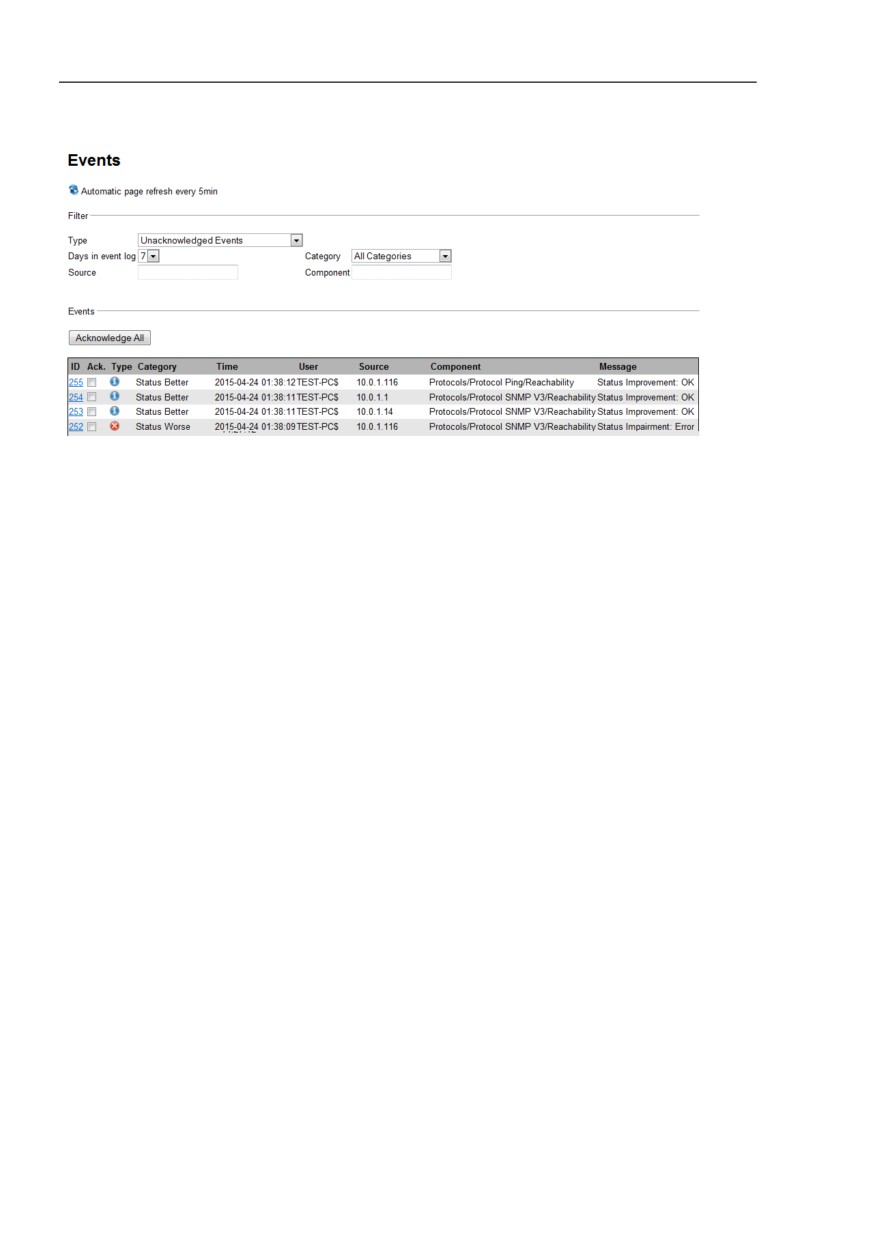
The Industrial HiVision Web server provides the event list in HTML format,
optimized for display on portable devices such as the iPhone, BlackBerry
devices, etc.
The following is an example of the URL for the Industrial HiVision Web
server:
https://[IP address of your network management station]:11194/events
The event website allows you to confirm events. Industrial HiVision
synchronizes the confirmations between the graphic user interface and
the mobile device.
240
Monitoring the network
7.10 Remote access to Industrial
HiVision
For the sake of clarity, Industrial HiVision restricts the display to the
following events:
- Unconfirmed events
- Confirmed events of the types “Warning“ and “Error“.
When you confirm a standard event in the list, Industrial HiVision removes
the confirmed standard event from the list.
Industrial HiVision refreshes this page every 5 minutes.
You can select different refresh cycles in the Configuration >
Preferences > Display > Event dialog.
(see on page 352 “Event”)
In addition to the predefined filters by “Category“, Industrial HiVision offers
user-defined filters according to the “Source“ and the “Component“ that
caused an event.
Copy a string from the “Source“ or “Component“ table column to the
corresponding filter field. You can make the string more general by
using the wildcard “*”.
Note: When accessing the event list using HTTP(S), Industrial HiVision
saves the filter settings in a Web session on the Web server of Industrial
HiVision.
Industrial HiVision gives you the option to change the lifetime of this Web
session in the Configuration > Preferences > Advanced > Services
dialog.
Use the setting Industrial HiVision Web Server > Web Server
Session Timeout [min].
If a password is configured for the Web access, this password remains
valid after the Web session is finished.
241
Monitoring the network
7.10 Remote access to Industrial
HiVision
Figure 51: Events on the website of Industrial HiVision
7.10.2 App access to Industrial HiVision
HiMobile is a mobile application (app) for mobile devices such as smart
phones and tablet PCs.
Anywhere in the world that you have an Internet connection and a link to the
network of Industrial HiVision for example, using a VPN, HiMobile allows you
to receive information about the status of your network.
To do this, HiMobile connects to the service of Industrial HiVision as a client
in order to exchange information.
Functions of HiMobile:
Display of the Industrial HiVision folder frame with information concerning
status, connection and any subdomains.
Display of the Industrial HiVision event list with filter function
Notifications when an event occurs
242
Monitoring the network
7.10 Remote access to Industrial
HiVision
Scanning of the device QR code to identify the device in the folder frame
and for other device information as well as access to the device-specific
website.
Forwarding location coordinates to Industrial HiVision.
Network Dashboard for device and connection monitoring.
You can find the HiMobile app as a free download on the HiVision website.
Preparing the app for access to Industrial HiVision
After you first start the app, or the “Settings” menu in the app, you see the
“Settings” dialog for entering the connection parameters.
Enter the IP address or the host name of your network management
station. You can find the IP address in Industrial HiVision in the
following dialog:
Configuration > Preferences > Advanced > Management
Station > IP Address Management Station
If your network management station has multiple network interface
cards, you take the IP address of the network interface card by means
of which HiMobile is to communicate with Industrial HiVision.
If your network management station is hidden behind a firewall with
the NAT function, you obtain the relevant IP address from the
administrator of the firewall.
Enter the port for the web server. You can find the port for “Remote
Access“ to Industrial HiVision in the following dialog:
Configuration > Preferences > Advanced > Services Access
Enter the “User Name“ and the “Password“ for web access. You can
find these data in Industrial HiVision in the following dialog:
Configuration > Preferences > Basics > User Management
Select a user from the “User Management“, which has “Web Access“
authorization in the “Access Roles“.
See “User Management” on page 327.
Enter the device names. Industrial HiVision displays the device names
of its mobile devices in the “Mobile Devices“ dialog under
Configuration > Preferences > Advanced > Mobile Devices.
Identifying devices with the app
Industrial HiVision allows you to store a QR code for each device. Print
out this QR code and affix it to the relevant device.
243
Monitoring the network
7.10 Remote access to Industrial
HiVision
The HiMobile QR Code Scanner allows you to scan this QR code on site
in order to identify the device. To show the information on your mobile
device, you scan in the QR code. Then HiMobile calls up the information
for the device from the Industrial HiVision web server and displays the
information on your mobile device.
To generate the QR codes of devices, select a device or multiple
devices of a device class, and to open the MultiConfig™ dialog,
choose Configuration:Configuration > MultiConfig™.
In the MultiConfig™ dialog, select Device Settings > Diagnostics >
QR Code Generator in the menu tree.
The QR Code Generator dialog gives you the following options for
saving the QR code:
- Change the initial setting for the path and file name for storing the
QR code files.
- Define the size of the QR code in pixels.
- Save the entries as an initial setting
To save the QR codes in the specified directory, click the “Write“
button.
The Configuration > Preferences > Advanced > Load/Save dialog
allows you set the path globally with the file name and tokens as
placeholders.
Geographic location display of a device
Industrial HiVision allows you to display the geographic location of a
device on a map for example, Google maps, on your network
management station.
There are two options for entering the location:
In the Industrial HiVision user interface.
Open the “Properties“ tab in the detail view.
In the “Property:“ drop-down list select, "Location
Coordinates (Device)".
244
Monitoring the network
7.10 Remote access to Industrial
HiVision
To open the “Location Coordinates“ dialog, double click on the
device for which you want to enter the coordinates.
Under “Value“ in the “Current Value“ frame, enter the location
coordinates for example, 48.743286,9.320326.
In HiMobile
Select a device in order to access the properties view for a device.
Type “Location Coordinates” on the pen icon of the property in
order to enter the geographic coordinates.
With “Get My Location”, your mobile device uses its potential
methods for example, GPS, to determine your location
coordinates. If you and your mobile device are in a different
location, then you can enter the latitude and longitude coordinates
manually.
HiMobile transmits these data to the network management station.
7.10.3 Certificate for the HTTPS connection
To provide greater protection for the connection between your mobile device
or a browser and Industrial HiVision, you require a new certificate. For this,
you require a web server keystore. The web server keystore is a file that
contains the key for the HTTPS connection.
245
Monitoring the network
7.10 Remote access to Industrial
HiVision
The following example also applies to Linux operating systems when you use
a “/” instead of a “\”.
In the command line interpreter of the operating system, go to the
installation directory of Industrial HiVision.
Generate a Industrial HiVision web server keystore in the command line
interpreter of the MS-DOS Microsoft operating system with the following
command:
lib\java_x86\bin\keytool -genkey -alias Industrial HiVision
-keyalg RSA -keystore keystore -keysize 2048 -keypass
password -storepass password
Respond to the request for your first name and surname with the unique
domain name of the domain to which your network management station
is connected.
You can enter any responses you want to the requests for your
organizational unit, your city or community, and your federal state.
Respond to the request for your country code with the two letters that
make up the country code of your country.
You can find the “keystore” file in the directory from which you executed
the command.
To request a certificate from a certification body, you require a certificate
signing request file (*.csr).
You generate this file in the command line interpreter of the operating
system with the following command:
lib\java_x86\bin\keytool -certreq -alias Industrial HiVision
-keystore keystore -file ihivision.csr -storepass password
You can find the *.csr file in the directory from which you executed the
command.
With this *.csr file you request a certificate from a certification body, such
as Verisign.de.
The certification body supplies the signed certificate in the form of a file or
an ASCII character string.
If you receive a file, rename this file to ihivision.crt.
If you receive an ASCII character string, copy this completely to a text file
with the name ihivision.crt.
Import the certificate into the web server keystore in the command line
interpreter of the operating system with the following command:
lib\java_x86\bin\keytool -import -trustcacerts -alias Industrial HiVision -file
ihivision.crt -keystore keystore -storepass password
Save the “keystore” file in the installation directory of Industrial HiVision
before replacing the existing file with the newly generated file.
Replace the “keystore” file in the installation directory of Industrial
HiVision with the newly generated “keystore” file.
246
Monitoring the network
7.10 Remote access to Industrial
HiVision
Note: The files contain confidential keys that are comparable to passwords.
Protect these files from unauthorized access.
Alternatively you can create your certificate yourself - see, for example,
www.openssl.org. For this, you import the required CA certificate to the
mobile device or browser by means of which you want to connect with
Industrial HiVision.
247
Monitoring the network
7.11 Interface to InfluxDB® and Graf-
ana®
7.11 Interface to InfluxDB® and
Grafana®
This function lets you visualize a graphical representation of the evolution of
different properties for the connected devices during a past period of time.
You can monitor the statuses and the values for properties of different
network topology items related to the following categories:
• device
• port general
• port statistics
• PoE
• performance
• WLAN
Industrial HiVision lets you select these categories and exports them to a
InfluxDB® server. InfluxDB® is an open source database optimized for fast,
high-performance storage, and retrieval of time-series data. From this
database Grafana® retrieves the data exported from Industrial HiVision.
Grafana® is a multi-platform open source web application used for analytics
and interactive visualization of data. When connected to supported data
sources, Grafana® provides charts, graphs, and alerts.
7.11.1 Configure InfluxDB® and Grafana®
In order for this functionality to work, you need to install InfluxDB® and
Grafana®. You can do this through the following methods:
The InfluxDB® and Grafana® applications installed on the same or
different workstations and configured to work together.
A Docker installation that runs the InfluxDB® and Grafana® containers
configured to work together. This is an unsecure method, that uses only
the HTTP protocol.
248
Monitoring the network
7.11 Interface to InfluxDB® and Graf-
ana®
Note: It is necessary to install the following application versions:
for InfluxDB®: version 1.8.x
for Grafana®: version 8.x.x
To configure InfluxDB® and Grafana®, perform the following steps:
Install InfluxDB®. Follow the instructions from the link https://
portal.influxdata.com/downloads/.
Note: In order to enable secure communication for InfluxDB®, in some
cases it is necessary to have a self-signed certificate. To do this, follow
the instructions from the link https://docs.influxdata.com/influxdb/v1.8/
administration/https_setup/#set-up-https-with-a-self-signed-certificate.
Note: For authentication and authorization in InfluxDB®, follow the
instructions from the link https://docs.influxdata.com/influxdb/v1.8/
administration/authentication_and_authorization/#user-management-
commands.
Install Grafana®. Follow the instructions from the link https://grafana.com/
grafana/download?pg=get&plcmt=selfmanaged-box1-cta1.
To install Industrial HiVision, follow the instructions from chapter
“Software Overview” on page 23.
To detect the devices from your topology, follow the instructions from
chapter “Device detection” on page 122.
To configure the connection parameters to the InfluxDB® server, follow
the instructions from chapter “Export to InfluxDB®” on page 380.
If you want to monitor port statistics, then you need to configure the user
defined properties for those ports explicitly. If you want to add user
defined properties to specific ports of a device, then perform the following
steps:
In the detail display, click the “Ports“ tab and select the desired ports.
To open the “MultiConfig™“ dialog, right-click on the desired ports and
select “MultiConfig™“.
In the menu tree of the “MultiConfig™“ dialog, open the “New
Property“ dialog.
To add a new user defined property, click the “New“ button.
The “New Entry“ dialog opens.
249
Monitoring the network
7.11 Interface to InfluxDB® and Graf-
ana®
In the “Property“ drop-down list, select the property that you want to
export and click the “OK“ button.
The selected property is added to the “New Property“ table.
Click the “Write“ button.
Note: If you want to save the user defined properties as a MultiConfig™
preset, follow the instructions from chapter “General information for the
Edit Presets table” on page 173
Note: The user defined properties are then displayed under the “Port
Statistics“ category in the Export to InfluxDB® > Categories table. You
can add the following user defined properties:
“CRC Alignment Errors“ (“Delta“)
“Collisions“ (“Delta“)
“In Errors“ (“Delta“)
“In Octets“ (“Delta“)
“In Unicast Packets“ (“Delta“)
“In non Unicast Packets“ (“Delta“)
“Out Errors“ (“Delta“)
“Out Octets“ (“Delta“)
“Out Unicast Packets“ (“Delta“)
“Out non Unicast Packets“ (“Delta“)
To select the desired categories of properties, follow the instructions from
chapter “Export to InfluxDB®” on page 311.
To login to Grafana®, perform the following steps:
Open a web browser.
In the address bar, enter the IP address and the port of the workstation
where Grafana® is installed in the following form:
[IP_address_of_Grafana®_installation]:3000
The Welcome to Grafana page opens.
In the Email or username field, enter the default user name: admin.
In the Password field, enter the default password: admin.
Click the Log in button.
The page where you can change the password opens.
In the New Password and the Confirm new password fields, enter
the same password.
Click the Submit button.
The General / Home page opens.
Note: If you choose to click the Skip button, then Grafana® prompts you
to change the password on the next log in.
250
Monitoring the network
In the Grafana® General / Home page, hover the mouse cursor over
the Configuration icon.
The Configuration menu opens.
In the Configuration menu, click the Data sources button.
The Data sources tab opens.
To add the data source, click the Add data source button.
The Add data source page opens.
To select the InfluxDB® server, click the Select button related to the
InfluxDB row.
The Data Sources / InfluxDB page opens.
In the Name field, enter the default name of the database: InfluxDB.
In the URL field, enter the IP address and the port of the workstation where
InfluxDB® is installed in the following form: https://
[IP_ADDRESS_OF_INFLUXDB®_INSTALLATION]:8086
In the Database field, enter the default name of the database:
ihivision_data.
In the User field, enter the user name.
In the Password field, enter the password.
Click the Save & test button.
Note: If you specified the correct data, then the Data source is
working message is displayed.
7.11.2 Import the Grafana® dashboard templates
Hirschmann provides a series of dashboard templates for the available
export categories. You can use these dashboards to visualize the data
exported from Industrial HiVision.
To import the dashboard templates into Grafana®, perform the following
steps:
Open a web browser.
In the address bar, enter the following URL: https://grafana.com/orgs/
hirschmann/dashboards
The Hirschmann Dashboards web page opens.
Select the name of the dashboard that you want to import.
The web page related to the selected dashboard opens.
251
Monitoring the network
7.11 Interface to InfluxDB® and Graf-
ana®
To copy the dashboard ID, click the Copy ID to Clipboard button.
In the Grafana® General / Home page, hover the mouse cursor over
the Dashboards icon.
The Dashboards menu opens.
In the Dashboards menu, click the Manage button.
The Manage tab opens.
In the Manage tab, click the Import button.
The Import page opens.
In the Grafana.com dashboard URL or ID field paste the copied ID
and click the Load button.
The Importing dashboard from Grafana.com page opens.
In the Select a InfluxDB data source drop-down list, select the
InfluxDB entry.
To open the selected dashboard, click the Import button.
The page related to the selected dashboard opens.
7.11.3 Security
To improve the security for the export to InfluxDB® feature, we recommend
that you use the secure HTTPS protocol. Also use this protocol in
combination with the enabled user authentication for InfluxDB® and
Grafana®.
252
References
7.11 Interface to InfluxDB® and Graf-
ana®
8
References
The descriptions in the previous chapters have been task-oriented, while the
preference chapter describes the individual dialogs and menu items in a
function-oriented way. Here you will find descriptions of function details for
performing basic tasks that are of lesser importance.
253