Network Management System Industrial HiVision 8.2. User Manual (2021) - page 4
Interface of the program
4.7 Detail display
4.7
Detail display
In the detail display area of the Industrial HiVision user interface, you get a
detail display of your network structure as a topology diagram, or in the form
of a list. See “Main window of Industrial HiVision” on page 72.
Industrial HiVision allows you to move devices located in the “Map“, “List“,
and “Devices“ tabs to other project folders using drag and drop. For example,
after scanning your network, Industrial HiVision displays a device in the “New
Devices“ folder. Using drag and drop you can move the device from the “New
Devices“ folder to the “My Network“ folder. The drag and drop function allows
you to move a single device or multiple devices at the same time.
4.7.1
Map
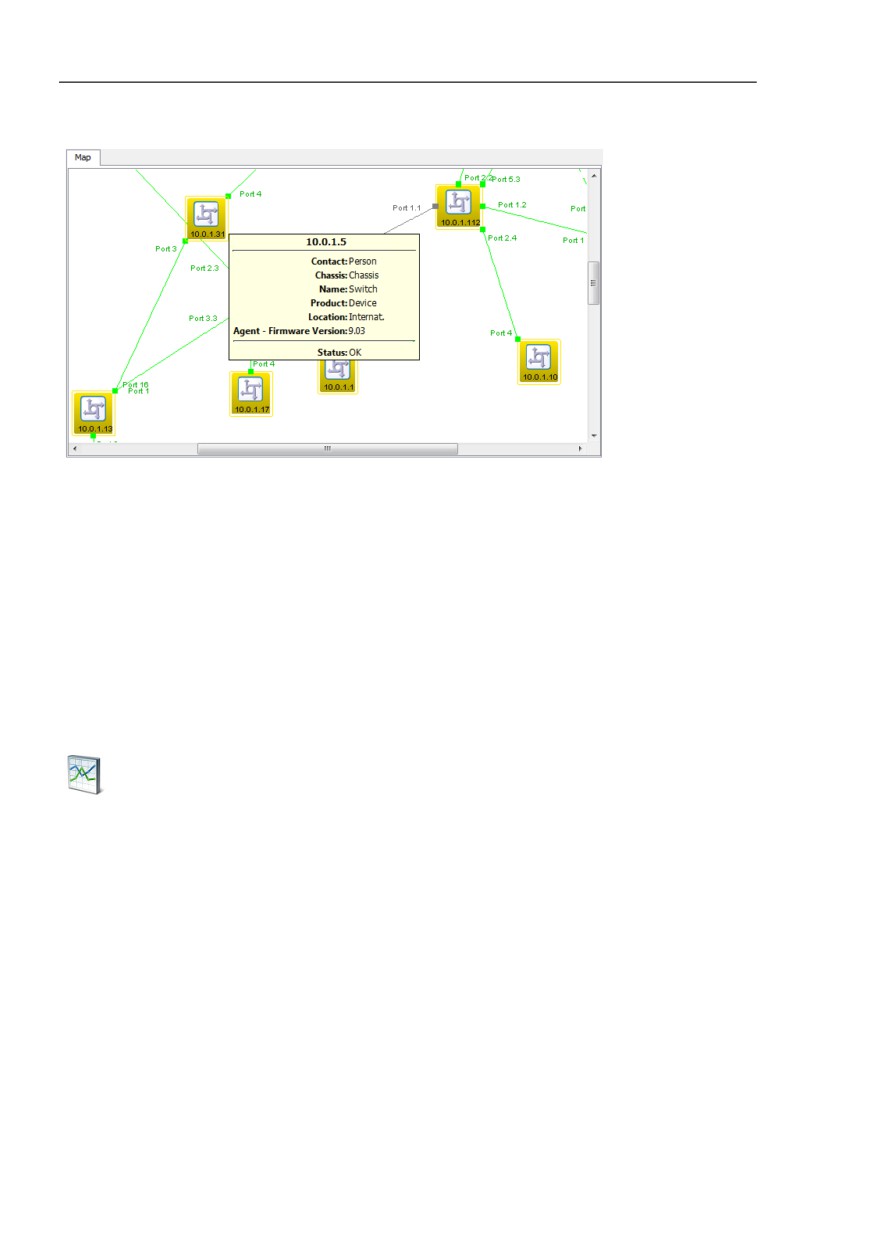
To access the topology view of the detail display, click on the “Map“ tab of the
detail display.
The devices and connections in your network structure are displayed in the
topology view in accordance with the presentation options you selected. By
selecting and pulling while pressing the mouse button, you can move
devices.
97
Interface of the program
4.7 Detail display
Figure 18: Detail display - “Map“
Double-click on a device/component to go down one level in the detail display
(see figure 46).
The lowest level is the Component-detail-level. You recognize it by the
diagram symbol.
Figure 19: Diagram symbol for a component detail
4.7.2
List
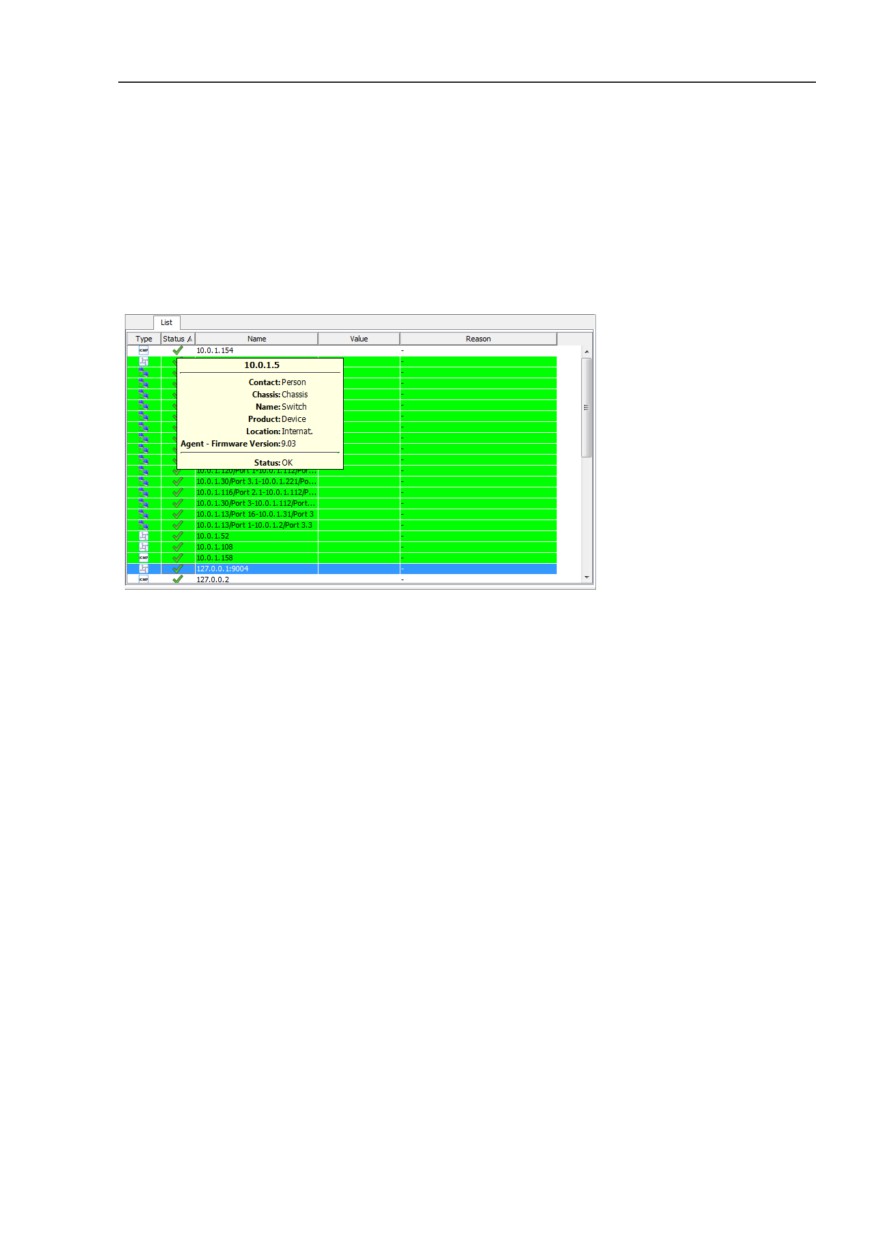
To access the list view of the detail display, click on the “List“ tab of the detail
display.
98
Interface of the program
4.7 Detail display
The devices and connections in your network structure on this layer are
displayed in a list in accordance with the presentation options you selected.
You double-click a device/component, you go down one level in the display.
Figure 20: Detail display - “List“
99

Interface of the program
4.7 Detail display
4.7.3
Devices
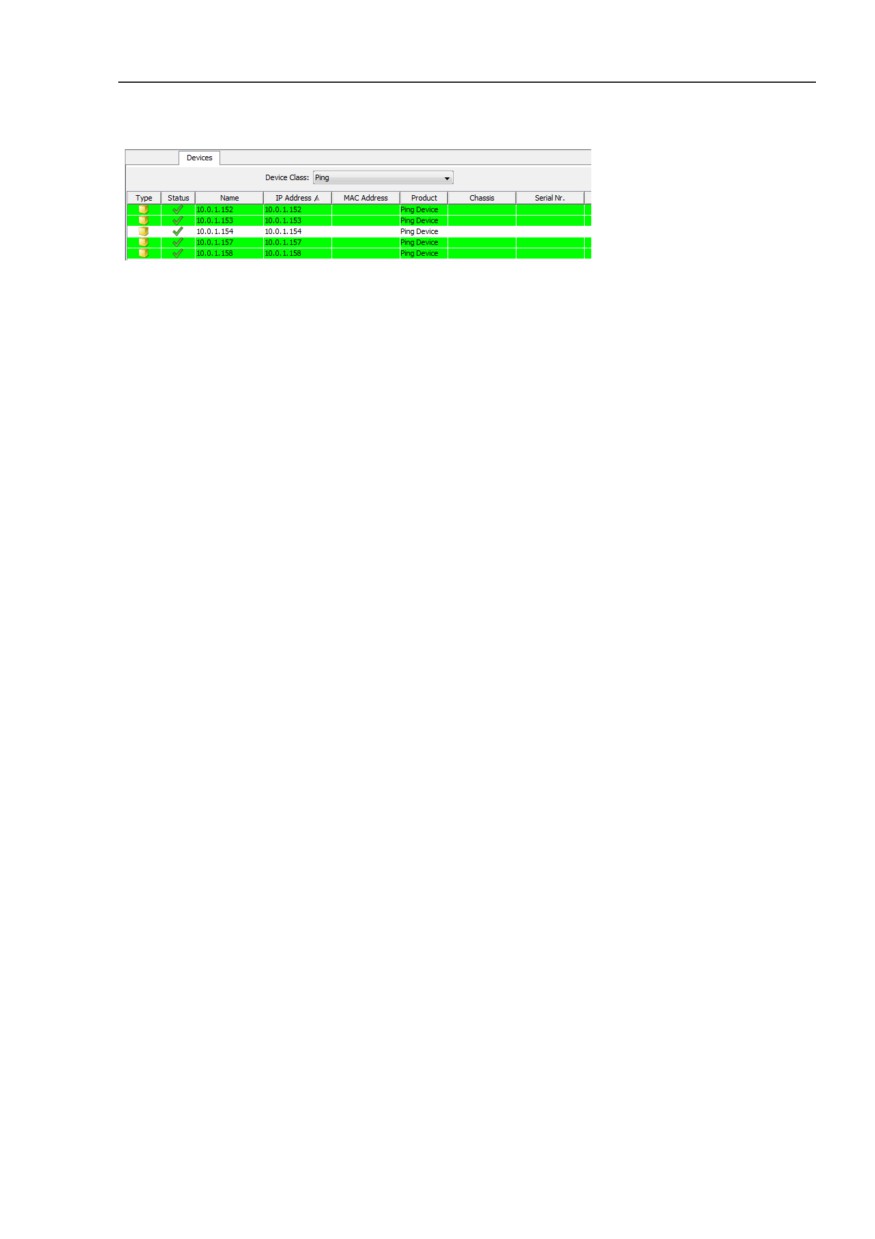
To access the device view of the detailed display, click on the “Devices“ tab
of the detailed display.
Industrial HiVision displays in a list the devices of the folder selected in the
folder frame, and its subfolders. This list displays for each device:
Name
Meaning
Type
Symbol for the device
Status
Symbol for the device status
Name
Name you gave to the device in Industrial HiVision, otherwise the IP
address of the device
IP Address
Management IP address
MAC Address
Management MAC address
Product
Name of the product family
Chassis
Product description
Serial Nr..
Serial number of the device
System Name
System name from the device MIB
Location
Location name that you entered in the device
Contact
Name of the contact person that you entered in the device
Firmware Version
The version of the firmware on the device
Chassis Name
Chassis name of a device with multiple management agents
Configuration
Devices that support this function assign a signature to a stored
Signature
configuration.
PSM up to date
This column indicates whether the data read from the device for the
current PSM (Product-Specific Module) corresponds to the data in
Industrial HiVision. If the data read from the device is from an earlier
version of Industrial HiVision, then Industrial HiVision will re-read the
data from the device in the next scan cycle.
Revision“EtherNet/IP“
If the property exist on the device, then column contains the revision
number of the Ethernet/IP application.
Table 4: Meaning of the columns in the detail display of the “Devices“ tab
The selection of a class of devices offers the possibility of filtering devices of
a class and tagging them at the same time. Using the MultiConfig™ function,
you can configure the selected devices together.
100
Interface of the program
4.7 Detail display
Figure 21: Detail display - “Devices“
Advanced EtherNet/IP Support
In the “Devices“ and “List“ tabs, Industrial HiVision displays additional
information about the devices in your network that communicate using the
EtherNet/IP protocol. Industrial HiVision displays the following EtherNet/
IP devices:
Switch
PC
Ping Device
The “List“ tab contains an “EtherNet/IP“ folder for the EtherNet/IP devices.
When you open the folder, Industrial HiVision displays the following
information:
“Vendor ID“
“Status“
“State“
“Serial Number“
“Revision“
“Product Name“
“Product Code“
“Device Type“
If the columns in the following list are empty or contain default values,
then the “Devices“ tab maps the EtherNet/IP properties as described
below:
“MAC Address“ column
Contains the MAC Address of the device.
“Chassis“ column
Contains the product name of the EtherNet/IP device.
“Serial Nr.“ column
Contains the serial number of the EtherNet/IP device.
101

Interface of the program
4.7 Detail display
4.7.4
Ports
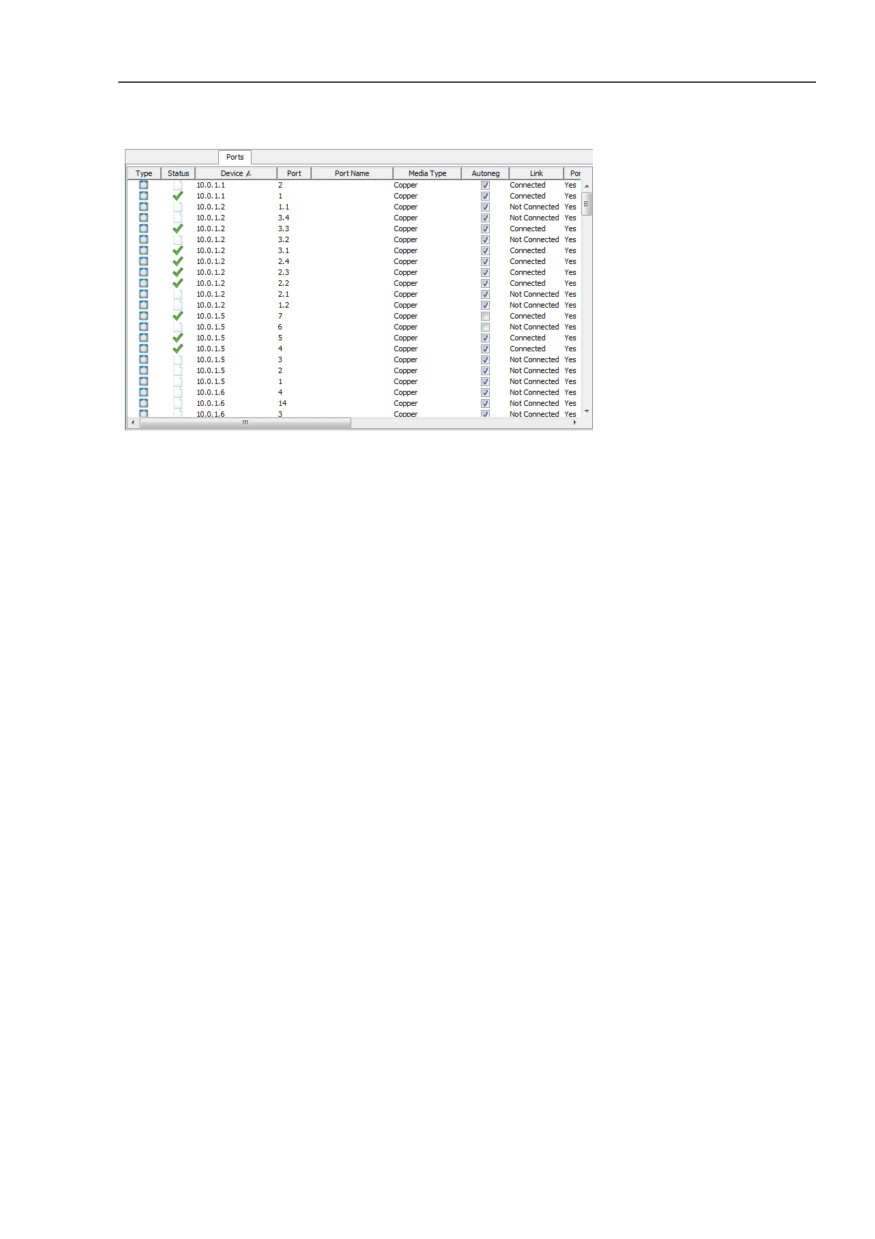
In the port view of the detail display, you click on the “Ports“ tab to go to the
detail display.
Industrial HiVision displays in a list the ports of the folder/device selected in
the folder frame and the subfolders in accordance with the presentation
options you selected.
Name
Meaning
Type
Symbol for the port socket
Status
Symbol for the port status
Device
IP address of the device to which the port belongs
Port
Port number
Port Name
Name of the port as it is stored in the device
Media Type
Type of the connected transmission medium for example, copper
Autoneg
Status of the autonegotiation function. A grayed-out display signifies
that there is no autonegotiation function on this port.
Link
Link state of the device connected on this port
Port Enabled
Port setting: switched on or off.
Speed/Duplex
Speed and duplex transmission of the link connected on the port
User
MAC addresses of the device connected to the port. The cell displays
the number of MCA addresses and multicast addresses connected to
the port.
Load
Network load of the incoming data volume
SFP Power RX dBm
Displays the Rx Power of the SFP transceiver, in dBm.
SFP Power TX dBm
Displays the Tx Power of the SFP transceiver, in dBm.
PVID
Port VLAN ID of this port. A hyphen indicates that the device has no
port VLAN function.
Ingress
Status of the ingress filter function. A grayed-out symbol indicates that
the device has no ingress filter function.
VLANs
The port’s membership of VLANs.
A number indicates the VLAN ID of the VLAN of which the port is a
member.
“U” stands for member of the VLAN; data packets without tag.
“T” stands for member of the VLAN; data packets with tag.
VLAN Consistency
PVID contained in VLANs
Check
Table 5: Meaning of the columns in the detail display of the ports
102
Interface of the program
4.7 Detail display
Figure 22: Detail display - “Ports“
103

Interface of the program
4.7 Detail display
4.7.5
Connections
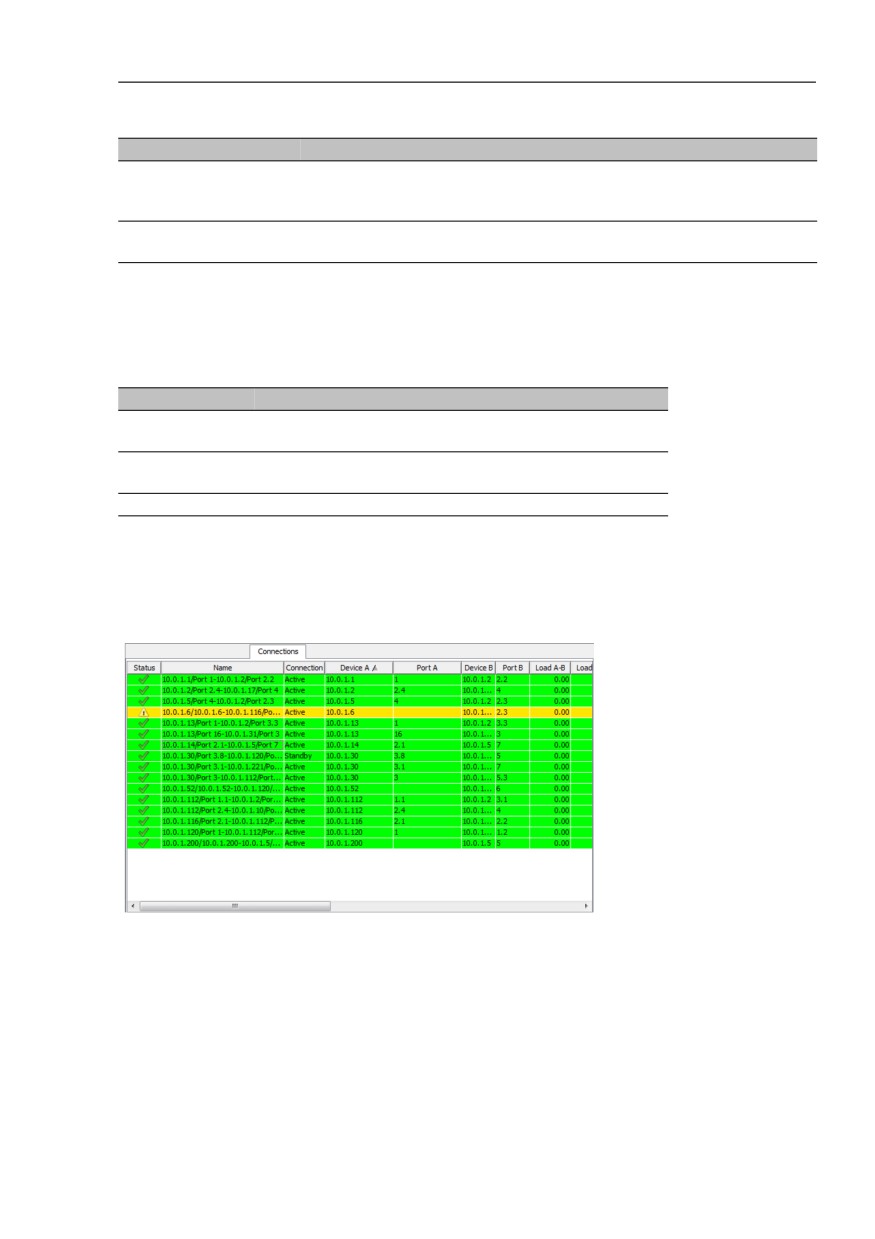
To access the links view of the detailed display, click on the “Connections“
tab of the detailed display.
Industrial HiVision displays in a list the links of the folder selected in the folder
frame and its subfolders. The list displays the following information for each
link:
Name
Meaning
Status
Symbol for the link status according to the settings in the monitoring
Name
Name of the link - a name you entered for the link, or the IP address/
port number of the connected devices
Connection
Status of the link (active, inactive)
Device A
Name/IP address of device A, to which the link is connected
Port A
Port number of device A, to which the link is connected
Device B
Name/IP address of device B, to which the link is connected
Port B
Port number of device B, to which the link is connected
Load A-B
Network load of the data volume from device A to B
Load B-A
Network load of the data volume from device B to A
Speed/Duplex
Speed and duplex transmission of the link
Media Type
Type of the transmission medium of the link for example, copper
Link Changed
Date of the last status change for the link
Config Check
Discrepancy in the settings of the ports to which the link is connected.
Refer to table 7
SFP Power RX dBm A
Displays the Rx Power of the SFP transceiver, in dBm, for port A
SFP Power RX dBm B
Displays the Rx Power of the SFP transceiver, in dBm, for port B
SFP Power TX dBm A
Displays the Tx Power of the SFP transceiver, in dBm, for port A
SFP Power TX dBm B
Displays the Tx Power of the SFP transceiver, in dBm, for port B
PVID Port A
Port VLAN ID of port A. A hyphen indicates that device A has no port
VLAN function.
PVID Port B
Port VLAN ID of port B. A hyphen indicates that device B has no port
VLAN function.
VLANs A
The link’s membership of VLANs.
VLANs B
A number indicates the VLAN ID for the VLAN of which the link is a
member.
“U” stands for member of the VLAN; data packets without tag.
A number alone stands for member of the VLAN; send data packets
with tag.
VLAN Check
When Port A and Port B have the same VLAN list, the result of the
check is “OK“.
A hyphen indicates that there is no VLAN list information at a port
Table 6: Meaning of the columns in the detail display of the “Connections“ tab
104
Interface of the program
4.7 Detail display
Name
Meaning
MTBF
Mean Time Between Failure of the components participating in the
link.
(see on page 441 “Calculate Availability”).
MTTR
Mean Time to Repair of the components involved in the link
(see on page 441 “Calculate Availability”).
Table 6: Meaning of the columns in the detail display of the “Connections“ tab
Value
Description
OK
Both of the ports connected to the link have duplex
settings that match each other.
Duplex
The ports connected to the link have different duplex
settings.
Empty field
Missing information
Table 7: Config. check - meaning of the display
Figure 23: Detail display - “Connections“
105
Interface of the program
4.7 Detail display
4.7.6
Properties
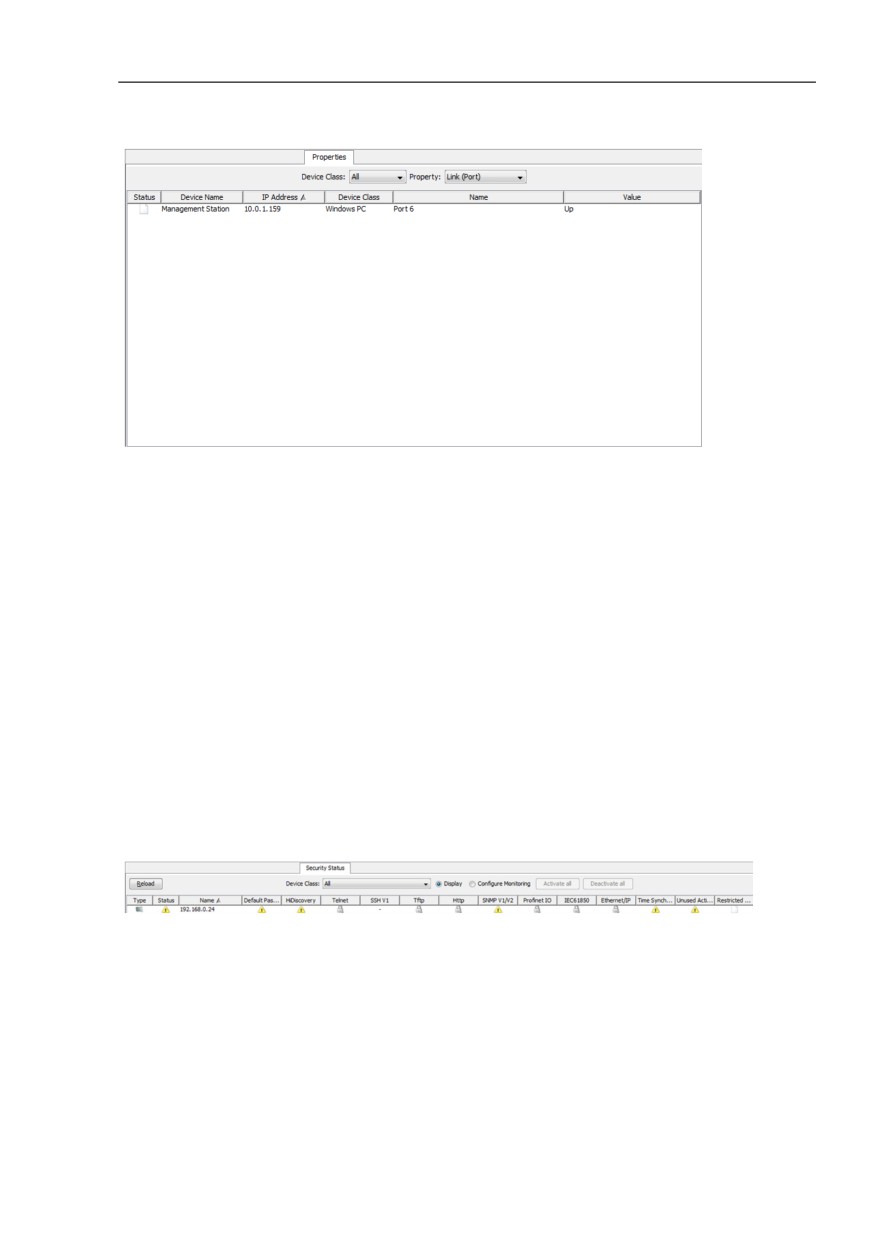
To access the properties view of the detail display, click on the “Properties“
tab of the detail display.
Industrial HiVision displays in a list a selected property of device classes for
the folder/device selected in the folder frame, and its subfolders.
Select a device class (e.g. Windows PC).
Select a property which you want to see for the devices of the device
class.
This list displays for each device in the device class:
Status derived from the value in the right column
Name/IP address of the device
Device class
Name of the queried property
Value of the property
The “Properties“ view provides you with a quick overview -- for example, if
you want to see the following:
The software version of the devices of a device class
The location of the devices of a device class
The relay states
The port properties of the Windows PCs
etc.
106
Interface of the program
4.7 Detail display
Figure 24: Detail display - “Properties“
4.7.7
Security Status
The “Security Status“ tab gives you an overview of the security properties of
the devices in the selected folders.
See “Security Status” on page 198.
Figure 25: Detail display - “Security Status“
107
Interface of the program
4.7 Detail display
4.7.8
PoE
In the detailed view, the “PoE“ tab displays an overview of the PoE
parameters for the Power over Ethernet (PoE) capable devices located in
your network.
Note: The column definition in the “Device / Module“ and “Module / Port“ view
depends on the PoE functions available for a particular device.
When you select a project in the folder frame, the “PoE“ tab displays the
parameters of every PoE capable device located in the project. You can also
filter your selection to include only the devices with the PoE function located
in a specific network. To display the PoE parameters of individual devices,
proceed as follows:
In the folder frame, locate a device with the PoE function.
Open the device to display the available properties.
Click the “PoE“ property.
You can also find the PoE parameters for individual devices in the “List“ tab.
Assuming that the devices supports the various levels, you can use
MultiConfig™ to specify the PoE parameters on the global, module, and port
level.
To access the PoE parameters on the global or module level, proceed as
follows.
Select the devices on which you wish to specify the parameters.
Right click on a selected device.
Select the MultiConfig™ option from the list.
Open the Basic Settings > PoE > Global dialog.
To specify the PoE parameters on the port level, proceed as follows.
Select the devices on which you wish to specify the parameters.
Open the “PoE“ tab.
Select the ports on which you wish to specify the parameters.
Right click on a selected port.
Select the MultiConfig™ option.
Open the Basic Settings > PoE > Global dialog.
108

Interface of the program
4.7 Detail display
The “Reload“ button allows you to refresh the parameters in the selected
rows. When you click the “Reload“ button, Industrial HiVision triggers a
polling task to retrieve the selected parameters. Depending on the network
load, the reload operation can require a significant amount of time to
complete the polling tasks.
Using the “View:“ drop-down list, you can display either the “Device / Module“
or “Module / Port“ properties.
The “Device / Module“ view contains the module parameters in the following
columns:
Name
Meaning
Name
Displays the IP address of the device.
Operation
Displays whether the PoE function is enabled/disabled on the device.
Budget
Displays the sum of the power available for the global budget.
Remaining
Displays the remaining power.
Rem Pwr= “Budget“ - “Reserved“
Reserved
Displays the global reserved power.
Delivered
Displays the actual power delivered to the modules.
Global Threshold[%]
Displays the threshold value for the power consumption of the entire
device, in percent
Device Limit
Displays a warning if the device consumption exceeds the configured
threshold.
Module
Displays the module number of the device.
Nominal Pwr
Displays the power available on the modules for distribution to the ports.
Max Pwr
Displays the maximum power available for the module.
Del Pwr
Displays the actual power delivered to the powered devices connected
to this port.
Res Pwr
Displays the power reserved for the module according to the detected
classes of the connected powered devices.
Pwr Source
Displays the power sourcing equipment for the device.
Threshold[%]
Displays the threshold value for the power consumption of the module in
percent.
Module Limit
Displays a warning symbol if the module consumption exceeds the
configured threshold.
Trap Notif
Displays whether the SNMP trap sending function is enabled/disabled.
When enabled, and the threshold value for the power consumption is
exceeded the device sends a trap.
Table 8: Meaning of the columns in the “Device / Module“ view
109

Interface of the program
4.7 Detail display
Figure 26: Detail display - “PoE“ tab, “Device / Module“ view
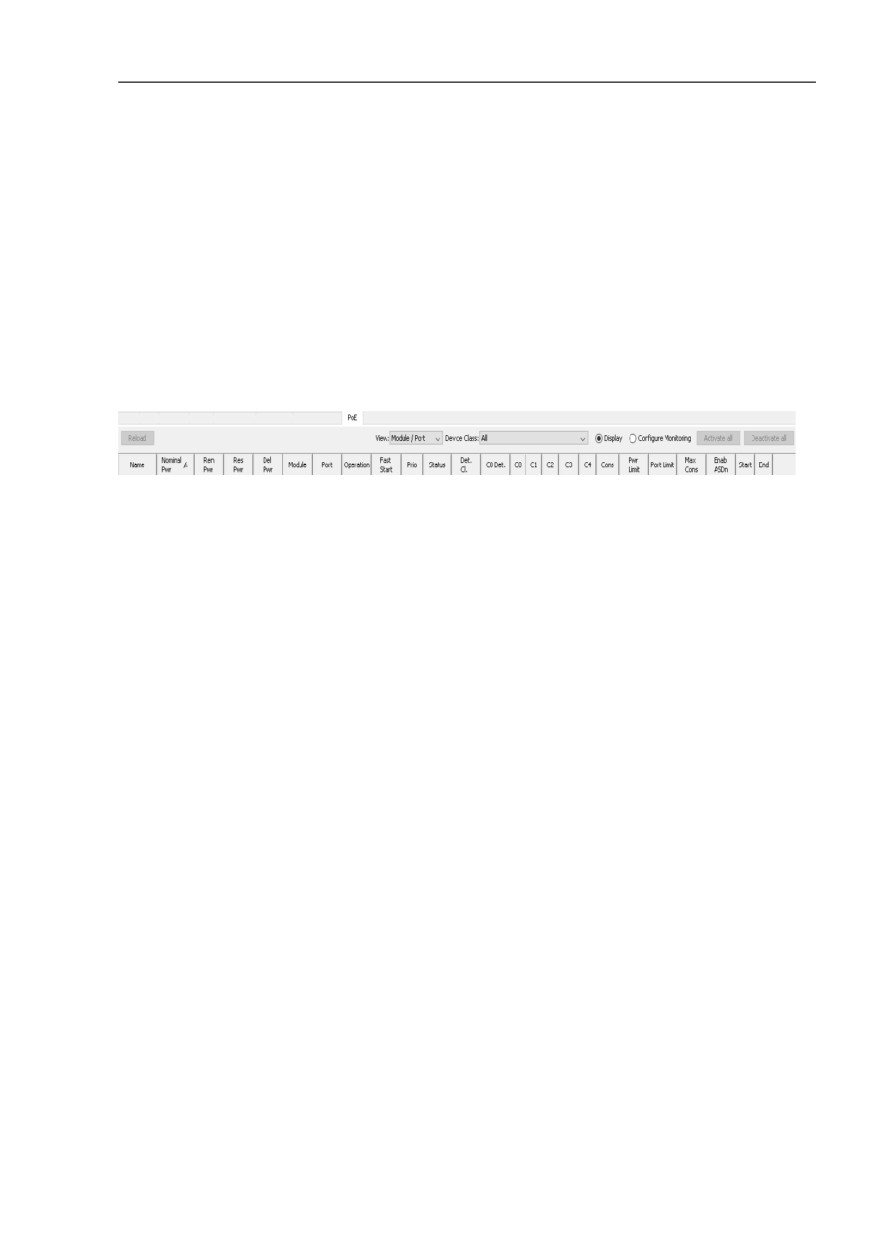
The “Module / Port“ view contains the port parameters in the following
columns:
Name
Meaning
Name
Displays the IP address of the device.
Nominal Pwr
Displays the power available on the modules for distribution to the ports.
Rem Pwr
Displays the remaining power.
Rem Pwr= “Budget“ - “Reserved“
Res Pwr
Displays the power reserved for the module according to the detected
classes of the connected powered devices.
Del Pwr
Displays the actual power delivered to the powered devices connected
to this port.
Module
Displays the module number on the device.
Port
Displays the number of the device port.
Operation
Displays whether the PoE function is enabled/disabled on the device.
Fast Start
Displays whether the PoE Fast Startup function is activated/deactivated
on the port.
Prio
Displays the port priority.
Status
Displays the status of the port Powered Device (PD) detection.
Det. Cl.
Displays the power class of the powered device connected to the port.
C0 Det.
Displays a warning symbol for ports which do not declare their power
class.
C0...“C4“
Displays the current status of the classes 0 through 4 on the port.
Cons
Displays the current power consumption of the port in watts.
Pwr Limit
Displays the maximum power in watts that the port outputs.
Port Limit
Displays a warning if the port consumption exceeds the configured
threshold.
Max Cons
Displays the maximum power that the device has consumed since the
last start up in watts.
Enab ASDn
Displays whether the Auto Shutdown function is activated/deactivated
on the port.
Start
Displays the time at which the device disables the power for the port
upon activation of the Auto Shutdown function.
End
Displays the time at which the device enables the power for the port
upon activation of the Auto Shutdown function.
Table 9: Meaning of the columns in the “Module / Port“ view
110
Interface of the program
4.7 Detail display
You can deactivate specific port parameters at “Device / Module“ level and
at “Module / Port“ level.
To enable the editing mode, click “Configure Monitoring“.
Activate or deactivate the required parameters.
To apply the change to all the “PoE“ capable devices, modules or ports,
use the “Activate all“ and “Deactivate all“ buttons.
After the parameters are deactivated, the application stops displaying
warning messages related to these parameters.
Figure 27: Detail display - “PoE“ tab, “Module / Port“ view
111
Interface of the program
4.8 Event list
4.8
Event list
Industrial HiVision logs the events that relate to the program itself and to the
monitored devices. (see on page 352 “Event”). There are two main scenarios
to select and show the events in the event list:
object-based filter
type of event/chronological filter for every objects.
In the first scenario, select the number of required objects, on the map. Use
the “Filter Events for Object“ button, at the top right of the event list. When
you select at least one object on the map, the button becomes active. Then,
to filter the events that you want Industrial HiVision to show, use the selection
field at the top right of the event list. You can select from these filter options:
“All Events“,
“Last 24 Hours Events“,
“Last 12 Hours Events“,
“Unacknowledged Events“,
“Warnings & Errors“,
“Unacknowledged Warnings & Errors“,
“Link Events“,
“User Defined...“
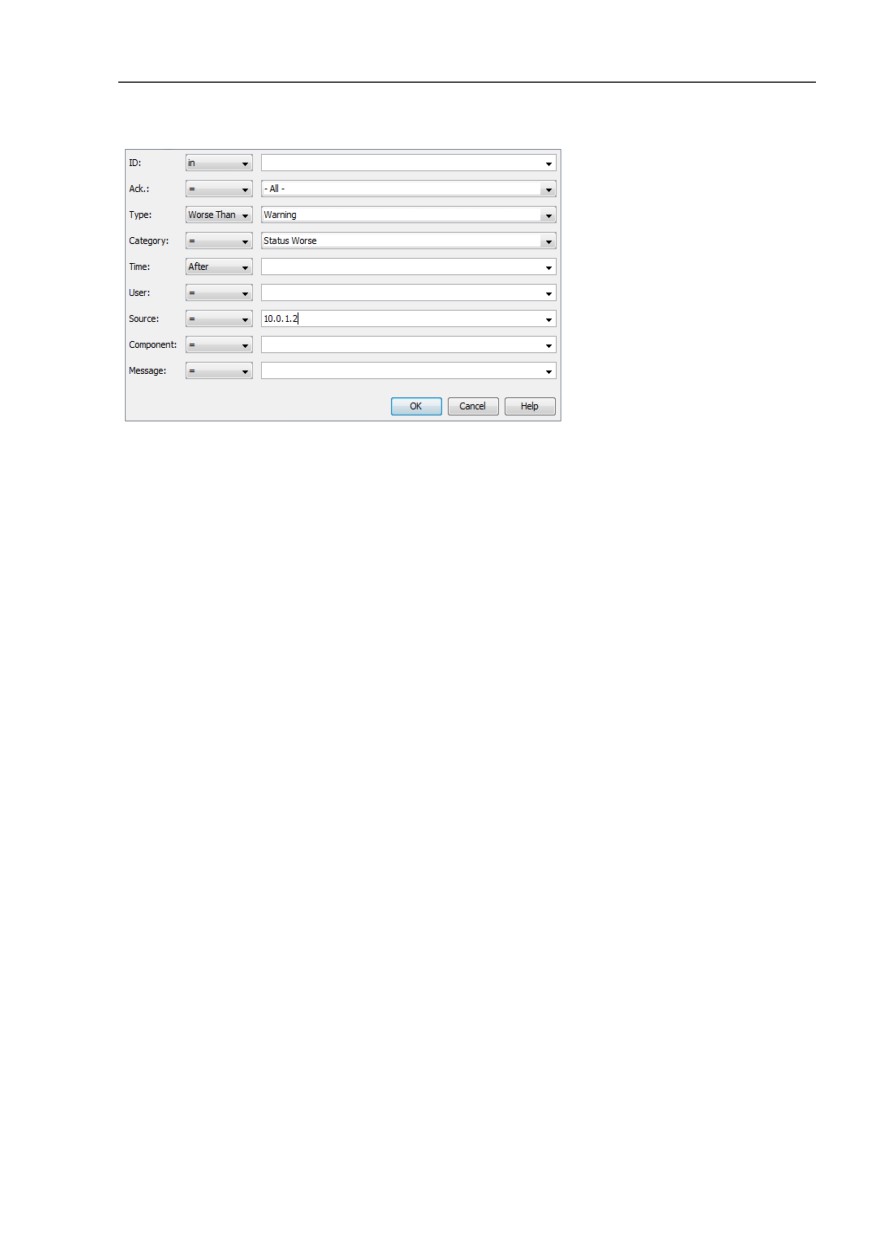
For user-defined events, Industrial HiVision opens the “User Defined...“
dialog in which you can specify which events Industrial HiVision is to show
in the list.
For help with the input format, hover the mouse pointer over an input field.
When you click the “Filter Events for Object“ button, Industrial HiVision
displays the events of the selected object in the event list.
112
Interface of the program
4.8 Event list
Figure 28: “User Defined...“ dialog
Note: When you enter the time, use the 24-hour clock format.
Examples of events are:
“Application Info“,
“Status Better“/“Status Worse“,
“Event Acknowledge“,
“SNMP Trap“,
“Device Discovered“,
and so on.
Industrial HiVision allows you to write the events to an event log file. You can
also show the events in the program interface.
For every event, Industrial HiVision logs the information as follows:
An identification number,
Whether the event was acknowledged by the user,
The event type (Info, Warning, Error),
The event category,
The time the event occurred,
The user responsible for the entry for example, the user who
acknowledged the event,
The source that caused this entry for example, the device that changed to
a better status.
113
Interface of the program
4.8 Event list
The component that caused this entry for example, the port for which the
connection status changed back to “ok” again
A message stating which event caused this entry
The event list enables you to acknowledge individual events, or every event
at once. See figure 7 on page 73.
Right-click on a line in the event list and select an option:
“Acknowledge“ to acknowledge this event
“Acknowledge All“ to acknowledge every the event on this tab
If Industrial HiVision can relate the event to a device or a property, then
double-click on a row in the event list to select the source of the event in the
folder frame.
Note: The “User Intervention“ event related to or which contains the
message “Device refresh (F5) complete” is now an “Application Info“ event
with the same message. If you configured an event alarm for this “User
Intervention“ event, then change the event alarm to match the new
“Application Info“.
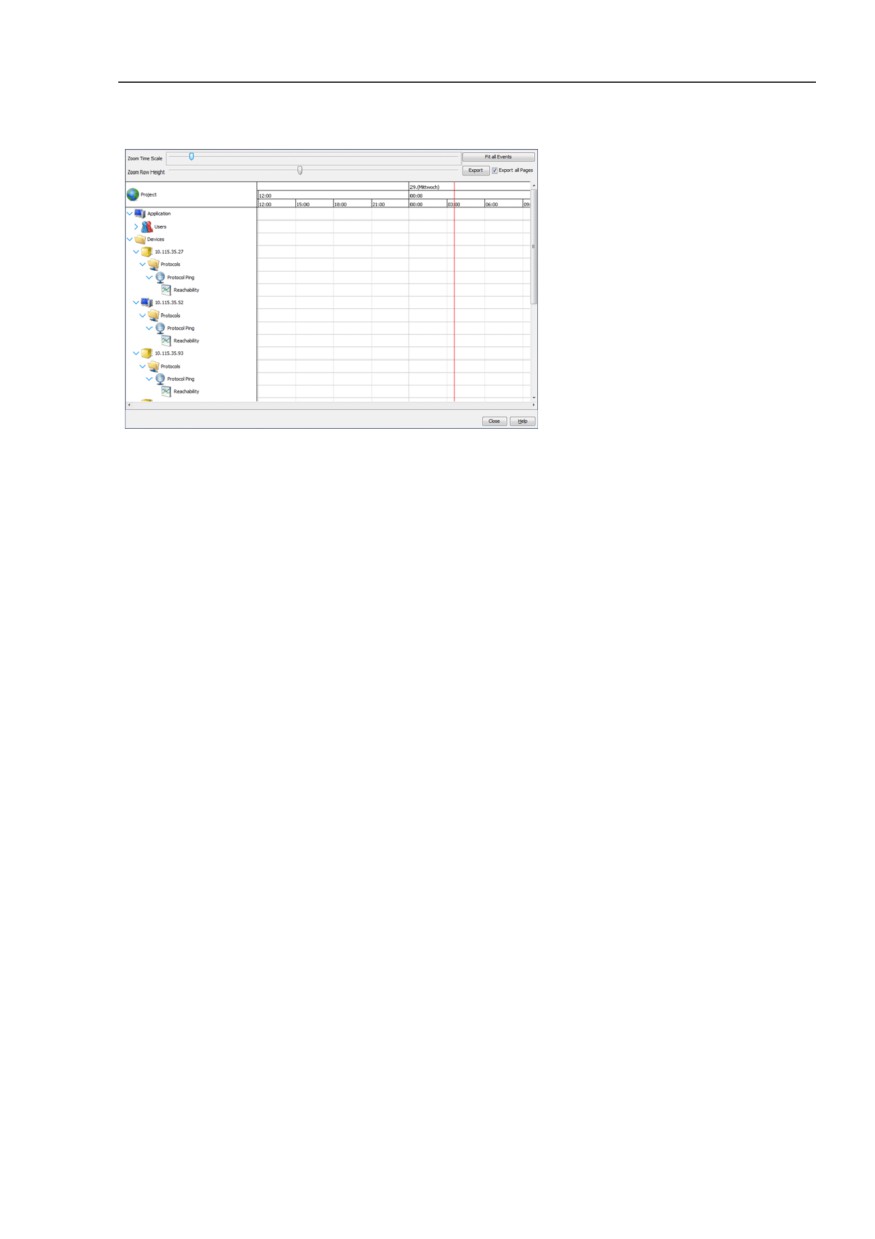
4.8.1
Event History
The “Event History“ dialog displays the same events as in the Event List,
but in a Gantt chart. The Gantt chart has the following areas:
a left tree,
The left tree contains users, devices, connections and their
subcomponents that enter any event in the chart.
a right chart.
The right chart contains a dedicated row for every subcomponent. The
row is made of the events that belong to that subcomponent.
114

Interface of the program
4.8 Event list
The “Event History“ dialog displays the following events:
Status period
Status period is a colored bar that displays the period in time during which
a device property, device or connection has a specified status.
The bar displays the status of the event with these colors:
- Red
A red bar displays events with the “Error” status.
- Yellow
A yellow bar displays events with the “Warning” status.
- Green
A green bar displays the time that the operated device error free.
- Silver
The silver bar is only available for users, devices and connections. The
bar displays a summary of the subcomponents that belong to the
same device or connection.
Application events
The “Event History“ dialog displays the application events in the
application row. Application events are information about the Industrial
HiVision application for example, the time that a user logged in.
Trap events
The “Event History“ dialog displays trap events in the component row.
Trap events are information sent from a device to Industrial HiVision for
example, an unreachable device, or a change in a protocol.
User events
The “Event History“ dialog displays events in the “User Intervention“
category, in a row related to a user.
The “Event History“ dialog displays the number of events that occurred at or
around the same time on an icon. To display the text for the events, hover the
mouse pointer over the icon. When the number of events displayed on an
icon is more than 1, right-click on the icon and select the “Details“ option. The
list also displays the time that the event occurred.
To display events in the “Event History“ dialog, proceed as follows:
In the event filter drop-down list, select a filter for the events that you want
to display.
Click the “Event History“ button.
115
Interface of the program
4.8 Event list
To display events in the “Event History“ dialog related only to a specified
component, proceed as follows:
Select the component in the “Map“ tab.
Click the “Filter Events for Object“ button.
Click the “Event History“ button.
If an event icon displays a number of events occurred at or around the same
time, you can use the “Zoom Time Scale“ slider to stretch the time line. If you
stretch the time line, then the “Event History“ dialog lists the events. The
“Zoom Row Height“ slider increases and decreased the height of the row.
Note: When you delete a component from the “Map“ tab, the events that the
component made stay in the event list. However, Industrial HiVision deletes
the events from the “Event History“ dialog.
The list below contains a description of the checkbox and buttons in the
“Event History“ dialog:
“Fit all Events“
The button reduces the width of the rows to display the start and end times
of the events.
“Export“
The button allows you to export the“Export“ dialog as a PDF file.
“Export all Pages“
The checkbox allows you to decrease the export job to export only the
components on the current screen.
116
Interface of the program
4.8 Event list
Figure 29: “Event History“ dialog
Example
You notice that the “Map“ tab displays some links down. To pinpoint the
time that the status for the links changed, you can display the devices and
connections in the “Event History“ dialog. To filter the “Event History“ for
events related to the devices and connections proceed as follows:
In the “Event History“ section, select the “User Defined...“ function
from drop-down list. Industrial HiVision opens the “User Defined...“
dialog.
Enter the device information in the “User Defined...“ dialog.
Note: For help with the input format, hover the mouse pointer over an
input field.
- In the “ID“ row, select “in“ from the drop-down list, and enter an
asterisk (*) in the text field.
- In the “Ack.“ row, select “in“ from the drop-down list, and enter an
asterisk (*) in the text field.
- In the “Type“ row, select “=“ and “Warning“ from the drop-down
lists.
- In the “Category“ row, select “=“ and “Status Worse“ from the drop-
down lists.
- In the “Time“ row, select “Before“ from the drop-down list and enter
the present time.
- In the “User“ row, select “=“ and “*” from the drop-down lists.
117
Interface of the program
4.8 Event list
- In the “Source“ row, select “=“ and the IP address of the device from
the drop-down list.
- In the “Component“ row, select “=“ and “*” from the drop-down lists.
- In the “Message“ row, select “=“ and “*” from the drop-down lists.
To apply the filters to the “Event History“ log, click the “OK“ button.
Industrial HiVision displays only the log entries that match the filter
values.
To open the “Event History“ dialog, click the “Event History“ button.
The “Event History“ dialog displays the time that status worsened for
the device.
Now that you know when the device links went down, you can find the root
cause.
118
Interface of the program
4.9
To navigate with the
Keyboard
4.9.1
Navigating in a table
You can use the arrow keys to move up, down, right and left between the
table fields in a table.
You use the tab key to move to the next table field.
With Ctrl+Tab you move to the next field outside the table.
4.9.2
Changing the frame
With Tab you move to the next frame in the program interface.
119
Creating a network plan
4.9 To navigate with the Keyboard
5
Creating a network plan
The monitoring of a network starts with the display of the network on the
network management interface. Industrial HiVision allows you to view your
network in different display variations at the same time, based on different
criteria.
For example, you can set up a network plan on the following criteria:
display the actual physical environment
display the most important connection nodes
is based on the topology of your network, and so on.
You can display a device in several network plans by means of copying or
connections.
The network display is subdivided into the following items:
Device detection
Device arrangement
Device mapping
Device connections
Networks are generally undergoing constant modification. This involves the
following activities:
removing devices
adding new devices, and thus
rearranging connections.
121
Creating a network plan
5.1 Device detection
5.1
Device detection
During the first step in setting up a network plan, Industrial HiVision supports
you in discovering the following devices installed on the network (see on
page 323 “Discovering devices”).
Hirschmann BAT family
Hirschmann OCTOPUS family
Hirschmann GECKO family with Management
Hirschmann Rail Switch with Management
Hirschmann MICE family
Hirschmann Power MICE family
Hirschmann MACH family
Hirschmann GREYHOUND family
Hirschmann GES-24TP Plus
Hirschmann EAGLE family
Hirschmann Rail Router family
Hirschmann Redundancy Switch family
Hirschmann LioN-P family
Hirschmann LioN-R family
Hirschmann LION family
Hirschmann Embedded Ethernet family
Hirschmann OWL family
Hirschmann Dragon PTN family
Hirschmann Dragon MACH 4000 and 4500
Hirschmann Bobcat family
Hirschmann IT family
Hi-SCOM-BN
Hi-SCOM-IP66
Magnum 5RX
Magnum 6K
Magnum 10KT
Magnum DX line
Magnum 10ETS
Magnum 10RX
Magnum 12KX
Schneider Electric TCSESM, TCSESM-E, TCSESB families
Schneider Electric TCSEFEC family
122
Creating a network plan
5.1 Device detection
Schneider Electric Nxx family
Schneider Electric MCSESM, MCSESP families
Selectron Systems ESM family
Selectron Systems ERT family
ABB AFF, AFS and AFR families
INSYS MoRoS Modem, ISDN, HSPA, UMTS, GPRS, LAN, MI
Meinberg LANTIME GPS, M300, M600
Advantech SNMP-1000
EPSON FX-2190, ACULASER C100N printers
Devices with SNMP
Windows PCs
Devices with ICMP (Ping)
Note: Industrial HiVision detects SNMP based devices of a third party
manufacturer based on the MIB II standard. As a result, Industrial HiVision
represents existing interfaces of the ifTable, including VLAN or routing
interfaces, as separate ports.
Under Configuration > Preferences > Basics > Discover Devices,
you select your preferred device discovering method.
123
Creating a network plan
5.1 Device detection
Industrial HiVision provides 4 methods for discovering devices:
Discovering devices using traps
After they are switched on, the devices send a switched-on message to
the network management station entered in the device. Industrial HiVision
evaluates this message and displays the devices in the default map
entered (see on page 322 “[Basics]”).
This method is suitable for use during ongoing monitoring in networks
where the bandwidth needs to be managed.
Discovering devices using the HiDiscovery V1 protocol
The HiDiscovery V1 protocol uses the MAC address to communicate with
devices in the network on which the HiDiscovery V1 protocol is active.
This method enables you to detect devices in your network to which you
have not yet assigned a valid IP address.
Industrial HiVision displays the devices in the default map entered (see on
page 322 “[Basics]”).
This method is suitable for when you start up a newly installed network
and want to assign the IP address to the new devices.
Discovering devices using a defined IP address range
Using Net Scan, Industrial HiVision periodically sends Ping and SNMP
requests to the devices with an IP address in the defined IP address
ranges. Industrial HiVision positions the devices thus detected in the
default map for this IP address range. When defining the IP address
range, you can assign a default map to each IP address range (see on
page 322 “[Basics]”).
This method is suitable for monitoring a running network. Adapt the
frequency of the requests to the bandwidth of your network.
Discovering newly created devices
Industrial HiVision allows you to create a device manually and to assign
an IP address to the entry for this device. After the device is created,
Industrial HiVision can send an inquiry to this IP address in order to detect
it (see on page 132 “Creating new devices”).
Discover devices from a list of IP addresses
Industrial HiVision allows you to scan IP addresses using a text or an
Microsoft Excel csv file. The “Create Devices from List“ dialog allows you
to search for and upload the file to Industrial HiVision. If a device in the list
is unreachable, then Industrial HiVision displays the device in the
topology map as a generic device. (see on page 255 “Devices from List”)
124
Creating a network plan
5.1 Device detection
5.1.1
Device Icons
After Industrial HiVision scans your network, the “Map“ tab displays the
results. The tab displays the various icons for the devices discovered during
the network scan. If the devices have a PSM assigned, then the tab displays
the PSM. Otherwise, Industrial HiVision displays an icon in accordance with
the status of the device.
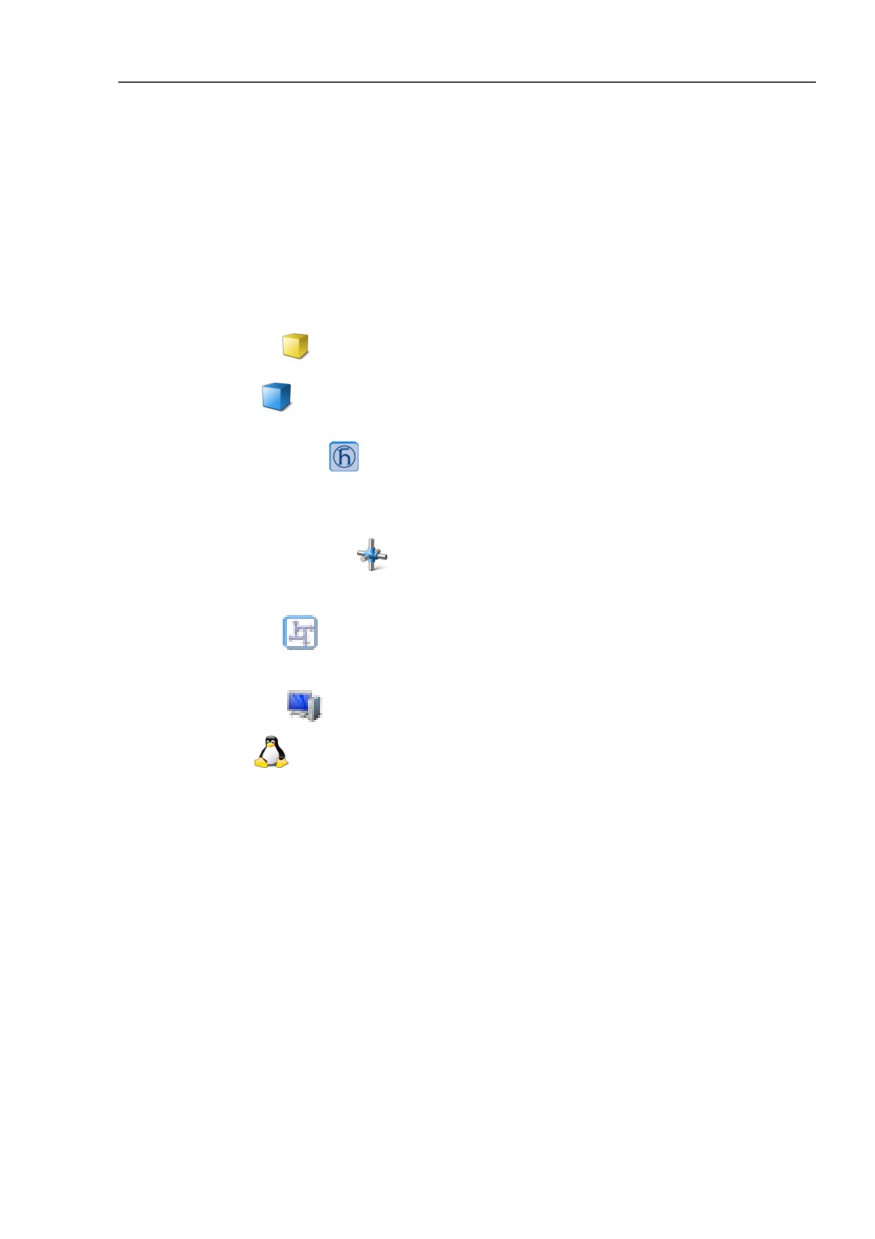
The following list contains a description of the Industrial HiVision icons:
Yellow cube -
The device only responds to ping requests.
Blue cube -
The device responds to HiDiscovery V1 requests, but is not a Hirschmann
device.
Hirschmann icon -
The device responds to HiDiscovery V1 requests. Industrial HiVision has
determined that the device is a Hirschmann device based on the MAC
address, but the device does not have a PSM.
Unknown node icon -
A user entered the device manually into Industrial HiVision, but the device
is unreachable.
PSM Switch -
The device responds to SNMP requests, but Industrial HiVision does not
know the Object ID.
Windows PC -
The device is a mputer running a Windows operating system
Linux PC -
The device is a computer running a Linux operating system
5.1.2
HiProvision
HiProvision lets you monitor the Dragon PTN devices, tunnels, and services
running in the tunnels. The HiProvision icon displayed in Industrial HiVision
represents the Dragon PTN devices, tunnels and services.
You can download the HiProvision manuals from the Hirschmann document
web page: www.doc.hirschmann.com
125

Creating a network plan
5.1 Device detection
In order for you to add the HiProvision icon in Industrial HiVision proceed as
follows:
Perform the following steps in HiProvision:
Navigate to the Dashboard> Tools> Add-ons> SNMP-Northbound>
Configuration tab.
In the Agent frame, mark the Enabled checkbox.
In the Agent> IP Address & Port field, type in the IP address of the PC
where HiProvision is running.
You use the Port field to set the SNMP port that is used to communicate
with Industrial HiVision. The default port setting is 161. This is also the
default setting for Industrial HiVision.
In the Agent frame, mark the SNMP v3 checkbox.
Configure either the admin or user parameters. Configure the admin
parameters for device management. The user parameters only let you
monitor the device.
- In the Authentication Protocol drop-down list, select the required
authentication type.
Industrial HiVision uses either Md5 or sha.
- In the Encryption Protocol drop-down list, select the required
encryption type.
Industrial HiVision uses either None, Des, or Aes128.
Perform the following step in Industrial HiVision:
Open the “Map“ tab.
To add a new device to the topology, right-click an empty place in the
“Map“ tab.
In the drop-down list, select New > Device.
In the IP Address > Device > IP Address fields, type in the IP
address of the PC where HiProvision is running.
You use the SNMP Port No field to set the SNMP port that is used to
communicate with HiProvision. The default port setting is 161. This is
also the default setting for HiProvision.
In the Properties > Name field, type in HiProvision.
Click the “OK“ button.
Industrial HiVision displays the HiProvision icon in the “Map“ tab.
The following worksteps explain how to monitor the “Tunnel List“ in Industrial
HiVision. You monitor the “Service List“ in the same manner.
Make 2 tunnels in HiProvision, and name them Tunnel 1 and Tunnel 2.
Verify that you have the “Edit Mode“ active.
Double click on the HiProvision icon in the “Map“ tab.
126
Creating a network plan
5.1 Device detection
Double click on the “Tunnel List“ entry in the “List“ tab.
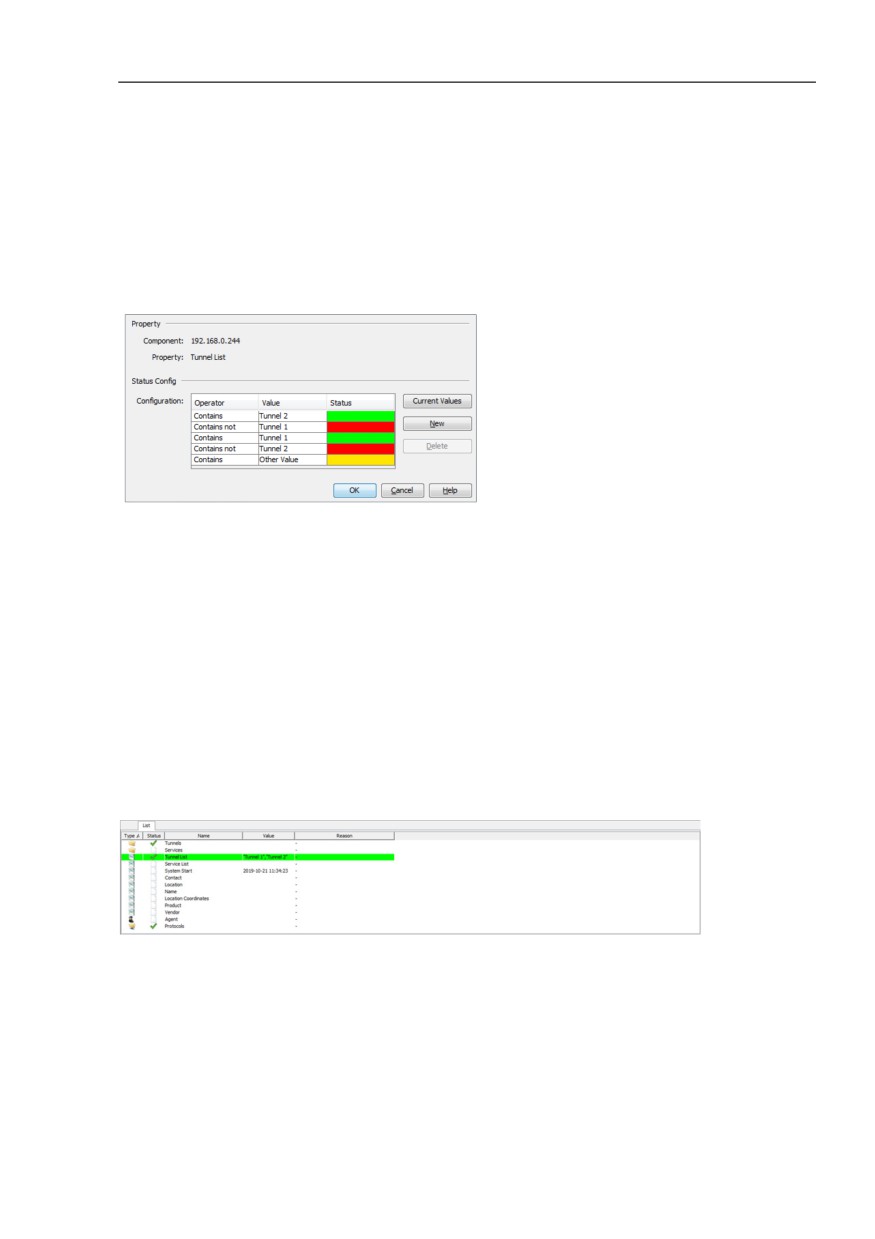
In the “Properties“ dialog, click the “Status Config“ button.
Enter the values as displayed in (see figure 30).
To add additional rows, use the “New“ button.
Figure 30: Status Configuration for HiProvision Tunnels
The “Tunnel List“ entry in the “List“ tab displays a green checkmark as long
as the entry only contains Tunnel 1 and Tunnel 2. If Tunnel 1 or Tunnel 2
go down for any reason, then Industrial HiVision displays the entry with an
error. If the entry contains another value, then Industrial HiVision displays the
entry as a warning.
127
Creating a network plan
5.2 Assigning device icons
5.2
Assigning device icons
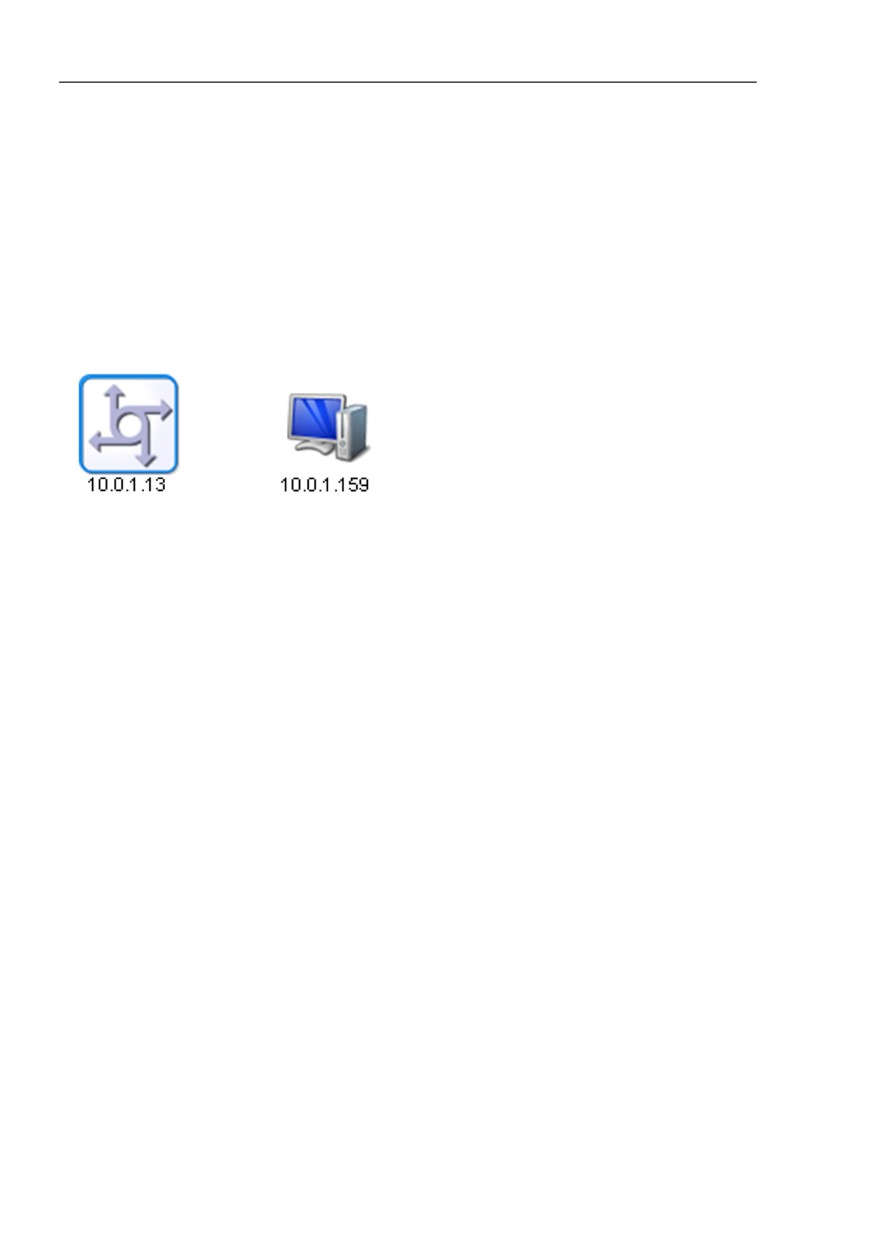
To visualize the devices more clearly in the detail display, Industrial HiVision
allows you to assign different icons as default icons to the device types.
Figure 31: Device icons
In the state on delivery, Industrial HiVision detects a number of device types
(e.g. Hirschmann devices) and assigns the corresponding device icons to
these devices.
You can assign icons to other device types in the “Preferences“ dialog. To
differentiate the device types, Industrial HiVision provides you with the
following assignment characteristics in the device detection (see on
page 365 “Device Icon”):
System Object Identifier (SysOID)
The SysOID denotes an MIB variable. As the SysOID of a manufacturer
MIB contains the manufacturer, you can use different icons here to
differentiate the devices on the manufacturer level. In the state on
delivery, Industrial HiVision contains the SysOIDs for Hirschmann,
Schneider, Siemens, Rockwell and Cisco.
EtherNet/IP
Similarly to the System Object Identifier, EtherNet/IP devices contain
information about the manufacturer and the product. Here you can get
Industrial HiVision to assign the icons down to the device level.
128