Physics For Scientists And Engineers 6E - part 261
33.4 Capacitors in an AC Circuit
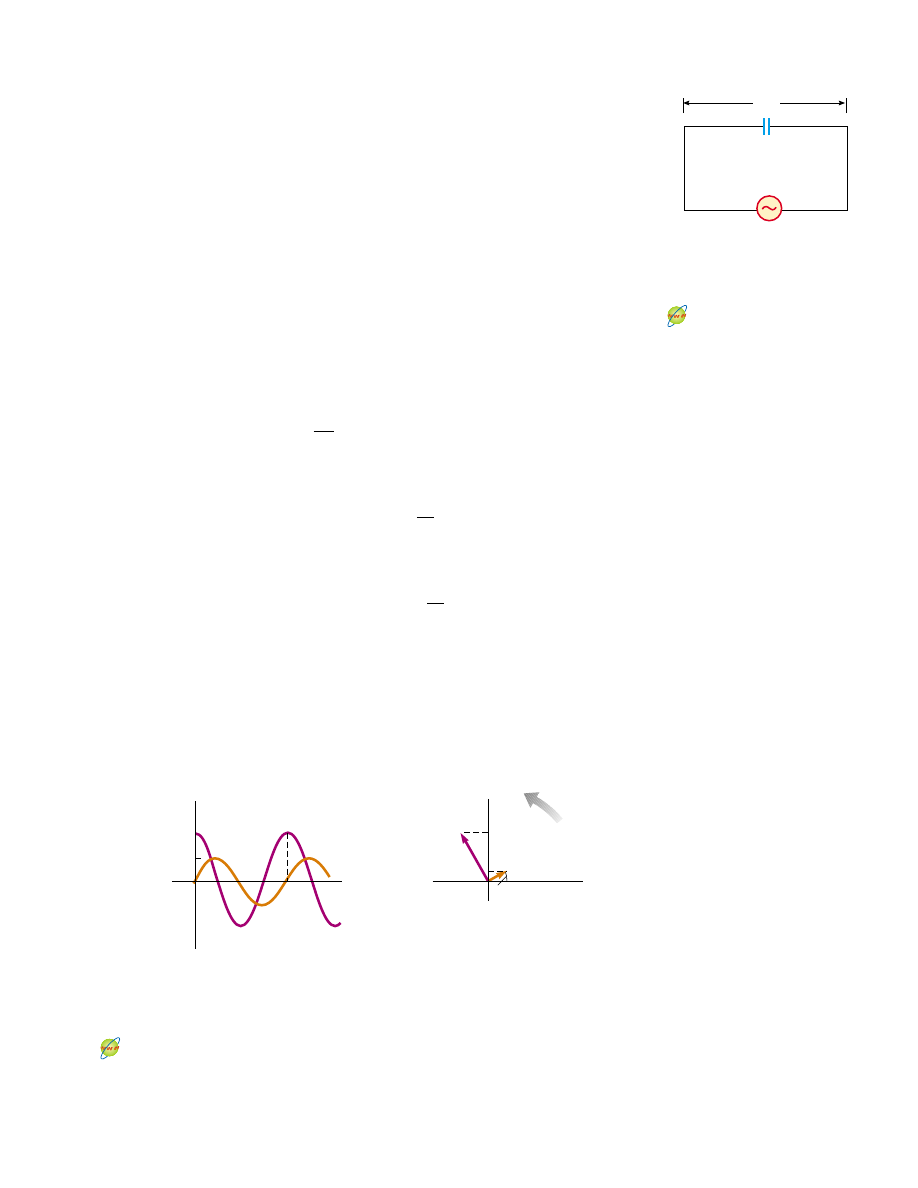
Figure 33.9 shows an AC circuit consisting of a capacitor connected across the
terminals of an AC source. Kirchhoff’s loop rule applied to this circuit gives
!
v $ !v
C
"
0, so that the magnitude of the source voltage is equal to the magni-
tude of the voltage across the capacitor:
!
v " !v
C
" !
V
max
sin #t
(33.13)
where !v
C
is the instantaneous voltage across the capacitor. We know from the defini-
tion of capacitance that C " q/!v
C
; hence, Equation 33.13 gives
q " C !V
max
sin #t
(33.14)
where q is the instantaneous charge on the capacitor. Because i " dq/dt, differ-
entiating Equation 33.14 with respect to time gives the instantaneous current in the
circuit:
(33.15)
Using the trigonometric identity
we can express Equation 33.15 in the alternative form
(33.16)
Comparing this expression with Equation 33.13, we see that the current is
%
/2 rad " 90° out of phase with the voltage across the capacitor. A plot of
current and voltage versus time (Fig. 33.10a) shows that the current reaches its
maximum value one quarter of a cycle sooner than the voltage reaches its maximum
value.
i
C
"
#
C
∆V
max
sin
"
#
t $
%
2
#
cos #t " sin
"
#
t $
%
2
#
i
C
"
dq
dt
"
#
C
∆V
max
cos #t
S E C T I O N 3 3 . 4 • Capacitors in an AC Circuit
1041
C
∆v
C
∆v = ∆V
max
sin
t
ω
Active Figure 33.9 A circuit
consisting of a capacitor of
capacitance C connected to an AC
source.
At the Active Figures link
at http://www.pse6.com, you
can adjust the capacitance, the
frequency, and the maximum
voltage. The results can be
studied with the graph and
phasor diagram in Figure 33.10.
Current in a capacitor
(a)
a
d
f
b
c
e
i
C
t
∆v
C
, i
C
I
max
∆V
max
∆v
C
T
∆v
C
∆V
max
i
C
I
max
ω
t
ω
(b)
Active Figure 33.10 (a) Plots of the instantaneous current i
C
and instantaneous
voltage !v
C
across a capacitor as functions of time. The voltage lags behind the current
by 90°. (b) Phasor diagram for the capacitive circuit, showing that the current leads the
voltage by 90°.
At the Active Figures link at http://www.pse6.com, you can adjust the
capacitance, the frequency, and the maximum voltage of the circuit in Figure
33.9. The results can be studied with the graph and phasor diagram in this
figure.