Physics For Scientists And Engineers 6E - part 262


  Index      Production     Physics For Scientists And Engineers 6E


Search            


Content   ..  260  261  262  263   ..


Physics For Scientists And Engineers 6E - part 262


S E C T I O N   3 3 . 5 •  The RLC Series Circuit

1045

(b)

V

max

φ

V

– 

V

C

V

R

(a)

ω

V

R

I

max

φ

V

L

V

C

V

max

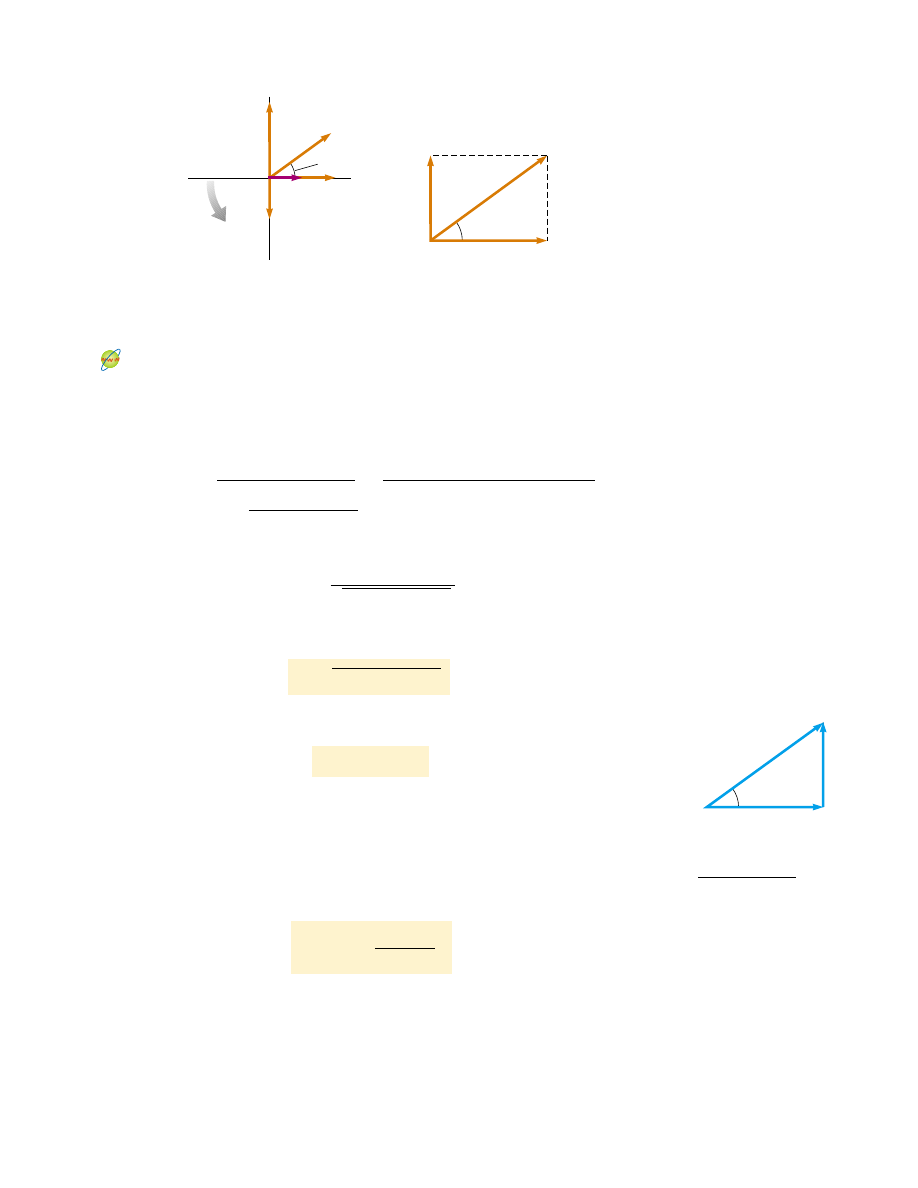
Active Figure 33.15 (a) Phasor diagram for the series RLC circuit shown in Figure

33.13a. The phasor !V

R

is in phase with the current phasor I

max

, the phasor !V

L

leads

I

max

by 90°, and the phasor !V

C

lags I

max

by 90°. The total voltage !V

max

makes an

angle 

-

with I

max

. (b) Simplified version of the phasor diagram shown in part (a).

At the Active Figures link at http://www.pse6.com, you can adjust the

resistance, the inductance, and the capacitance of the circuit in Figure 33.13a.

The results can be studied with the graphs in Figure 33.13b and the phasor

diagram in this figure.

in Figure 33.15b, we see that

(33.24)

Therefore, we can express the maximum current as

Once again, this has the same mathematical form as Equation 27.8. The denominator

of the fraction plays the role of resistance and is called the 

impedance of the circuit:

(33.25)

where impedance also has units of ohms. Therefore, we can write Equation 33.24 in
the form

(33.26)

We  can  regard  Equation  33.26  as  the  AC  equivalent  of  Equation  27.8.  Note  that  the
impedance  and  therefore  the  current  in  an  AC  circuit  depend  upon  the  resistance,
the inductance,  the  capacitance,  and  the  frequency  (because  the  reactances  are
frequency-dependent).

By removing the common factor I

max

from each phasor in Figure 33.15a, we can

construct  the  impedance  triangle shown  in  Figure  33.16.  From  this  phasor  diagram  we
find that the phase angle - between the current and the voltage is

(33.27)

Also, from Figure 33.16, we see that cos - " R/Z. When X

L

'

X

C

(which occurs at high

frequencies),  the  phase  angle  is  positive,  signifying  that  the  current  lags  behind  the
applied voltage, as in Figure 33.15a. We describe this situation by saying that the circuit
is  more  inductive  than  capacitive.  When  X

L

.

X

C

,  the  phase  angle  is  negative,  signifying

that the current leads the applied voltage, and the circuit is more capacitive than inductive.
When X

L

"

X

C

, the phase angle is zero and the circuit is purely resistive.

Table  33.1  gives  impedance  values  and  phase  angles  for  various  series  circuits

containing different combinations of elements.

- "

tan

*

"

X

L

*

X

C

R

#

V


max

"

I


max


Z

Z 

R


2

$

(X

L

*

X

C

)

2

I


max

"

V


max

R


2

$

(X

L

*

X

C

)

2

V


max

"

I


max


R

2

$

(X

L

*

X

C

)

2

V


max

"

V


2

R

$

(

V

L

*

V

C

)

2

"

(I


max

 R)

2

$

(I


max

 X

L

*

I


max

 X


C

)

2

Maximum current in an RLC

circuit

Impedance

Phase angle

Figure 33.16 An impedance

triangle for a series RLC circuit

gives the relationship
"

R

2

$

(X

L

*

X

C

)

2

.

X

– X

C

Z

φ

R

1046

C H A P T E R   3 3 •  Alternating Current Circuits

Figure 33.17 (Quick Quiz 33.7) Match the phasor diagrams to the relationships

between the reactances.

a

In each case, an AC voltage (not shown) is applied across the elements.

Circuit Elements

Impedance Z

Phase Angle 

-

Impedance Values and Phase Angles for Various Circuit-Element Combinations

a

Table 33.1

R

C

L

C

R

R

R

C

L

L

R

0/

X

C

*

90/

X

L

$

90/

Negative, between * 90/ and 0/

Positive, between 0/ and 90/

Negative if X

C

'

X

L

Positive if X

C

.

X

L

R

2

$

(X

L

*

X

C

)

2


R

2

$

X

L


2

R

2

$

X

C


2

V

max

I

max

I

max

I

max

(a)

(b)

(c)

V

max

V

max

Quick  Quiz  33.7

Label  each  part  of  Figure  33.17  as  being  X

L

'

X

C

,

X

L

"

X

C

, or X

L

.

X

C

.

Example 33.4 Finding L from a Phasor Diagram

In a series RLC circuit, the applied voltage has a maximum
value of 120 V and oscillates at a frequency of 60.0 Hz. The
circuit  contains  an  inductor  whose  inductance  can  be
varied, a 200-( resistor, and a 4.00-,F capacitor. What value
of  should  an  engineer  analyzing  the  circuit  choose  such
that the voltage across the capacitor lags the applied voltage
by 30.0°?

Solution The  phase  relationships  for  the  voltages across
the  elements  are  shown  in  Figure  33.18.  From  the  figure
we  see  that  the  phase  angle  is  - " * 60.0°. (The  phasors
representing  I

max

and !V

R

are in the  same  direction.)

From Equation 33.27, we find that

X

L

"

X

C

$

tan -

Substituting Equations 33.10 and 33.18 (with # " 2%) into
this expression gives

30.0

°

φ

V

L

V

R

V

max

V

C

Figure 33.18 (Example 33.4) The phasor diagram for the

given information.

S E C T I O N   3 3 . 6 •  Power in an AC Circuit

1047

"

1

2%f


"

1

2%f


C

$

R tan -

#

2%f


"

1

2%f


C

$

R tan -

Substituting  the  given  values  into  the  equation  gives

" 0.84 H.

Example 33.5 Analyzing a Series RLC Circuit

Solution The maximum voltages are

!

V

R

"

I

max

" (0.292 A)(425 () "

!

V

L

"

I

max

X

L

"

(0.292 A)(471 () "

!

V

C

"

I

max

X

C

"

(0.292 A)(758 () "

Using  Equations  33.21,  33.22,  and  33.23,  we  find  that  we
can  write  the  instantaneous  voltages  across  the  three
elements as

!

v

R

"

!

v

L

"

!

v

C

"

What  If?

What  if  you  added  up  the  maximum  voltages

across the three circuit elements? Is this a physically mean-
ingful quantity?

Answer The  sum  of  the  maximum  voltages  across  the
elements  is  !V

R

$ !

V

L

$ !

V

C

"

484 V.  Note  that  this

sum is  much  greater  than  the  maximum  voltage  of
the source,  150 V.  The  sum  of  the  maximum  voltages
is a meaningless  quantity  because  when  sinusoidally
varying  quantities  are  added,  both  their  amplitudes  and
their phases 
must  be  taken  into  account.  We  know  that
the maximum  voltages  across  the  various  elements
occur at  different  times.  That  is,  the  voltages  must
be added  in  a  way  that  takes  account  of  the  different
phases.

(*221 V


) cos 377t

(138 V


) cos 377t

(124 V


) sin 377t

221 V

138 V

124 V

Interactive

At the Interactive Worked Example link at http://www.pse6.com, you can investigate the RLC circuit for various values of
the circuit elements.

A  series  RLC AC  circuit  has  " 425 (,  " 1.25 H,
" 3.50 ,F, # " 377 s

*

1

, and !V

max

"

150 V.

(A)

Determine  the  inductive  reactance,  the  capacitive

reactance, and the impedance of the circuit.

Solution The  reactances  are  X

L

"

#

" 471 ( and

X

C

"

1/#" 758 (.

The impedance is

(B)

Find the maximum current in the circuit.

Solution

(C)

Find the phase angle between the current and voltage.

Solution

Because the capacitive reactance is larger than the inductive
reactance,  the  circuit  is  more  capacitive  than  inductive.  In
this case, the phase angle - is negative and the current leads
the applied voltage.

(D)

Find both the maximum voltage and the instantaneous

voltage across each element.

*


34.0/

"

- "

tan

*

"

X

L

*

X

C

R

#

"

tan

*

"

471 ( * 758 (

425 (

#

0.292 A

I


max

"

!

V


max

Z

"

150 V

513 (

"

513 (

"

(425 ()

2

$

(471 ( * 758 ()

2

"

"

R

2

$

(X

L

*

X

C


)

2

33.6 Power in an AC Circuit

Let  us  now  take  an  energy  approach  to  analyzing  AC  circuits,  considering  the
transfer of energy from the AC source to the circuit. In Example 28.1 we found that
the  power  delivered  by  a  battery  to  a  DC  circuit  is  equal  to  the  product  of  the
current  and  the  emf  of  the  battery.  Likewise,  the  instantaneous  power  delivered
by an  AC  source  to  a  circuit  is  the  product  of  the  source  current  and  the
applied voltage.  For  the  RLC circuit  shown  in  Figure  33.13a,  we  can  express  the

1048

C H A P T E R   3 3 •  Alternating Current Circuits

instantaneous power ! as

! "

!I

max

sin(#* -) !V

max

sin #t

"

I

max

!

V

max

sin #sin(#* -)

(33.28)

This result is a complicated function of time and therefore is not very useful from a
practical viewpoint. What is generally of interest is the average power over one or more
cycles.  Such  an  average  can  be  computed  by  first  using  the  trigonometric  identity
sin(#

* -) " sin #cos - * cos #sin -.  Substituting  this  into  Equation  33.28  gives

! "

I

max

!

V

max

sin

2

#

cos - * I

max

!

V

max

sin #cos #sin -

(33.29)

We  now  take  the  time  average  of  ! over  one  or  more  cycles,  noting  that  I

max

,

!

V

max

, -, and # are all constants. The time average of the first term on the right in

Equation 33.29 involves the average value of sin

2

#

t, which is  (as shown in footnote

1).  The  time  average  of  the  second  term  on  the  right  is  identically  zero  because
sin #

cos #" sin 2#t,  and  the  average  value  of  sin 2#is  zero.  Therefore,  we  can

express the 

average power !

av

as

!

av

"

I

max

!

V

max

cos -

(33.30)

It is convenient to express the average power in terms of the rms current and rms

voltage defined by Equations 33.4 and 33.5:

(33.31)

where the quantity cos - is called the 

power factor. By inspecting Figure 33.15b, we see

that the maximum voltage across the resistor is given by !V

R

" !

V

max

cos - " I

max

R.

Using  Equation  33.5  and  the  fact  that  cos - " I

max

R/!V

max

,  we  find  that  we  can 

express !

av

as

After making the substitution 

from Equation 33.4, we have

(33.32)

In  words, 

the average  power  delivered  by  the  source is  converted  to  internal

energy  in  the  resistor, just  as  in  the  case  of  a  DC  circuit.  When  the  load  is  purely
resistive, then - " 0, cos - " 1, and from Equation 33.31 we see that

!

av

"

I

rms

!

V

rms

We  find  that 

no  power  losses  are  associated  with  pure  capacitors  and  pure

inductors in an AC circuit. To see why this is true, let us first analyze the power in an
AC  circuit  containing  only  a  source  and  a  capacitor.  When  the  current  begins  to  in-
crease in one direction in an AC circuit, charge begins to accumulate on the capacitor,
and a voltage appears across it. When this voltage reaches its maximum value, the en-
ergy  stored  in  the  capacitor  is  C(!V

max

)

2

.  However,  this  energy  storage  is  only  mo-

mentary.  The  capacitor  is  charged  and  discharged  twice  during  each  cycle:  charge  is
delivered  to  the  capacitor  during  two  quarters  of  the  cycle  and  is  returned  to  the 
voltage  source  during  the  remaining  two  quarters.  Therefore, 

the  average  power 

supplied by the source is zero. In other words, no power losses occur in a capaci-
tor in an AC circuit.

Let us now consider the case of an inductor. When the current reaches its maximum

value, the energy stored in the inductor is a maximum and is given by  LI

2

max

. When

the current begins to decrease in the circuit, this stored energy is returned to the source
as the inductor attempts to maintain the current in the circuit.

1

2

1

2

!

av

"

I

2

rms

 R

I

max

"

2


I

rms

!

av

"

I


rms


V


rms

 cos - " I


rms


"

V


max

2

#


I


max

R

V


max

"

I


rms


I


max

R

2

!

av

"

I


rms


V


rms

 cos -

1

2

1

2

1

2

Average power delivered to an

RLC circuit


Content   ..  260  261  262  263   ..