Intel 64 and IA-32 Architectures. Software Developer’s Manual (Collection, 2023) - page 59

PERFORMANCE MONITORING
Table 20-59. Bit fields of the MSR_OFFCORE_RESP [0, 1] Registers (Contd.)
Main
Sub-field
Bit
Name
Description
Response Type
Any
16
ANY_RESPONSE
Account for any response.
Data Supply from
17
NO_SUPP
No Supplier Details.
Untile
18
Reserved
Reserved.
19
L2_HIT_OTHER_TILE_N
Other tile L2 hit E Near.
EAR
20
Reserved
Reserved.
21
MCDRAM_NEAR
MCDRAM Local.
22
MCDRAM_FAR_OR_L2_
MCDRAM Far or Other tile L2 hit far.
HIT_OTHER_TILE_FAR
23
DRAM_NEAR
DRAM Local.
24
DRAM_FAR
DRAM Far.
Data Supply from
25
L2_HITM_THIS_TILE
M-state.
within same tile
26
L2_HITE_THIS_TILE
E-state.
27
L2_HITS_THIS_TILE
S-state.
28
L2_HITF_THIS_TILE
F-state.
29
Reserved
Reserved.
30
Reserved
Reserved.
Snoop Info; Only
31
SNOOP_NONE
None of the cores were snooped.
Valid in case of
32
NO_SNOOP_NEEDED
No snoop was needed to satisfy the request.
Data Supply from
Untile
33
Reserved
Reserved.
34
Reserved
Reserved.
35
HIT_OTHER_TILE_FWD
Snoop request hit in the other tile with data forwarded.
36
HITM_OTHER_TILE
A snoop was needed and it HitM-ed in other core's L1 cache.
HitM denotes a cache-line was in modified state before
effect as a result of snoop.
37
NON_DRAM
Target was non-DRAM system address. This includes MMIO
transactions.
Outstanding
Weighted cycles
38
OUTSTANDING (Valid
If set, counts total number of weighted cycles of any
requests
only for
outstanding offcore requests with data response. Valid only
MSR_OFFCORE_RESP0.
for OFFCORE_RESP_0 event. Should only be used on PMC0.
Should only be used on
This bit is reserved for OFFCORE_RESP_1 event.
PMC0. This bit is
reserved for
MSR_OFFCORE_RESP1).
20.4.1.1.3
Average Offcore Request Latency Measurement
Measurement of average latency of offcore transaction requests can be enabled using MSR_OFFCORE_RSP0.[bit
38] with the choice of request type specified in MSR_OFFCORE_RSP0.[bit 15:0].
Refer to Section 20.5.2.3, “Average Offcore Request Latency Measurement,” for typical usage. Note that
MSR_OFFCORE_RESPx registers are not shared between cores in Knights Landing. This allows one core to measure
average latency while other core is measuring different offcore response events.
Vol. 3B
20-79
PERFORMANCE MONITORING
20.5
PERFORMANCE MONITORING (INTEL ATOM® PROCESSORS)
20.5.1 Performance Monitoring (45 nm and 32 nm Intel Atom® Processors)
45 nm and 32 nm Intel Atom processors report architectural performance monitoring versionID = 3 (supporting the
aggregate capabilities of versionID 1, 2, and 3; see Section 20.2.3) and a host of non-architectural monitoring
capabilities. These 45 nm and 32 nm Intel Atom processors provide two general-purpose performance counters
(IA32_PMC0, IA32_PMC1) and three fixed-function performance counters (IA32_FIXED_CTR0, IA32_FIXED_CTR1,
IA32_FIXED_CTR2).
NOTE
The number of counters available to software may vary from the number of physical counters
present on the hardware, because an agent running at a higher privilege level (e.g., a VMM) may
not expose all counters. CPUID.0AH:EAX[15:8] reports the MSRs available to software; see Section
20.2.1.
Non-architectural performance monitoring in Intel Atom processor family uses the IA32_PERFEVTSELx MSR to
configure a set of non-architecture performance monitoring events to be counted by the corresponding general-
purpose performance counter. The list of non-architectural performance monitoring events can be found at:
https://perfmon-events.intel.com/.
Architectural and non-architectural performance monitoring events in 45 nm and 32 nm Intel Atom processors
support thread qualification using bit 21 (AnyThread) of IA32_PERFEVTSELx MSR, i.e., if IA32_PERFEVT-
SELx.AnyThread =1, event counts include monitored conditions due to either logical processors in the same
processor core.
The bit fields within each IA32_PERFEVTSELx MSR are defined in Figure 20-6 and described in Section 20.2.1.1 and
Section 20.2.3.
Valid event mask (Umask) bits can be found at: https://perfmon-events.intel.com/. The UMASK field may contain
sub-fields that provide the same qualifying actions like those listed in Table 20-77, Table 20-78, Table 20-79, and
Table 20-80. One or more of these sub-fields may apply to specific events on an event-by-event basis. Precise
Event Based Monitoring is supported using IA32_PMC0 (see also Section 18.4.9, “BTS and DS Save Area”).
20.5.2 Performance Monitoring for Silvermont Microarchitecture
Intel processors based on the Silvermont microarchitecture report architectural performance monitoring versionID
= 3 (see Section 20.2.3) and a host of non-architectural monitoring capabilities. Intel processors based on the
Silvermont microarchitecture provide two general-purpose performance counters (IA32_PMC0, IA32_PMC1) and
three fixed-function performance counters (IA32_FIXED_CTR0, IA32_FIXED_CTR1, IA32_FIXED_CTR2). Intel
Atom processors based on the Airmont microarchitecture support the same performance monitoring capabilities as
those based on the Silvermont microarchitecture.
Non-architectural performance monitoring in the Silvermont microarchitecture uses the IA32_PERFEVTSELx MSR
to configure a set of non-architecture performance monitoring events to be counted by the corresponding general-
purpose performance counter. The list of non-architectural performance monitoring events can be found at:
https://perfmon-events.intel.com/.
The bit fields (except bit 21) within each IA32_PERFEVTSELx MSR are defined in Figure 20-6 and described in
Section 20.2.1.1 and Section 20.2.3. Architectural and non-architectural performance monitoring events in the
Silvermont microarchitecture ignore the AnyThread qualification regardless of its setting in IA32_PERFEVTSELx
MSR.
20.5.2.1 Enhancements of Performance Monitoring in the Processor Core
The notable enhancements in the monitoring of performance events in the processor core include:
• The width of counter reported by CPUID.0AH:EAX[23:16] is 40 bits.
20-80
Vol. 3B

PERFORMANCE MONITORING
• Off-core response counting facility. This facility in the processor core allows software to count certain
transaction responses between the processor core to sub-systems outside the processor core (uncore).
Counting off-core response requires additional event qualification configuration facility in conjunction with
IA32_PERFEVTSELx. Two off-core response MSRs are provided to use in conjunction with specific event codes
that must be specified with IA32_PERFEVTSELx.
• Average request latency measurement. The off-core response counting facility can be combined to use two
performance counters to count the occurrences and weighted cycles of transaction requests.
20.5.2.1.1 Processor Event Based Sampling (PEBS)
In the Silvermont microarchitecture, the PEBS facility can be used with precise events. PEBS is supported using
IA32_PMC0 (see also Section 18.4.9).
PEBS uses a debug store mechanism to store a set of architectural state information for the processor. The infor-
mation provides architectural state of the instruction executed after the instruction that caused the event (See
Section 20.6.2.4).
The list of precise events supported in the Silvermont microarchitecture is shown in Table 20-60.
Table 20-60. PEBS Performance Events for the Silvermont Microarchitecture
Event Name
Event Select
Sub-event
UMask
BR_INST_RETIRED
C4H
ALL_BRANCHES
00H
JCC
7EH
TAKEN_JCC
FEH
CALL
F9H
REL_CALL
FDH
IND_CALL
FBH
NON_RETURN_IND
EBH
FAR_BRANCH
BFH
RETURN
F7H
BR_MISP_RETIRED
C5H
ALL_BRANCHES
00H
JCC
7EH
TAKEN_JCC
FEH
IND_CALL
FBH
NON_RETURN_IND
EBH
RETURN
F7H
MEM_UOPS_RETIRED
04H
L2_HIT_LOADS
02H
L2_MISS_LOADS
04H
DLTB_MISS_LOADS
08H
HITM
20H
REHABQ
03H
LD_BLOCK_ST_FORWARD
01H
LD_SPLITS
08H
PEBS Record Format The PEBS record format supported by processors based on the Intel Silvermont microarchi-
tecture is shown in Table 20-61, and each field in the PEBS record is 64 bits long.
Vol. 3B
20-81

PERFORMANCE MONITORING
Table 20-61. PEBS Record Format for the Silvermont Microarchitecture
Byte Offset
Field
Byte Offset
Field
00H
R/EFLAGS
60H
R10
08H
R/EIP
68H
R11
10H
R/EAX
70H
R12
18H
R/EBX
78H
R13
20H
R/ECX
80H
R14
28H
R/EDX
88H
R15
30H
R/ESI
90H
IA32_PERF_GLOBAL_STATUS
38H
R/EDI
98H
Reserved
40H
R/EBP
A0H
Reserved
48H
R/ESP
A8H
Reserved
50H
R8
B0H
EventingRIP
58H
R9
B8H
Reserved
20.5.2.2 Offcore Response Event
Event number 0B7H support offcore response monitoring using an associated configuration MSR, MSR_OFF-
CORE_RSP0 (address 1A6H) in conjunction with UMASK value 01H or MSR_OFFCORE_RSP1 (address 1A7H) in
conjunction with UMASK value 02H. Table 20-62 lists the event code, mask value and additional off-core configura-
tion MSR that must be programmed to count off-core response events using IA32_PMCx.
In the Silvermont microarchitecture, each MSR_OFFCORE_RSPx is shared by two processor cores.
Table 20-62. OffCore Response Event Encoding
Counter
Event code
UMask
Required Off-core Response MSR
PMC0-1
B7H
01H
MSR_OFFCORE_RSP0 (address 1A6H)
PMC0-1
B7H
02H
MSR_OFFCORE_RSP1 (address 1A7H)
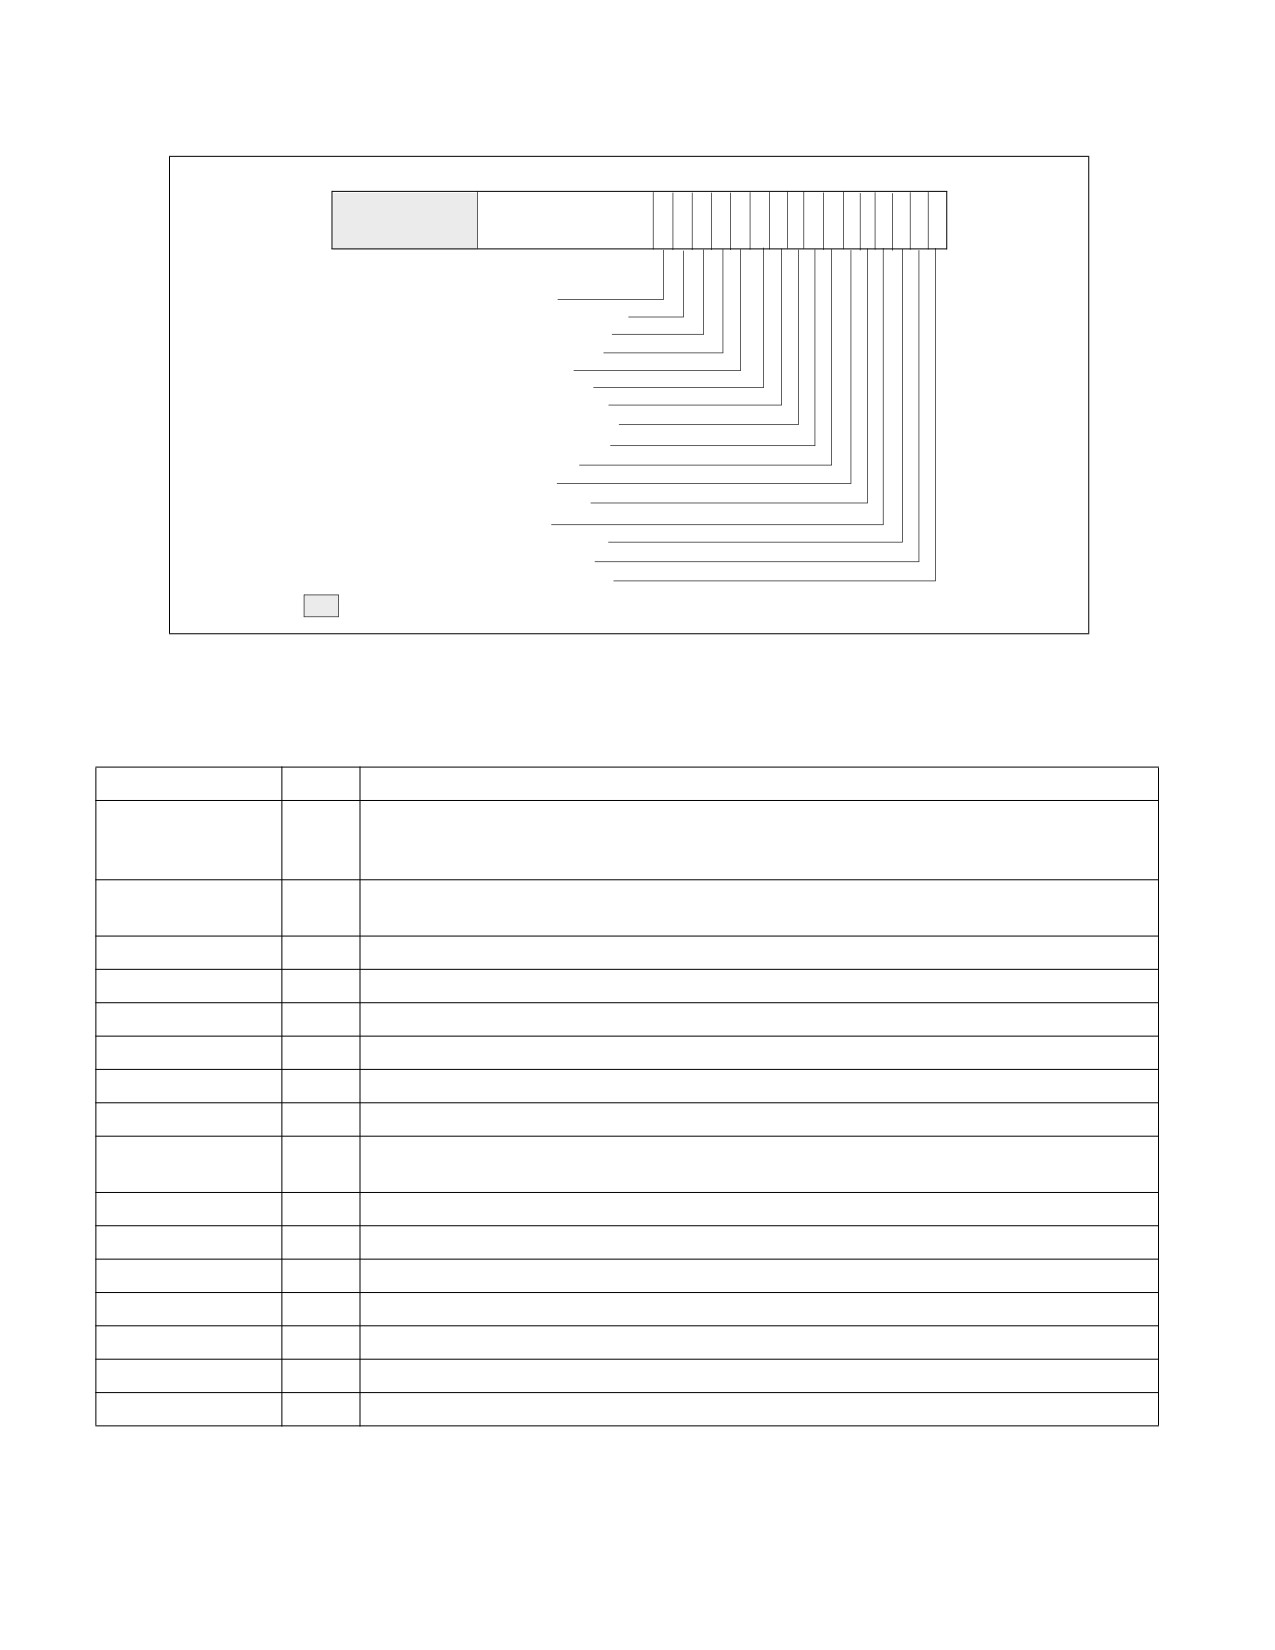
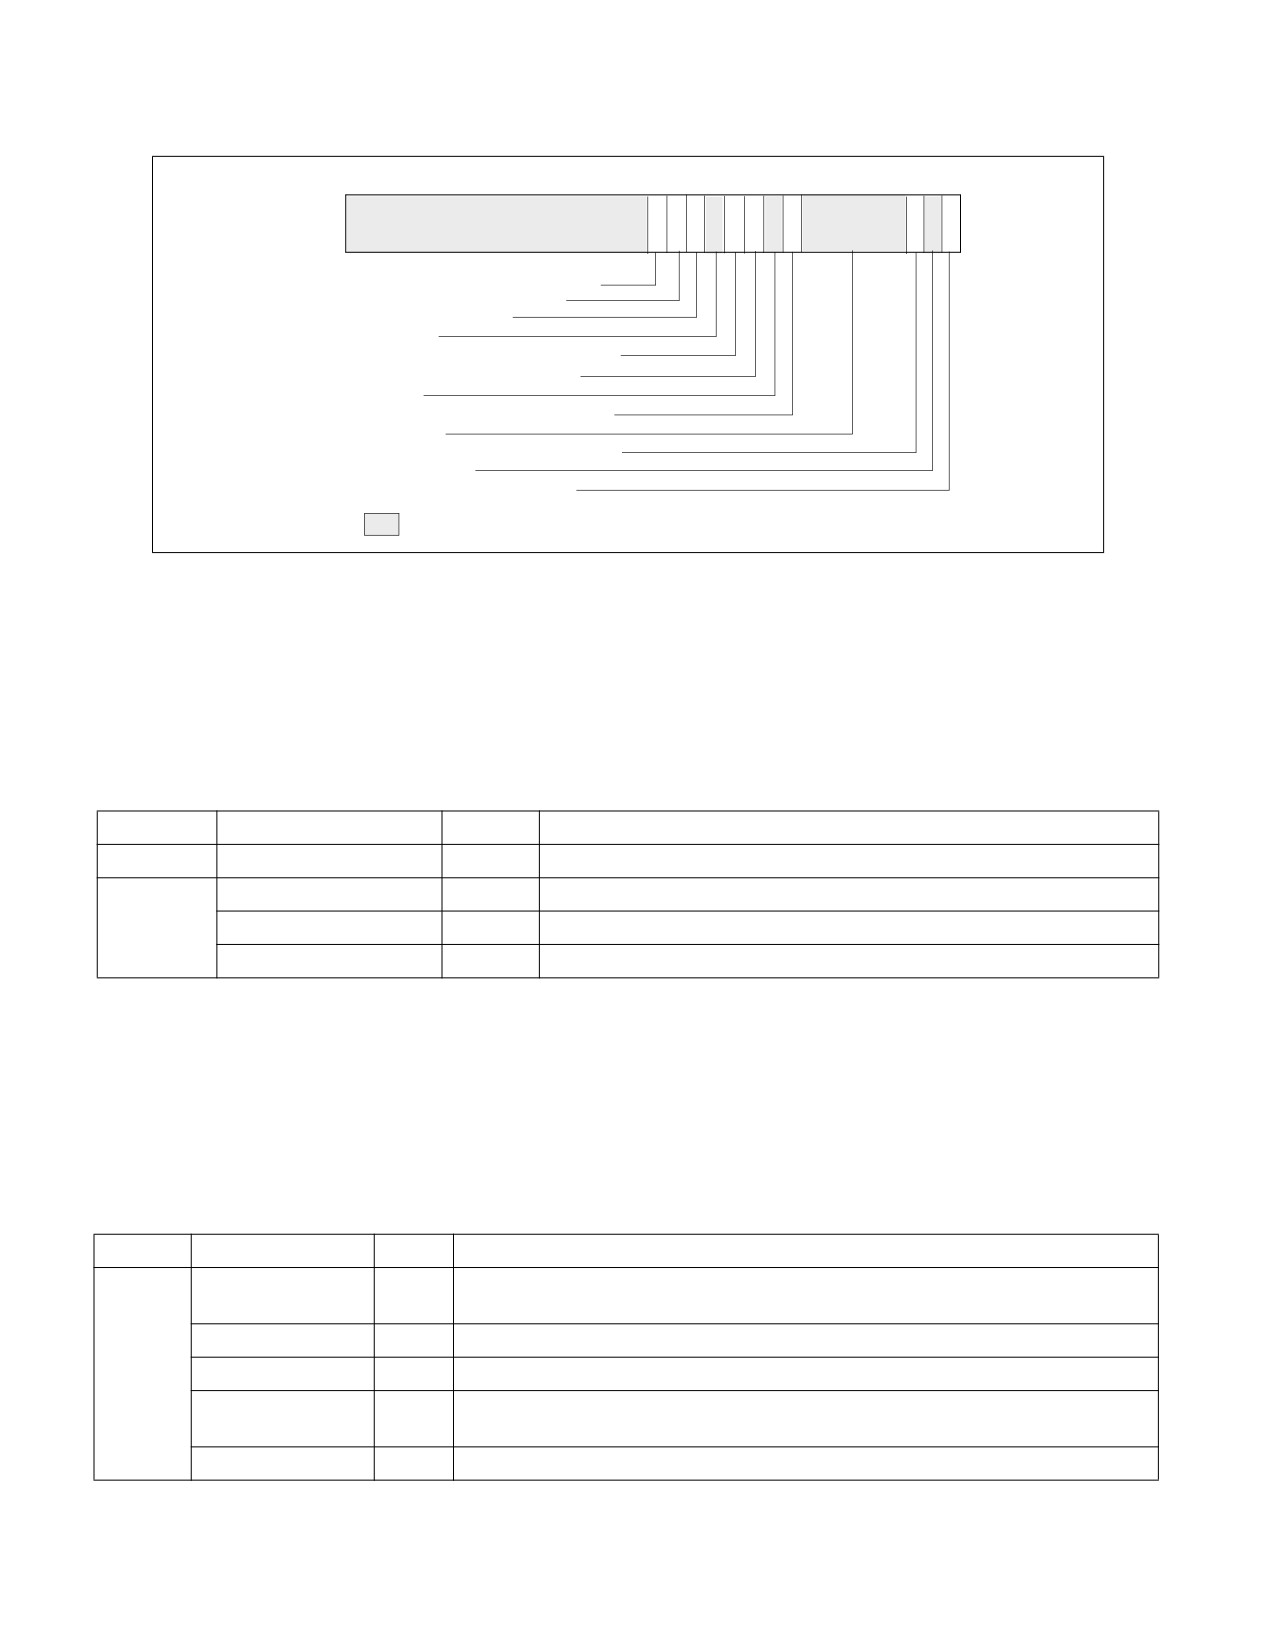
The layout of MSR_OFFCORE_RSP0 and MSR_OFFCORE_RSP1 are shown in Figure 20-40 and Figure 20-41. Bits
15:0 specifies the request type of a transaction request to the uncore. Bits 30:16 specifies supplier information,
bits 37:31 specifies snoop response information.
Additionally, MSR_OFFCORE_RSP0 provides bit 38 to enable measurement of average latency of specific type of
offcore transaction requests using two programmable counter simultaneously, see Section 20.5.2.3 for details.
20-82
Vol. 3B
PERFORMANCE MONITORING
63
37
15 14 1312 11
10
9
8 7
6
5
4
3
2
1
0
See Figure 18-30
REQUEST TYPE — Any (R/W)
REQUEST TYPE — PARTIAL_STRM_ST (R/W)
REQUEST TYPE — PF_DATA_RD (R/W)
REQUEST TYPE — SW_PREFETCH (R/W)
REQUEST TYPE — STRM_ST (R/W)
REQUEST TYPE — BUS_LOCKS (R/W)
REQUEST TYPE — UC_IFETCH (R/W)
REQUEST TYPE — PARTIAL_WRITE (R/W)
REQUEST TYPE — PARTIAL_READ (R/W)
REQUEST TYPE — PF_IFETCH (R/W)
REQUEST TYPE — PF_RFO (R/W)
REQUEST TYPE — PF_DATA_RD (R/W)
REQUEST TYPE — WB (R/W)
REQUEST TYPE — DMND_IFETCH (R/W)
REQUEST TYPE — DMND_RFO (R/W)
REQUEST TYPE — DMND_DATA_RD (R/W)
Reserved
RESET Value — 00000000_00000000H
Figure 20-40. Request_Type Fields for MSR_OFFCORE_RSPx
Table 20-63. MSR_OFFCORE_RSPx Request_Type Field Definition
Bit Name
Offset
Description
DMND_DATA_RD
0
Counts the number of demand and DCU prefetch data reads of full and partial cachelines as well as
demand data page table entry cacheline reads. Does not count L2 data read prefetches or
instruction fetches.
DMND_RFO
1
Counts the number of demand and DCU prefetch reads for ownership (RFO) requests generated by
a write to data cacheline. Does not count L2 RFO prefetches.
DMND_IFETCH
2
Counts the number of demand instruction cacheline reads and L1 instruction cacheline prefetches.
WB
3
Counts the number of writeback (modified to exclusive) transactions.
PF_DATA_RD
4
Counts the number of data cacheline reads generated by L2 prefetchers.
PF_RFO
5
Counts the number of RFO requests generated by L2 prefetchers.
PF_IFETCH
6
Counts the number of code reads generated by L2 prefetchers.
PARTIAL_READ
7
Counts the number of demand reads of partial cache lines (including UC and WC).
PARTIAL_WRITE
8
Counts the number of demand RFO requests to write to partial cache lines (includes UC, WT, and
WP).
UC_IFETCH
9
Counts the number of UC instruction fetches.
BUS_LOCKS
10
Bus lock and split lock requests.
STRM_ST
11
Streaming store requests.
SW_PREFETCH
12
Counts software prefetch requests.
PF_DATA_RD
13
Counts DCU hardware prefetcher data read requests.
PARTIAL_STRM_ST
14
Streaming store requests.
ANY
15
Any request that crosses IDI, including I/O.
Vol. 3B
20-83
PERFORMANCE MONITORING
63
38
37 36 35
34 33
32
31
22 2120
19
18
17 16
AVG LATENCY — ENABLE AVG LATENCY(R/W)
RESPONSE TYPE — NON_DRAM (R/W)
RSPNS_SNOOP — HITM (R/W)
RESERVED
RSPNS_SNOOP — SNOOP_HIT (R/W)
RSPNS_SNOOP — SNOOP_MISS (R/W)
RESERVED
RSPNS_SNOOP — SNOOP_NONE (R/W)
RESERVED
RSPNS_SUPPLIER — L2_HIT (R/W)
RESERVED
RSPNS_SUPPLIER — ANY (R/W)
Reserved
RESET Value — 00000000_00000000H
Figure 20-41. Response_Supplier and Snoop Info Fields for MSR_OFFCORE_RSPx
To properly program this extra register, software must set at least one request type bit (Table 20-63) and a valid
response type pattern (Table 20-64, Table 20-65). Otherwise, the event count reported will be zero. It is permis-
sible and useful to set multiple request and response type bits in order to obtain various classes of off-core
response events. Although MSR_OFFCORE_RSPx allow an agent software to program numerous combinations that
meet the above guideline, not all combinations produce meaningful data.
Table 20-64. MSR_OFFCORE_RSP_x Response Supplier Info Field Definition
Subtype
Bit Name
Offset
Description
Common
ANY_RESPONSE
16
Catch all value for any response types.
Supplier Info
Reserved
17
Reserved
L2_HIT
18
Cache reference hit L2 in either M/E/S states.
Reserved
30:19
Reserved
To specify a complete offcore response filter, software must properly program bits in the request and response type
fields. A valid request type must have at least one bit set in the non-reserved bits of 15:0. A valid response type
must be a non-zero value of the following expression:
ANY | [(‘OR’ of Supplier Info Bits) & (‘OR’ of Snoop Info Bits)]
If “ANY” bit is set, the supplier and snoop info bits are ignored.
Table 20-65. MSR_OFFCORE_RSPx Snoop Info Field Definition
Subtype
Bit Name
Offset
Description
Snoop
SNP_NONE
31
No details on snoop-related information.
Info
Reserved
32
Reserved
SNOOP_MISS
33
Counts the number of snoop misses when L2 misses.
SNOOP_HIT
34
Counts the number of snoops hit in the other module where no modified copies were
found.
Reserved
35
Reserved
20-84
Vol. 3B

PERFORMANCE MONITORING
Table 20-65. MSR_OFFCORE_RSPx Snoop Info Field Definition (Contd.)
Subtype
Bit Name
Offset
Description
HITM
36
Counts the number of snoops hit in the other module where modified copies were
found in other core's L1 cache.
NON_DRAM
37
Target was non-DRAM system address. This includes MMIO transactions.
AVG_LATENCY
38
Enable average latency measurement by counting weighted cycles of outstanding
offcore requests of the request type specified in bits 15:0 and any response (bits 37:16
cleared to 0).
This bit is available in MSR_OFFCORE_RESP0. The weighted cycles is accumulated in the
specified programmable counter IA32_PMCx and the occurrence of specified requests
are counted in the other programmable counter.
20.5.2.3 Average Offcore Request Latency Measurement
Average latency for offcore transactions can be determined by using both MSR_OFFCORE_RSP registers. Using two
performance monitoring counters, program the two OFFCORE_RESPONSE event encodings into the corresponding
IA32_PERFEVTSELx MSRs. Count the weighted cycles via MSR_OFFCORE_RSP0 by programming a request type in
MSR_OFFCORE_RSP0.[15:0] and setting MSR_OFFCORE_RSP0.OUTSTANDING[38] to 1, white setting the
remaining bits to 0. Count the number of requests via MSR_OFFCORE_RSP1 by programming the same request
type from MSR_OFFCORE_RSP0 into MSR_OFFCORE_RSP1[bit 15:0], and setting MSR_OFFCORE_RSP1.ANY_RE-
SPONSE[16] = 1, while setting the remaining bits to 0. The average latency can be obtained by dividing the value
of the IA32_PMCx register that counted weight cycles by the register that counted requests.
20.5.3 Performance Monitoring for Goldmont Microarchitecture
Intel Atom processors based on the Goldmont microarchitecture report architectural performance monitoring
versionID = 4 (see Section 20.2.4) and support non-architectural monitoring capabilities described in this section.
Architectural performance monitoring version 4 capabilities are described in Section 20.2.4.
The bit fields (except bit 21) within each IA32_PERFEVTSELx MSR are defined in Figure 20-6 and described in
Section 20.2.1.1 and Section 20.2.3. The Goldmont microarchitecture does not support Hyper-Threading and thus
architectural and non-architectural performance monitoring events ignore the AnyThread qualification regardless
of its setting in the IA32_PERFEVTSELx MSR. However, Goldmont does not set the AnyThread deprecation bit
(CPUID.0AH:EDX[15]).
The core PMU’s capability is similar to that of the Silvermont microarchitecture described in Section 20.5.2, with
some differences and enhancements summarized in Table 20-66.
Table 20-66. Core PMU Comparison Between the Goldmont and Silvermont Microarchitectures
Box
Goldmont Microarchitecture
Silvermont Microarchitecture
Comment
# of Fixed counters per core
3
3
Use CPUID to determine #
of counters. See Section
20.2.1.
# of general-purpose
4
2
Use CPUID to determine #
counters per core
of counters. See Section
20.2.1.
Counter width (R,W)
R:48, W: 32/48
R:40, W:32
See Section 20.2.2.
Architectural Performance
4
3
Use CPUID to determine #
Monitoring version ID
of counters. See Section
20.2.1.
Vol. 3B
20-85

PERFORMANCE MONITORING
Table 20-66. Core PMU Comparison Between the Goldmont and Silvermont Microarchitectures
Box
Goldmont Microarchitecture
Silvermont Microarchitecture
Comment
PMI Overhead Mitigation
• Freeze_Perfmon_on_PMI with
• Freeze_Perfmon_on_PMI with
See Section 18.4.7.
streamlined semantics.
legacy semantics.
Legacy semantics not
• Freeze_LBR_on_PMI with
• Freeze_LBR_on_PMI with legacy
supported with version 4
streamlined semantics for
semantics for branch profiling.
or higher.
branch profiling.
Counter and Buffer
• Query via
• Query via
See Section 20.2.4.
Overflow Status
IA32_PERF_GLOBAL_STATUS
IA32_PERF_GLOBAL_STATUS
Management
• Reset via
• Reset via
IA32_PERF_GLOBAL_STATUS_R
IA32_PERF_GLOBAL_OVF_CTRL
ESET
• Set via
IA32_PERF_GLOBAL_STATUS_S
ET
IA32_PERF_GLOBAL_STATU
• Individual counter overflow
• Individual counter overflow
See Section 20.2.4.
S Indicators of
• PEBS buffer overflow
• PEBS buffer overflow
• ToPA buffer overflow
Overflow/Overhead/Interfer
• CTR_Frz, LBR_Frz
ence
Enable control in
• CTR_Frz,
No
See Section 20.2.4.1.
IA32_PERF_GLOBAL_STATU
• LBR_Frz
S
Perfmon Counter In-Use
Query IA32_PERF_GLOBAL_INUSE
No
See Section 20.2.4.3.
Indicator
Processor Event Based
General-Purpose Counter 0 only.
See Section 20.5.2.1.1. General-
IA32_PMC0 only.
Sampling (PEBS) Events
Supports all events (precise and
Purpose Counter 0 only. Only
non-precise). Precise events are
supports precise events (see
listed in Table 20-67.
Table 20-60).
PEBS record format
0011b
0010b
encoding
Reduce skid PEBS
IA32_PMC0 only
No
Data Address Profiling
Yes
No
PEBS record layout
Table 20-68; enhanced fields at
Table 20-61.
offsets 90H- 98H; and TSC record
field at C0H.
PEBS EventingIP
Yes
Yes
Off-core Response Event
MSR 1A6H and 1A7H, each core
MSR 1A6H and 1A7H, shared by a
Nehalem supports 1A6H
has its own register.
pair of cores.
only.
20.5.3.1 Processor Event Based Sampling (PEBS)
Processor event based sampling (PEBS) on the Goldmont microarchitecture is enhanced over prior generations
with respect to sampling support of precise events and non-precise events. In the Goldmont microarchitecture,
PEBS is supported using IA32_PMC0 for all events (see Section 18.4.9).
PEBS uses a debug store mechanism to store a set of architectural state information for the processor at the time
the sample was generated.
Precise events work the same way on Goldmont microarchitecture as on the Silvermont microarchitecture. The
record will be generated after an instruction that causes the event when the counter is already overflowed and will
capture the architectural state at this point (see Section 20.6.2.4 and Section 18.4.9). The eventingIP in the record
will indicate the instruction that caused the event. The list of precise events supported in the Goldmont microarchi-
tecture is shown in Table 20-67.
20-86
Vol. 3B

PERFORMANCE MONITORING
In the Goldmont microarchitecture, the PEBS facility also supports the use of non-precise events to record
processor state information into PEBS records with the same format as with precise events.
However, a non-precise event may not be attributable to a particular retired instruction or the time of instruction
execution. When the counter overflows, a PEBS record will be generated at the next opportunity. Consider the
event ICACHE.HIT. When the counter overflows, the processor is fetching future instructions. The PEBS record will
be generated at the next opportunity and capture the state at the processor's current retirement point. It is likely
that the instruction fetch that caused the event to increment was beyond that current retirement point. Other
examples of non-precise events are CPU_CLK_UNHALTED.CORE_P and HARDWARE_INTERRUPTS.RECEIVED.
CPU_CLK_UNHALTED.CORE_P will increment each cycle that the processor is awake. When the counter over-flows,
there may be many instructions in various stages of execution. Additionally, zero, one or multiple instructions may
be retired the cycle that the counter overflows. HARDWARE_INTERRUPTS.RECEIVED increments independent of
any instructions being executed. For all non-precise events, the PEBS record will be generated at the next oppor-
tunity, after the counter has overflowed. The PEBS facility thus allows for identification of the instructions which
were executing when the event overflowed.
After generating a record for a non-precise event, the PEBS facility reloads the counter and resumes execution, just
as is done for precise events. Unlike interrupt-based sampling, which requires an interrupt service routine to collect
the sample and reload the counter, the PEBS facility can collect samples even when interrupts are masked and
without using NMI. Since a PEBS record is generated immediately when a counter for a non-precise event is
enabled, it may also be generated after an overflow is set by an MSR write to IA32_PERF_GLOBAL_STATUS_SET.
Table 20-67. Precise Events Supported by the Goldmont Microarchitecture
Event Name
Event Select
Sub-event
UMask
LD_BLOCKS
03H
DATA_UNKNOWN
01H
STORE_FORWARD
02H
4K_ALIAS
04H
UTLB_MISS
08H
ALL_BLOCK
10H
MISALIGN_MEM_REF
13H
LOAD_PAGE_SPLIT
02H
STORE_PAGE_SPLIT
04H
INST_RETIRED
C0H
ANY
00H
UOPS_RETITRED
C2H
ANY
00H
LD_SPLITSMS
01H
BR_INST_RETIRED
C4H
ALL_BRANCHES
00H
JCC
7EH
TAKEN_JCC
FEH
CALL
F9H
REL_CALL
FDH
IND_CALL
FBH
NON_RETURN_IND
EBH
FAR_BRANCH
BFH
RETURN
F7H
BR_MISP_RETIRED
C5H
ALL_BRANCHES
00H
JCC
7EH
TAKEN_JCC
FEH
IND_CALL
FBH
NON_RETURN_IND
EBH
RETURN
F7H
Vol. 3B
20-87

PERFORMANCE MONITORING
Table 20-67. Precise Events Supported by the Goldmont Microarchitecture (Contd.)
Event Name
Event Select
Sub-event
UMask
MEM_UOPS_RETIRED
D0H
ALL_LOADS
81H
ALL_STORES
82H
ALL
83H
DLTB_MISS_LOADS
11H
DLTB_MISS_STORES
12H
DLTB_MISS
13H
MEM_LOAD_UOPS_RETIRED
D1H
L1_HIT
01H
L2_HIT
02H
L1_MISS
08H
L2_MISS
10H
HITM
20H
WCB_HIT
40H
DRAM_HIT
80H
The PEBS record format supported by processors based on the Goldmont microarchitecture is shown in
Table 20-68, and each field in the PEBS record is 64 bits long.
Table 20-68. PEBS Record Format for the Goldmont Microarchitecture
Byte Offset
Field
Byte Offset
Field
00H
R/EFLAGS
68H
R11
08H
R/EIP
70H
R12
10H
R/EAX
78H
R13
18H
R/EBX
80H
R14
20H
R/ECX
88H
R15
28H
R/EDX
90H
Applicable Counters
30H
R/ESI
98H
Data Linear Address
38H
R/EDI
A0H
Reserved
40H
R/EBP
A8H
Reserved
48H
R/ESP
B0H
EventingRIP
50H
R8
B8H
Reserved
58H
R9
C0H
TSC
60H
R10
On Goldmont microarchitecture, all 64 bits of architectural registers are written into the PEBS record regardless of
processor mode.
With PEBS record format encoding 0011b, offset 90H reports the “Applicable Counter” field, which indicates which
counters actually requested generating a PEBS record. This allows software to correlate the PEBS record entry
properly with the instruction that caused the event even when multiple counters are configured to record PEBS
records and multiple bits are set in the field. Additionally, offset C0H captures a snapshot of the TSC that provides
a time line annotation for each PEBS record entry.
20-88
Vol. 3B

PERFORMANCE MONITORING
20.5.3.1.1 PEBS Data Linear Address Profiling
Goldmont supports the Data Linear Address field introduced in Haswell. It does not support the Data Source
Encoding or Latency Value fields that are also part of Data Address Profiling; those fields are present in the record
but are reserved.
For Goldmont microarchitecture, the Data Linear Address field will record the linear address of memory accesses in
the previous instruction (e.g., the one that triggered a precise event that caused the PEBS record to be generated).
Goldmont microarchitecture may record a Data Linear Address for the instruction that caused the event even for
events not related to memory accesses. This may differ from other microarchitectures.
20.5.3.1.2 Reduced Skid PEBS
Processors based on Goldmont Plus microarchitecture support the Reduced Skid PEBS feature described in Section
20.9.4 on the IA32_PMC0 counter. Although Extended PEBS adds support for generating PEBS records for precise
events on additional general-purpose and fixed-function performance counters, those counters do not support the
Reduced Skid PEBS feature.
20.5.3.1.3 Enhancements to IA32_PERF_GLOBAL_STATUS.OvfDSBuffer[62]
In addition to IA32_PERF_GLOBAL_STATUS.OvfDSBuffer[62] being set when PEBS_Index reaches the PEBS_Inter-
rupt_Theshold, the bit is also set when PEBS_Index is out of bounds. That is, the bit will be set when PEBS_Index
< PEBS_Buffer_Base or PEBS_Index > PEBS_Absolute_Maximum. Note that when an out of bound condition is
encountered, the overflow bits in IA32_PERF_GLOBAL_STATUS will be cleared according to Applicable Counters,
however the IA32_PMCx values will not be reloaded with the Reset values stored in the DS_AREA.
20.5.3.2 Offcore Response Event
Event number 0B7H support offcore response monitoring using an associated configuration MSR, MSR_OFF-
CORE_RSP0 (address 1A6H) in conjunction with UMASK value 01H or MSR_OFFCORE_RSP1 (address 1A7H) in
conjunction with UMASK value 02H. Table 20-62 lists the event code, mask value and additional off-core configu-
ration MSR that must be programmed to count off-core response events using IA32_PMCx.
The Goldmont microarchitecture provides unique pairs of MSR_OFFCORE_RSPx registers per core.
The layout of MSR_OFFCORE_RSP0 and MSR_OFFCORE_RSP1 are organized as follows:
• Bits 15:0 specifies the request type of a transaction request to the uncore. This is described in Table 20-69.
• Bits 30:16 specifies common supplier information or an L2 Hit, and is described in Table 20-64.
• If L2 misses, then Bits 37:31 can be used to specify snoop response information and is described in
Table 20-70.
• For outstanding requests, bit 38 can enable measurement of average latency of specific type of offcore
transaction requests using two programmable counter simultaneously; see Section 20.5.2.3 for details.
Table 20-69. MSR_OFFCORE_RSPx Request_Type Field Definition
Bit Name
Offset
Description
DEMAND_DATA_RD
0
Counts cacheline read requests due to demand reads (excludes prefetches).
DEMAND_RFO
1
Counts cacheline read for ownership (RFO) requests due to demand writes (excludes
prefetches).
DEMAND_CODE_RD
2
Counts demand instruction cacheline and I-side prefetch requests that miss the
instruction cache.
COREWB
3
Counts writeback transactions caused by L1 or L2 cache evictions.
PF_L2_DATA_RD
4
Counts data cacheline reads generated by hardware L2 cache prefetcher.
PF_L2_RFO
5
Counts reads for ownership (RFO) requests generated by L2 prefetcher.
Reserved
6
Reserved.
Vol. 3B
20-89

PERFORMANCE MONITORING
Table 20-69. MSR_OFFCORE_RSPx Request_Type Field Definition (Contd.)
Bit Name
Offset
Description
PARTIAL_READS
7
Counts demand data partial reads, including data in uncacheable (UC) or uncacheable
(WC) write combining memory types.
PARTIAL_WRITES
8
Counts partial writes, including uncacheable (UC), write through (WT) and write
protected (WP) memory type writes.
UC_CODE_READS
9
Counts code reads in uncacheable (UC) memory region.
BUS_LOCKS
10
Counts bus lock and split lock requests.
FULL_STREAMING_STORES
11
Counts full cacheline writes due to streaming stores.
SW_PREFETCH
12
Counts cacheline requests due to software prefetch instructions.
PF_L1_DATA_RD
13
Counts data cacheline reads generated by hardware L1 data cache prefetcher.
PARTIAL_STREAMING_STORES
14
Counts partial cacheline writes due to streaming stores.
ANY_REQUEST
15
Counts requests to the uncore subsystem.
To properly program this extra register, software must set at least one request type bit (Table 20-63) and a valid
response type pattern (either Table 20-64 or Table 20-70). Otherwise, the event count reported will be zero. It is
permissible and useful to set multiple request and response type bits in order to obtain various classes of off-core
response events. Although MSR_OFFCORE_RSPx allow an agent software to program numerous combinations that
meet the above guideline, not all combinations produce meaningful data.
Table 20-70. MSR_OFFCORE_RSPx For L2 Miss and Outstanding Requests
Subtype
Bit Name
Offset
Description
L2_MISS
Reserved
32:31
Reserved
(Snoop Info)
L2_MISS.SNOOP_MISS_O
33
A true miss to this module, for which a snoop request missed the other module or
R_NO_SNOOP_NEEDED
no snoop was performed/needed.
L2_MISS.HIT_OTHER_CO
34
A snoop hit in the other processor module, but no data forwarding is required.
RE_NO_FWD
Reserved
35
Reserved
L2_MISS.HITM_OTHER_C
36
Counts the number of snoops hit in the other module or other core's L1 where
ORE
modified copies were found.
L2_MISS.NON_DRAM
37
Target was a non-DRAM system address. This includes MMIO transactions.
Outstanding
OUTSTANDING
38
Counts weighted cycles of outstanding offcore requests of the request type
requests1
specified in bits 15:0, from the time the XQ receives the request and any
response is received. Bits 37:16 must be set to 0. This bit is only available in
MSR_OFFCORE_RESP0.
NOTES:
1. See Section 20.5.2.3, “Average Offcore Request Latency Measurement,” for details on how to use this bit to extract average latency.
To specify a complete offcore response filter, software must properly program bits in the request and response type
fields. A valid request type must have at least one bit set in the non-reserved bits of 15:0. A valid response type
must be a non-zero value of the following expression:
Any_Response Bit | L2 Hit | ‘OR’ of Snoop Info Bits | Outstanding Bit
20.5.3.3 Average Offcore Request Latency Measurement
In Goldmont microarchitecture, measurement of average latency of offcore transaction requests is the same as
described in Section 20.5.2.3.
20-90
Vol. 3B

PERFORMANCE MONITORING
20.5.4 Performance Monitoring for Goldmont Plus Microarchitecture
Intel Atom processors based on the Goldmont Plus microarchitecture report architectural performance monitoring
versionID = 4 and support non-architectural monitoring capabilities described in this section.
Architectural performance monitoring version 4 capabilities are described in Section 20.2.4.
Goldmont Plus performance monitoring capabilities are similar to Goldmont capabilities. The differences are in
specific events and in which counters support PEBS. Goldmont Plus introduces the ability for fixed performance
monitoring counters to generate PEBS records.
Goldmont Plus will set the AnyThread deprecation CPUID bit (CPUID.0AH:EDX[15]) to indicate that the Any-Thread
bits in IA32_PERFEVTSELx and IA32_FIXED_CTR_CTRL have no effect.
The core PMU's capability is similar to that of the Goldmont microarchitecture described in Section 20.6.3, with
some differences and enhancements summarized in Table 20-71.
Table 20-71. Core PMU Comparison Between the Goldmont Plus and Goldmont Microarchitectures
Box
Goldmont Plus Microarchitecture
Goldmont Microarchitecture
Comment
# of Fixed counters per core
3
3
Use CPUID to determine #
of counters. See Section
20.2.1.
# of general-purpose
4
4
Use CPUID to determine #
counters per core
of counters. See Section
20.2.1.
Counter width (R,W)
R:48, W: 32/48
R:48, W: 32/48
No change.
Architectural Performance
4
4
No change.
Monitoring version ID
Processor Event Based
All General-Purpose and Fixed
General-Purpose Counter 0 only.
Goldmont Plus supports
Sampling (PEBS) Events
counters. Each General-Purpose
Supports all events (precise and
PEBS on all counters.
counter supports all events (precise
non-precise). Precise events are
and non-precise).
listed in Table 20-67.
PEBS record format
0011b
0011b
No change.
encoding
20.5.4.1 Extended PEBS
The PEBS facility in Goldmont Plus microarchitecture provides a number of enhancements relative to PEBS in
processors from previous generations. Enhancement of PEBS facility with the Extended PEBS feature are de-
scribed in detail in section 18.9.
20.5.5 Performance Monitoring for Tremont Microarchitecture
Intel Atom processors based on the Tremont microarchitecture report architectural performance monitoring
versionID = 5 and support non-architectural monitoring capabilities described in this section.
Architectural performance monitoring version 5 capabilities are described in Section 20.2.5.
Tremont performance monitoring capabilities are similar to Goldmont Plus capabilities, with the following exten-
sions:
• Support for Adaptive PEBS.
• Support for PEBS output to Intel® Processor Trace.
• Precise Distribution support on Fixed Counter0.
• Compatibility enhancements to off-core response MSRs, MSR_OFFCORE_RSPx.
Vol. 3B
20-91

PERFORMANCE MONITORING
The differences and enhancements between Tremont microarchitecture and Goldmont Plus microarchitecture are
summarized in Table 20-72.
Table 20-72. Core PMU Comparison Between the Tremont and Goldmont Plus Microarchitectures
Box
Tremont Microarchitecture
Goldmont Plus Microarchitecture
Comment
# of fixed counters per core
3
3
Use CPUID to determine #
of counters. See Section
20.2.1.
# of general-purpose
4
4
Use CPUID to determine #
counters per core
of counters. See Section
20.2.1.
Counter width (R,W)
R:48, W: 32/48
R:48, W: 32/48
No change. See Section
20.2.2.
Architectural Performance
5
4
Monitoring version ID
PEBS record format
0100b
0011b
See Section 20.6.2.4.2.
encoding
Reduce skid PEBS
IA32_PMC0 and IA32_FIXED_CTR0
IA32_PMC0 only
Extended PEBS
Yes
Yes
See Section 20.5.4.1.
Adaptive PEBS
Yes
No
See Section 20.9.2.
PEBS output
DS Save Area or Intel® Processor
DS Save Area only
See Section 20.5.5.2.1.
Trace
PEBS record layout
See Section 20.9.2.3 for output to
Table 20-68; enhanced fields at
DS, Section 20.5.5.2.2 for output to
offsets 90H- 98H; and TSC record
Intel PT.
field at C0H.
Off-core Response Event
MSR 1A6H and 1A7H, each core
MSR 1A6H and 1A7H, each core has
has its own register, extended
its own register.
request and response types.
20.5.5.1 Adaptive PEBS
The PEBS record format and configuration interface has changed versus Goldmont Plus, as the Tremont microarchi-
tecture includes support for the configurable Adaptive PEBS records; see Section 20.9.2.
20.5.5.2 PEBS output to Intel® Processor Trace
Intel Atom processors based on the Tremont microarchitecture introduce the following Precise Event-Based
Sampling (PEBS) extensions:
• A mechanism to direct PEBS output into the Intel® Processor Trace (Intel® PT) output stream. In this scenario,
the PEBS record is written in packetized form, in order to co-exist with other Intel PT trace data.
• New Performance Monitoring counter reload MSRs, which are used by PEBS in place of the counter reload
values stored in the DS Management area when PEBS output is directed into the Intel PT output stream.
Processors that indicate support for Intel PT by setting CPUID.07H.0.EBX[25]=1, and set the new IA32_PERF_CA-
PABILITIES.PEBS_OUTPUT_PT_AVAIL[16] bit, support these extensions.
20.5.5.2.1 PEBS Configuration
PEBS output to Intel Processor Trace includes support for two new fields in IA32_PEBS_ENABLE.
20-92
Vol. 3B

PERFORMANCE MONITORING
Table 20-73. New Fields in IA32_PEBS_ENABLE
Field
Description
PMI_AFTER_EACH_RECORD[60]
Pend a PerfMon Interrupt (PMI) after each PEBS event.
PEBS_OUTPUT[62:61]
Specifies PEBS output destination. Encodings:
00B: DS Save Area. Matches legacy PEBS behavior, output location defined by IA32_DS_AREA.
01B: Intel PT trace output.
10B: Reserved.
11B: Reserved.
When PEBS_OUTPUT is set to 01B, the DS Management Area is not used and need not be configured. Instead, the
output mechanism is configured through IA32_RTIT_CTL and other Intel PT MSRs, while counter reload values are
configured in the MSR_RELOAD_PMCx MSRs. Details on configuring Intel PT can be found in Section 33.2.7.
63 62 61 60
n
32 31
m
1
0
● ● ●
● ● ●
PEBS_OUTPUT (R/W)
PMI_AFTER_EACH_RECORD (R/W)
PEBS_EN_FIXEDn (R/W)
PEBS_EN_FIXED1 (R/W)
PEBS_EN_FIXED0 (R/W)
PEBS_EN_PMCm (R/W)
PEBS_EN_PMC1 (R/W)
PEBS_EN_PMC0 (R/W)
Reserved
RESET Value - 00000000 _00000000 H
Figure 20-42. IA32_PEBS_ENABLE MSR with PEBS Output to Intel® Processor Trace
20.5.5.2.2 PEBS Record Format in Intel® Processor Trace
The format of the PEBS record changes when output to Intel PT, as the PEBS state is packetized. Each PEBS
grouping is emitted as a Block Begin (BBP) and following Block Item (BIP) packets. A PEBS grouping ends when
either a new PEBS grouping begins (indicated by a BBP packet) or a Block End (BEP) packet is encountered. See
Section 33.4.1.1 for details of these Intel PT packets.
Because the packet headers describe the state held in the packet payload, PEBS state ordering is not fixed. PEBS
state groupings may be emitted in any order, and the PEBS state elements within those groupings may be emitted
in any order. Further, there is no packet that provides indication of “Record Format” or “Record Size”.
If Intel PT tracing is not enabled (IA32_RTIT_STATUS.TriggerEn=0), any PEBS records triggered will be dropped.
PEBS packets do not depend on ContextEn or FilterEn in IA32_RTIT_STATUS, any filtering of PEBS must be enabled
from within the PerfMon configuration. Counter reload will occur in all scenarios where PEBS is triggered, regard-
less of TriggerEn.
Vol. 3B
20-93

PERFORMANCE MONITORING
The PEBS threshold mechanism for generating PerfMon Interrupts (PMIs) is not available in this mode. However,
there exist other means to generate PMIs based on PEBS output. When the Intel PT ToPA output mechanism is
chosen, a PMI can optionally be pended when a ToPA region is filled; see Section 33.2.7.2 for details. Further, soft-
ware can opt to generate a PMI on each PEBS record by setting the new IA32_PEBS_EN-
ABLE.PMI_AFTER_EACH_RECORD[60] bit.
The IA32_PERF_GLOBAL_STATUS.OvfDSBuffer bit will not be set in this mode.
20.5.5.2.3 PEBS Counter Reload
When PEBS output is directed into Intel PT (IA32_PEBS_ENABLE.PEBS_OUTPUT = 01B), new MSR_RELOAD_PMCx
MSRs are used by the PEBS routine to reload PerfMon counters. The value from the associated reload MSR will be
loaded to the appropriate counter on each PEBS event.
20.5.5.3 Precise Distribution Support on Fixed Counter 0
The Tremont microarchitecture supports the PDIR (Precise Distribution of Retired Instructions) facility, as described
in Section 20.3.4.4.4, on Fixed Counter 0. Fixed Counter 0 counts the INST_RETIRED.ALL event. PEBS skid for
Fixed Counter 0 will be precisely one instruction.
This is in addition to the reduced skid PEBS behavior on IA32_PMC0; see Section 20.5.3.1.2.
20.5.5.4 Compatibility Enhancements to Offcore Response MSRs
The Off-core Response facility is similar to that described in Section 20.5.3.2.
The layout of MSR_OFFCORE_RSP0 and MSR_OFFCORE_RSP1 are organized as shown below. RequestType bits are
defined in Table 20-74, ResponseType bits in Table 20-75, and SnoopInfo bits in Table 20-76.
Table 20-74. MSR_OFFCORE_RSPx Request Type Definition
Bit Name
Offset
Description
DEMAND_DATA_RD
0
Counts demand data reads.
DEMAND_RFO
1
Counts all demand reads for ownership (RFO) requests and software based
prefetches for exclusive ownership (prefetchw).
DEMAND_CODE_RD
2
Counts demand instruction fetches and L1 instruction cache prefetches.
COREWB_M
3
Counts modified write backs from L1 and L2.
HWPF_L2_DATA_RD
4
Counts prefetch (that bring data to L2) data reads.
HWPF_L2_RFO
5
Counts all prefetch (that bring data to L2) RFOs.
HWPF_L2_CODE_RD
6
Counts all prefetch (that bring data to L2 only) code reads.
Reserved
9:7
Reserved.
HWPF_L1D_AND_SWPF
10
Counts L1 data cache hardware prefetch requests, read for ownership prefetch
requests and software prefetch requests (except prefetchw).
STREAMING_WR
11
Counts all streaming stores.
COREWB_NONM
12
Counts non-modified write backs from L2.
Reserved
14:13
Reserved.
OTHER
15
Counts miscellaneous requests, such as I/O accesses that have any response type.
UC_RD
44
Counts uncached memory reads (PRd, UCRdF).
UC_WR
45
Counts uncached memory writes (WiL).
PARTIAL_STREAMING_WR
46
Counts partial (less than 64 byte) streaming stores (WCiL).
FULL_STREAMING_WR
47
Counts full, 64 byte streaming stores (WCiLF).
20-94
Vol. 3B

PERFORMANCE MONITORING
Table 20-74. MSR_OFFCORE_RSPx Request Type Definition (Contd.)
Bit Name
Offset
Description
L1WB_M
48
Counts modified WriteBacks from L1 that miss the L2.
L2WB_M
49
Counts modified WriteBacks from L2.
Table 20-75. MSR_OFFCORE_RSPx Response Type Definition
Bit Name
Offset
Description
ANY_RESPONSE
16
Catch all value for any response types.
L3_HIT_M
18
LLC/L3 Hit - M-state.
L3_HIT_E
19
LLC/L3 Hit - E-state.
L3_HIT_S
20
LLC/L3 Hit - S-state.
L3_HIT_F
21
LLC/L3 Hit - I-state.
LOCAL_DRAM
26
LLC/L3 Miss, DRAM Hit.
OUTSTANDING
63
Average latency of outstanding requests with the other counter counting number
of occurrences; can also can be used to count occupancy.
Table 20-76. MSR_OFFCORE_RSPx Snoop Info Definition
Bit Name
Offset
Description
SNOOP_NONE
31
None of the cores were snooped.
• LLC miss and Dram data returned directly to the core.
SNOOP_NOT_NEEDED
32
No snoop needed to satisfy the request.
• LLC hit and CV bit(s) (core valid) was not set.
• LLC miss and Dram data returned directly to the core.
SNOOP_MISS
33
A snoop was sent but missed.
• LLC hit and CV bit(s) was set but snoop missed (silent data drop in core), data
returned from LLC.
• LLC miss and Dram data returned directly to the core.
SNOOP_HIT_NO_FWD
34
A snoop was sent but no data forward.
• LLC hit and CV bit(s) was set but no data forward from the core, data returned
from LLC.
• LLC miss and Dram data returned directly to the core.
SNOOP_HIT_WITH_FWD
35
A snoop was sent and non-modified data was forward.
• LLC hit and CV bit(s) was set, non-modified data was forward from core.
SNOOP_HITM
36
A snoop was sent and modified data was forward.
• LLC hit E or M and the CV bit(s) was set, modified data was forward from core.
NON_DRAM_BIT
37
Target was non-DRAM system address, MMIO access.
• LLC miss and Non-Dram data returned.
Vol. 3B
20-95

PERFORMANCE MONITORING
The Off-core Response capability behaves as follows:
• To specify a complete offcore response filter, software must properly program at least one RequestType and one
ResponseType. A valid request type must have at least one bit set in the non-reserved bits of 15:0 or 49:44. A
valid response type must be a non-zero value of one the following expressions:
• Read requests:
Any_Response Bit | (‘OR’ of Supplier Info Bits) ‘AND’ ( ‘OR’ of Snoop Info Bits) | Outstanding Bit
• Write requests:
Any_Response Bit | (‘OR’ of Supplier Info Bits) | Outstanding Bit
• When the ANY_RESPONSE bit in the ResponseType is set, all other response type bits will be ignored.
• True Demand Cacheable Loads include neither L1 Prefetches nor Software Prefetches.
• Bits 15:0 and Bits 49:44 specifies the request type of a transaction request to the uncore. This is described in
Table 20-74.
• Bits 30:16 specifies common supplier information.
•
“Outstanding Requests” (bit 63) is only available on MSR_OFFCORE_RSP0; a #GP fault will occur if software
attempts to write a 1 to this bit in MSR_OFFCORE_RSP1. It is mutually exclusive with any ResponseType.
Software must guarantee that all other ResponseType bits are set to 0 when the “Outstanding Requests” bit is
set.
•
“Outstanding Requests” bit 63 can enable measurement of the average latency of a specific type of off-core
transaction; two programmable counters must be used simultaneously and the RequestType programming for
MSR_OFFCORE_RSP0 and MSR_OFFCORE_RSP1 must be the same when using this Average Latency feature.
See Section 20.5.2.3 for further details.
20.6
PERFORMANCE MONITORING (LEGACY INTEL PROCESSORS)
20.6.1 Performance Monitoring (Intel® Core™ Solo and Intel® Core™ Duo Processors)
In Intel Core Solo and Intel Core Duo processors, non-architectural performance monitoring events are
programmed using the same facilities (see Figure 20-1) used for architectural performance events.
Non-architectural performance events use event select values that are model-specific. Event mask (Umask) values
are also specific to event logic units. Some microarchitectural conditions detectable by a Umask value may have
specificity related to processor topology (see Section 9.6, “Detecting Hardware Multi-Threading Support and
Topology,” in the Intel® 64 and IA-32 Architectures Software Developer’s Manual, Volume 3A). As a result, the unit
mask field (for example, IA32_PERFEVTSELx[bits 15:8]) may contain sub-fields that specify topology information
of processor cores.
The sub-field layout within the Umask field may support two-bit encoding that qualifies the relationship between a
microarchitectural condition and the originating core. This data is shown in Table 20-77. The two-bit encoding for
core-specificity is only supported for a subset of Umask values (see: https://perfmon-events.intel.com/ ) and for
Intel Core Duo processors. Such events are referred to as core-specific events.
Table 20-77. Core Specificity Encoding within a Non-Architectural Umask
IA32_PERFEVTSELx MSRs
Bit 15:14 Encoding
Description
11B
All cores
10B
Reserved
01B
This core
00B
Reserved
20-96
Vol. 3B

PERFORMANCE MONITORING
Some microarchitectural conditions allow detection specificity only at the boundary of physical processors. Some
bus events belong to this category, providing specificity between the originating physical processor (a bus agent)
versus other agents on the bus. Sub-field encoding for agent specificity is shown in Table 20-78.
Table 20-78. Agent Specificity Encoding within a Non-Architectural Umask
IA32_PERFEVTSELx MSRs
Bit 13 Encoding
Description
0
This agent
1
Include all agents
Some microarchitectural conditions are detectable only from the originating core. In such cases, unit mask does
not support core-specificity or agent-specificity encodings. These are referred to as core-only conditions.
Some microarchitectural conditions allow detection specificity that includes or excludes the action of hardware
prefetches. A two-bit encoding may be supported to qualify hardware prefetch actions. Typically, this applies only
to some L2 or bus events. The sub-field encoding for hardware prefetch qualification is shown in Table 20-79.
Table 20-79. HW Prefetch Qualification Encoding within a Non-Architectural Umask
IA32_PERFEVTSELx MSRs
Bit 13:12 Encoding
Description
11B
All inclusive
10B
Reserved
01B
Hardware prefetch only
00B
Exclude hardware prefetch
Some performance events may (a) support none of the three event-specific qualification encodings (b) may
support core-specificity and agent specificity simultaneously (c) or may support core-specificity and hardware
prefetch qualification simultaneously. Agent-specificity and hardware prefetch qualification are mutually exclusive.
In addition, some L2 events permit qualifications that distinguish cache coherent states. The sub-field definition for
cache coherency state qualification is shown in Table 20-80. If no bits in the MESI qualification sub-field are set for
an event that requires setting MESI qualification bits, the event count will not increment.
Table 20-80. MESI Qualification Definitions within a Non-Architectural Umask
IA32_PERFEVTSELx MSRs
Bit Position 11:8
Description
Bit 11
Counts modified state
Bit 10
Counts exclusive state
Bit 9
Counts shared state
Bit 8
Counts Invalid state
20.6.2 Performance Monitoring (Processors Based on Intel® Core™ Microarchitecture)
In addition to architectural performance monitoring, processors based on the Intel Core microarchitecture support
non-architectural performance monitoring events.
Architectural performance events can be collected using general-purpose performance counters. Non-architectural
performance events can be collected using general-purpose performance counters (coupled with two IA32_PERFE-
VTSELx MSRs for detailed event configurations), or fixed-function performance counters (see Section 20.6.2.1).
IA32_PERFEVTSELx MSRs are architectural; their layout is shown in Figure 20-1. Starting with Intel Core 2
Vol. 3B
20-97

PERFORMANCE MONITORING
processor T 7700, fixed-function performance counters and associated counter control and status MSR becomes
part of architectural performance monitoring version 2 facilities (see also Section 20.2.2).
Non-architectural performance events in processors based on Intel Core microarchitecture use event select values
that are model-specific. Valid event mask (Umask) bits can be found at: https://perfmon-events.intel.com/. The
UMASK field may contain sub-fields identical to those listed in Table 20-77, Table 20-78, Table 20-79, and
Table 20-80. One or more of these sub-fields may apply to specific events on an event-by-event basis.
In addition, the UMASK filed may also contain a sub-field that allows detection specificity related to snoop
responses. Bits of the snoop response qualification sub-field are defined in Table 20-81.
Table 20-81. Bus Snoop Qualification Definitions within a Non-Architectural Umask
IA32_PERFEVTSELx MSRs
Bit Position 11:8
Description
Bit 11
HITM response
Bit 10
Reserved
Bit 9
HIT response
Bit 8
CLEAN response
There are also non-architectural events that support qualification of different types of snoop operation. The corre-
sponding bit field for snoop type qualification are listed in Table 20-82.
Table 20-82. Snoop Type Qualification Definitions within a Non-Architectural Umask
IA32_PERFEVTSELx MSRs
Bit Position 9:8
Description
Bit 9
CMP2I snoops
Bit 8
CMP2S snoops
No more than one sub-field of MESI, snoop response, and snoop type qualification sub-fields can be supported in a
performance event.
NOTE
Software must write known values to the performance counters prior to enabling the counters. The
content of general-purpose counters and fixed-function counters are undefined after INIT or RESET.
20.6.2.1 Fixed-function Performance Counters
Processors based on Intel Core microarchitecture provide three fixed-function performance counters. Bits beyond
the width of the fixed counter are reserved and must be written as zeros. Model-specific fixed-function performance
counters on processors that support Architectural Perfmon version 1 are 40 bits wide.
Each of the fixed-function counter is dedicated to count a pre-defined performance monitoring events. See Table
20-2 for details of the PMC addresses and what these events count.
Programming the fixed-function performance counters does not involve any of the IA32_PERFEVTSELx MSRs, and
does not require specifying any event masks. Instead, the MSR IA32_FIXED_CTR_CTRL provides multiple sets of
4-bit fields; each 4-bit field controls the operation of a fixed-function performance counter (PMC). See Figures
20-43. Two sub-fields are defined for each control. See Figure 20-43; bit fields are:
• Enable field (low 2 bits in each 4-bit control) — When bit 0 is set, performance counting is enabled in the
corresponding fixed-function performance counter to increment when the target condition associated with the
architecture performance event occurs at ring 0.
20-98
Vol. 3B

PERFORMANCE MONITORING
When bit 1 is set, performance counting is enabled in the corresponding fixed-function performance counter to
increment when the target condition associated with the architecture performance event occurs at ring greater
than 0.
Writing 0 to both bits stops the performance counter. Writing 11B causes the counter to increment irrespective
of privilege levels.
63
12 11
9 8 7
5 4 3 2 1 0
P
P
P
E
E
E
M
M
M
N
N
N
I
I
I
Cntr2 — Controls for IA32_FIXED_CTR2
Cntr1 — Controls for IA32_FIXED_CTR1
PMI — Enable PMI on overflow
Cntr0 — Controls for IA32_FIXED_CTR0
ENABLE — 0: disable; 1: OS; 2: User; 3: All ring levels
Reserved
SDM30265
Figure 20-43. Layout of IA32_FIXED_CTR_CTRL MSR
• PMI field (fourth bit in each 4-bit control) — When set, the logical processor generates an exception
through its local APIC on overflow condition of the respective fixed-function counter.
20.6.2.2 Global Counter Control Facilities
Processors based on Intel Core microarchitecture provides simplified performance counter control that simplifies
the most frequent operations in programming performance events, i.e., enabling/disabling event counting and
checking the status of counter overflows. This is done by the following three MSRs:
• MSR_PERF_GLOBAL_CTRL enables/disables event counting for all or any combination of fixed-function PMCs
(IA32_FIXED_CTRx) or general-purpose PMCs via a single WRMSR.
• MSR_PERF_GLOBAL_STATUS allows software to query counter overflow conditions on any combination of
fixed-function PMCs (IA32_FIXED_CTRx) or general-purpose PMCs via a single RDMSR.
• MSR_PERF_GLOBAL_OVF_CTRL allows software to clear counter overflow conditions on any combination of
fixed-function PMCs (IA32_FIXED_CTRx) or general-purpose PMCs via a single WRMSR.
MSR_PERF_GLOBAL_CTRL MSR provides single-bit controls to enable counting in each performance counter (see
Figure 20-44). Each enable bit in MSR_PERF_GLOBAL_CTRL is AND’ed with the enable bits for all privilege levels in
the respective IA32_PERFEVTSELx or IA32_FIXED_CTR_CTRL MSRs to start/stop the counting of respective
counters. Counting is enabled if the AND’ed results is true; counting is disabled when the result is false.
Vol. 3B
20-99

PERFORMANCE MONITORING
63
3534333231
2 10
FIXED_CTR2 enable
FIXED_CTR1 enable
FIXED_CTR0 enable
PMC1 enable
PMC0 enable
Reserved
Figure 20-44. Layout of MSR_PERF_GLOBAL_CTRL MSR
MSR_PERF_GLOBAL_STATUS MSR provides single-bit status used by software to query the overflow condition of
each performance counter. MSR_PERF_GLOBAL_STATUS[bit 62] indicates overflow conditions of the DS area data
buffer. MSR_PERF_GLOBAL_STATUS[bit 63] provides a CondChgd bit to indicate changes to the state of perfor-
mance monitoring hardware (see Figure 20-45). A value of 1 in bits 34:32, 1, 0 indicates an overflow condition has
occurred in the associated counter.
6362
3534333231
2 10
CondChgd
OvfBuffer
FIXED_CTR2 Overflow
FIXED_CTR1 Overflow
FIXED_CTR0 Overflow
PMC1 Overflow
PMC0 Overflow
Reserved
Figure 20-45. Layout of MSR_PERF_GLOBAL_STATUS MSR
When a performance counter is configured for PEBS, an overflow condition in the counter will arm PEBS. On the
subsequent event following overflow, the processor will generate a PEBS event. On a PEBS event, the processor will
perform bounds checks based on the parameters defined in the DS Save Area (see Section 18.4.9). Upon
successful bounds checks, the processor will store the data record in the defined buffer area, clear the counter
overflow status, and reload the counter. If the bounds checks fail, the PEBS will be skipped entirely. In the event
that the PEBS buffer fills up, the processor will set the OvfBuffer bit in MSR_PERF_GLOBAL_STATUS.
MSR_PERF_GLOBAL_OVF_CTL MSR allows software to clear overflow the indicators for general-purpose or fixed-
function counters via a single WRMSR (see Figure 20-46). Clear overflow indications when:
• Setting up new values in the event select and/or UMASK field for counting or interrupt-based event sampling.
• Reloading counter values to continue collecting next sample.
• Disabling event counting or interrupt-based event sampling.
20-100
Vol. 3B

PERFORMANCE MONITORING
6362
3534333231
2 10
ClrCondChgd
ClrOvfBuffer
FIXED_CTR2 ClrOverflow
FIXED_CTR1 ClrOverflow
FIXED_CTR0 ClrOverflow
PMC1 ClrOverflow
PMC0 ClrOverflow
Reserved
Figure 20-46. Layout of MSR_PERF_GLOBAL_OVF_CTRL MSR
20.6.2.3 At-Retirement Events
Many non-architectural performance events are impacted by the speculative nature of out-of-order execution. A
subset of non-architectural performance events on processors based on Intel Core microarchitecture are enhanced
with a tagging mechanism (similar to that found in Intel NetBurst® microarchitecture) that exclude contributions
that arise from speculative execution. The at-retirement events available in processors based on Intel Core
microarchitecture does not require special MSR programming control (see Section 20.6.3.6, “At-Retirement
Counting”), but is limited to IA32_PMC0. See Table 20-83 for a list of events available to processors based on Intel
Core microarchitecture.
Table 20-83. At-Retirement Performance Events for Intel Core Microarchitecture
Event Name
UMask
Event Select
ITLB_MISS_RETIRED
00H
C9H
MEM_LOAD_RETIRED.L1D_MISS
01H
CBH
MEM_LOAD_RETIRED.L1D_LINE_MISS
02H
CBH
MEM_LOAD_RETIRED.L2_MISS
04H
CBH
MEM_LOAD_RETIRED.L2_LINE_MISS
08H
CBH
MEM_LOAD_RETIRED.DTLB_MISS
10H
CBH
20.6.2.4 Processor Event Based Sampling (PEBS)
Processors based on Intel Core microarchitecture also support processor event based sampling (PEBS). This
feature was introduced by processors based on Intel NetBurst microarchitecture.
PEBS uses a debug store mechanism and a performance monitoring interrupt to store a set of architectural state
information for the processor. The information provides architectural state of the instruction executed after the
instruction that caused the event (See Section 20.6.2.4.2 and Section 18.4.9).
In cases where the same instruction causes BTS and PEBS to be activated, PEBS is processed before BTS are
processed. The PMI request is held until the processor completes processing of PEBS and BTS.
For processors based on Intel Core microarchitecture, precise events that can be used with PEBS are listed in
Table 20-84. The procedure for detecting availability of PEBS is the same as described in Section 20.6.3.8.1.
Vol. 3B
20-101

PERFORMANCE MONITORING
Table 20-84. PEBS Performance Events for Intel Core Microarchitecture
Event Name
UMask
Event Select
INSTR_RETIRED.ANY_P
00H
C0H
X87_OPS_RETIRED.ANY
FEH
C1H
BR_INST_RETIRED.MISPRED
00H
C5H
SIMD_INST_RETIRED.ANY
1FH
C7H
MEM_LOAD_RETIRED.L1D_MISS
01H
CBH
MEM_LOAD_RETIRED.L1D_LINE_MISS
02H
CBH
MEM_LOAD_RETIRED.L2_MISS
04H
CBH
MEM_LOAD_RETIRED.L2_LINE_MISS
08H
CBH
MEM_LOAD_RETIRED.DTLB_MISS
10H
CBH
20.6.2.4.1 Setting up the PEBS Buffer
For processors based on Intel Core microarchitecture, PEBS is available using IA32_PMC0 only. Use the following
procedure to set up the processor and IA32_PMC0 counter for PEBS:
1. Set up the precise event buffering facilities. Place values in the precise event buffer base, precise event index,
precise event absolute maximum, precise event interrupt threshold, and precise event counter reset fields of
the DS buffer management area. In processors based on Intel Core microarchitecture, PEBS records consist of
64-bit address entries. See Figure 18-8 to set up the precise event records buffer in memory.
2. Enable PEBS. Set the Enable PEBS on PMC0 flag (bit 0) in IA32_PEBS_ENABLE MSR.
3. Set up the IA32_PMC0 performance counter and IA32_PERFEVTSEL0 for an event listed in Table 20-84.
20.6.2.4.2 PEBS Record Format
The PEBS record format may be extended across different processor implementations. The IA32_PERF_CAPABI-
LITES MSR defines a mechanism for software to handle the evolution of PEBS record format in processors that
support architectural performance monitoring with version ID equals 2 or higher. The bit fields of IA32_PERF_CA-
PABILITES are defined in Table 2-2 of Chapter 2, “Model-Specific Registers (MSRs)‚” in the Intel® 64 and IA-32
Architectures Software Developer’s Manual, Volume 4. The relevant bit fields that governs PEBS are:
• PEBSTrap [bit 6]: When set, PEBS recording is trap-like. After the PEBS-enabled counter has overflowed, PEBS
record is recorded for the next PEBS-able event at the completion of the sampled instruction causing the PEBS
event. When clear, PEBS recording is fault-like. The PEBS record is recorded before the sampled instruction
causing the PEBS event.
• PEBSSaveArchRegs [bit 7]: When set, PEBS will save architectural register and state information according to
the encoded value of the PEBSRecordFormat field. When clear, only the return instruction pointer and flags are
recorded. On processors based on Intel Core microarchitecture, this bit is always 1.
• PEBSRecordFormat [bits 11:8]: Valid encodings are:
— 0000B: Only general-purpose registers, instruction pointer and RFLAGS registers are saved in each PEBS
record (See Section 20.6.3.8).
— 0001B: PEBS record includes additional information of IA32_PERF_GLOBAL_STATUS and load latency data.
(See Section 20.3.1.1.1).
— 0010B: PEBS record includes additional information of IA32_PERF_GLOBAL_STATUS, load latency data,
and TSX tuning information. (See Section 20.3.6.2).
— 0011B: PEBS record includes additional information of load latency data, TSX tuning information, TSC data,
and the applicable counter field replaces IA32_PERF_GLOBAL_STATUS at offset 90H. (See Section
20.3.8.1.1).
— 0100B: PEBS record contents are defined by elections in MSR_PEBS_DATA_CFG. (See Section 20.9.2.3).
The PEBS Configuration Buffer is defined as shown in Figure 20-64 with Counter Reset fields allocation for
8 general-purpose counters followed by 4 fixed-function counters.
20-102
Vol. 3B

PERFORMANCE MONITORING
— 0101B: PEBS record contents are defined by elections in MSR_PEBS_DATA_CFG. (See Section 20.9.2.3).
The PEBS Configuration Buffer is defined as shown in Figure 20-64 with Counter Reset fields allocation for
32 general-purpose counters followed by 16 fixed-function counters.
20.6.2.4.3 Writing a PEBS Interrupt Service Routine
The PEBS facilities share the same interrupt vector and interrupt service routine (called the DS ISR) with the Inter-
rupt-based event sampling and BTS facilities. To handle PEBS interrupts, PEBS handler code must be included in
the DS ISR. See Section 18.4.9.1, “64 Bit Format of the DS Save Area,” for guidelines when writing the DS ISR.
The service routine can query MSR_PERF_GLOBAL_STATUS to determine which counter(s) caused of overflow
condition. The service routine should clear overflow indicator by writing to MSR_PERF_GLOBAL_OVF_CTL.
A comparison of the sequence of requirements to program PEBS for processors based on Intel Core and Intel
NetBurst microarchitectures is listed in Table 20-85.
Table 20-85. Requirements to Program PEBS
For Processors based on Intel Core
For Processors based on Intel NetBurst
microarchitecture
microarchitecture
Verify PEBS support of
• IA32_MISC_ENABLE.EMON_AVAILABE (bit 7) is set.
processor/OS.
• IA32_MISC_ENABLE.PEBS_UNAVAILABE (bit 12) is clear.
Ensure counters are in disabled.
On initial set up or changing event configurations,
Optional
write MSR_PERF_GLOBAL_CTRL MSR (38FH) with 0.
On subsequent entries:
• Clear all counters if “Counter Freeze on PMI“ is not
enabled.
• If IA32_DebugCTL.Freeze is enabled, counters are
automatically disabled.
Counters MUST be stopped before writing.1
Disable PEBS.
Clear ENABLE PMC0 bit in IA32_PEBS_ENABLE MSR
Optional
(3F1H).
Check overflow conditions.
Check MSR_PERF_GLOBAL_STATUS MSR (38EH)
Check OVF flag of each CCCR for overflow
handle any overflow conditions.
condition
Clear overflow status.
Clear MSR_PERF_GLOBAL_STATUS MSR (38EH)
Clear OVF flag of each CCCR.
using IA32_PERF_GLOBAL_OVF_CTRL MSR (390H).
Write “sample-after“ values.
Configure the counter(s) with the sample after value.
Configure specific counter
• Set local enable bit 22 - 1.
• Set appropriate OVF_PMI bits - 1.
configuration MSR.
• Do NOT set local counter PMI/INT bit, bit 20 - 0.
• Only CCCR for MSR_IQ_COUNTER4
• Event programmed must be PEBS capable.
support PEBS.
Allocate buffer for PEBS states.
Allocate a buffer in memory for the precise information.
Program the IA32_DS_AREA MSR.
Program the IA32_DS_AREA MSR.
Configure the PEBS buffer
Configure the PEBS buffer management records in the DS buffer management area.
management records.
Configure/Enable PEBS.
Set Enable PMC0 bit in IA32_PEBS_ENABLE MSR
Configure MSR_PEBS_ENABLE,
(3F1H).
MSR_PEBS_MATRIX_VERT, and
MSR_PEBS_MATRIX_HORZ as needed.
Enable counters.
Set Enable bits in MSR_PERF_GLOBAL_CTRL MSR
Set each CCCR enable bit 12 - 1.
(38FH).
NOTES:
1. Counters read while enabled are not guaranteed to be precise with event counts that occur in timing proximity to the RDMSR.
Vol. 3B
20-103

PERFORMANCE MONITORING
20.6.2.4.4 Re-configuring PEBS Facilities
When software needs to reconfigure PEBS facilities, it should allow a quiescent period between stopping the prior
event counting and setting up a new PEBS event. The quiescent period is to allow any latent residual PEBS records
to complete its capture at their previously specified buffer address (provided by IA32_DS_AREA).
20.6.3 Performance Monitoring (Processors Based on Intel NetBurst® Microarchitecture)
The performance monitoring mechanism provided in processors based on Intel NetBurst microarchitecture is
different from that provided in the P6 family and Pentium processors. While the general concept of selecting,
filtering, counting, and reading performance events through the WRMSR, RDMSR, and RDPMC instructions is
unchanged, the setup mechanism and MSR layouts are incompatible with the P6 family and Pentium processor
mechanisms. Also, the RDPMC instruction has been extended to support faster reading of counters and to read all
performance counters available in processors based on Intel NetBurst microarchitecture.
The event monitoring mechanism consists of the following facilities:
• The IA32_MISC_ENABLE MSR, which indicates the availability in an Intel 64 or IA-32 processor of the
performance monitoring and processor event-based sampling (PEBS) facilities.
• Event selection control (ESCR) MSRs for selecting events to be monitored with specific performance counters.
The number available differs by family and model (43 to 45).
•
18 performance counter MSRs for counting events.
•
18 counter configuration control (CCCR) MSRs, with one CCCR associated with each performance counter.
CCCRs sets up an associated performance counter for a specific method of counting.
• A debug store (DS) save area in memory for storing PEBS records.
• The IA32_DS_AREA MSR, which establishes the location of the DS save area.
• The debug store (DS) feature flag (bit 21) returned by the CPUID instruction, which indicates the availability of
the DS mechanism.
• The MSR_PEBS_ENABLE MSR, which enables the PEBS facilities and replay tagging used in at-retirement event
counting.
• A set of predefined events and event metrics that simplify the setting up of the performance counters to count
specific events.
Table 20-86 lists the performance counters and their associated CCCRs, along with the ESCRs that select events to
be counted for each performance counter. Predefined event metrics and events can be found at: https://perfmon-
events.intel.com/.
Table 20-86. Performance Counter MSRs and Associated CCCR and ESCR MSRs
(Processors Based on Intel NetBurst Microarchitecture)
Counter
CCCR
ESCR
Name
No.
Addr
Name
Addr
Name
No.
Addr
MSR_BPU_COUNTER0
0
300H
MSR_BPU_CCCR0
360H
MSR_BSU_ESCR0
7
3A0H
MSR_FSB_ESCR0
6
3A2H
MSR_MOB_ESCR0
2
3AAH
MSR_PMH_ESCR0
4
3ACH
MSR_BPU_ESCR0
0
3B2H
MSR_IS_ESCR0
1
3B4H
MSR_ITLB_ESCR0
3
3B6H
MSR_IX_ESCR0
5
3C8H
20-104
Vol. 3B

PERFORMANCE MONITORING
Table 20-86. Performance Counter MSRs and Associated CCCR and ESCR MSRs
(Processors Based on Intel NetBurst Microarchitecture) (Contd.)
Counter
CCCR
ESCR
Name
No.
Addr
Name
Addr
Name
No.
Addr
MSR_BPU_COUNTER1
1
301H
MSR_BPU_CCCR1
361H
MSR_BSU_ESCR0
7
3A0H
MSR_FSB_ESCR0
6
3A2H
MSR_MOB_ESCR0
2
3AAH
MSR_PMH_ESCR0
4
3ACH
MSR_BPU_ESCR0
0
3B2H
MSR_IS_ESCR0
1
3B4H
MSR_ITLB_ESCR0
3
3B6H
MSR_IX_ESCR0
5
3C8H
MSR_BPU_COUNTER2
2
302H
MSR_BPU_CCCR2
362H
MSR_BSU_ESCR1
7
3A1H
MSR_FSB_ESCR1
6
3A3H
MSR_MOB_ESCR1
2
3ABH
MSR_PMH_ESCR1
4
3ADH
MSR_BPU_ESCR1
0
3B3H
MSR_IS_ESCR1
1
3B5H
MSR_ITLB_ESCR1
3
3B7H
MSR_IX_ESCR1
5
3C9H
MSR_BPU_COUNTER3
3
303H
MSR_BPU_CCCR3
363H
MSR_BSU_ESCR1
7
3A1H
MSR_FSB_ESCR1
6
3A3H
MSR_MOB_ESCR1
2
3ABH
MSR_PMH_ESCR1
4
3ADH
MSR_BPU_ESCR1
0
3B3H
MSR_IS_ESCR1
1
3B5H
MSR_ITLB_ESCR1
3
3B7H
MSR_IX_ESCR1
5
3C9H
MSR_MS_COUNTER0
4
304H
MSR_MS_CCCR0
364H
MSR_MS_ESCR0
0
3C0H
MSR_TBPU_ESCR0
2
3C2H
MSR_TC_ESCR0
1
3C4H
MSR_MS_COUNTER1
5
305H
MSR_MS_CCCR1
365H
MSR_MS_ESCR0
0
3C0H
MSR_TBPU_ESCR0
2
3C2H
MSR_TC_ESCR0
1
3C4H
MSR_MS_COUNTER2
6
306H
MSR_MS_CCCR2
366H
MSR_MS_ESCR1
0
3C1H
MSR_TBPU_ESCR1
2
3C3H
MSR_TC_ESCR1
1
3C5H
MSR_MS_COUNTER3
7
307H
MSR_MS_CCCR3
367H
MSR_MS_ESCR1
0
3C1H
MSR_TBPU_ESCR1
2
3C3H
MSR_TC_ESCR1
1
3C5H
MSR_FLAME_COUNTER0
8
308H
MSR_FLAME_CCCR0
368H
MSR_FIRM_ESCR0
1
3A4H
MSR_FLAME_ESCR0
0
3A6H
MSR_DAC_ESCR0
5
3A8H
MSR_SAAT_ESCR0
2
3AEH
MSR_U2L_ESCR0
3
3B0H
MSR_FLAME_COUNTER1
9
309H
MSR_FLAME_CCCR1
369H
MSR_FIRM_ESCR0
1
3A4H
MSR_FLAME_ESCR0
0
3A6H
MSR_DAC_ESCR0
5
3A8H
MSR_SAAT_ESCR0
2
3AEH
MSR_U2L_ESCR0
3
3B0H
MSR_FLAME_COUNTER2
10
30AH
MSR_FLAME_CCCR2
36AH
MSR_FIRM_ESCR1
1
3A5H
MSR_FLAME_ESCR1
0
3A7H
MSR_DAC_ESCR1
5
3A9H
MSR_SAAT_ESCR1
2
3AFH
MSR_U2L_ESCR1
3
3B1H
MSR_FLAME_COUNTER3
11
30BH
MSR_FLAME_CCCR3
36BH
MSR_FIRM_ESCR1
1
3A5H
MSR_FLAME_ESCR1
0
3A7H
MSR_DAC_ESCR1
5
3A9H
MSR_SAAT_ESCR1
2
3AFH
MSR_U2L_ESCR1
3
3B1H
Vol. 3B
20-105

PERFORMANCE MONITORING
Table 20-86. Performance Counter MSRs and Associated CCCR and ESCR MSRs
(Processors Based on Intel NetBurst Microarchitecture) (Contd.)
Counter
CCCR
ESCR
Name
No.
Addr
Name
Addr
Name
No.
Addr
MSR_IQ_COUNTER0
12
30CH
MSR_IQ_CCCR0
36CH
MSR_CRU_ESCR0
4
3B8H
MSR_CRU_ESCR2
5
3CCH
MSR_CRU_ESCR4
6
3E0H
MSR_IQ_ESCR01
0
3BAH
MSR_RAT_ESCR0
2
3BCH
MSR_SSU_ESCR0
3
3BEH
MSR_ALF_ESCR0
1
3CAH
MSR_IQ_COUNTER1
13
30DH
MSR_IQ_CCCR1
36DH
MSR_CRU_ESCR0
4
3B8H
MSR_CRU_ESCR2
5
3CCH
MSR_CRU_ESCR4
6
3E0H
MSR_IQ_ESCR01
0
3BAH
MSR_RAT_ESCR0
2
3BCH
MSR_SSU_ESCR0
3
3BEH
MSR_ALF_ESCR0
1
3CAH
MSR_IQ_COUNTER2
14
30EH
MSR_IQ_CCCR2
36EH
MSR_CRU_ESCR1
4
3B9H
MSR_CRU_ESCR3
5
3CDH
MSR_CRU_ESCR5
6
3E1H
MSR_IQ_ESCR11
0
3BBH
MSR_RAT_ESCR1
2
3BDH
MSR_ALF_ESCR1
1
3CBH
MSR_IQ_COUNTER3
15
30FH
MSR_IQ_CCCR3
36FH
MSR_CRU_ESCR1
4
3B9H
MSR_CRU_ESCR3
5
3CDH
MSR_CRU_ESCR5
6
3E1H
MSR_IQ_ESCR11
0
3BBH
MSR_RAT_ESCR1
2
3BDH
MSR_ALF_ESCR1
1
3CBH
MSR_IQ_COUNTER4
16
310H
MSR_IQ_CCCR4
370H
MSR_CRU_ESCR0
4
3B8H
MSR_CRU_ESCR2
5
3CCH
MSR_CRU_ESCR4
6
3E0H
MSR_IQ_ESCR01
0
3BAH
MSR_RAT_ESCR0
2
3BCH
MSR_SSU_ESCR0
3
3BEH
MSR_ALF_ESCR0
1
3CAH
MSR_IQ_COUNTER5
17
311H
MSR_IQ_CCCR5
371H
MSR_CRU_ESCR1
4
3B9H
MSR_CRU_ESCR3
5
3CDH
MSR_CRU_ESCR5
6
3E1H
MSR_IQ_ESCR11
0
3BBH
MSR_RAT_ESCR1
2
3BDH
MSR_ALF_ESCR1
1
3CBH
NOTES:
1. MSR_IQ_ESCR0 and MSR_IQ_ESCR1 are available only on early processor builds (family 0FH, models 01H-02H). These MSRs are not
available on later versions.
The types of events that can be counted with these performance monitoring facilities are divided into two classes:
non-retirement events and at-retirement events.
• Non-retirement events are events that occur any time during instruction execution (such as bus transactions or
cache transactions).
• At-retirement events are events that are counted at the retirement stage of instruction execution, which allows
finer granularity in counting events and capturing machine state.
The at-retirement counting mechanism includes facilities for tagging μops that have encountered a particular
performance event during instruction execution. Tagging allows events to be sorted between those that
occurred on an execution path that resulted in architectural state being committed at retirement as well as
events that occurred on an execution path where the results were eventually cancelled and never committed to
architectural state (such as, the execution of a mispredicted branch).
20-106
Vol. 3B

PERFORMANCE MONITORING
The Pentium 4 and Intel Xeon processor performance monitoring facilities support the three usage models
described below. The first two models can be used to count both non-retirement and at-retirement events; the
third model is used to count a subset of at-retirement events:
• Event counting — A performance counter is configured to count one or more types of events. While the
counter is counting, software reads the counter at selected intervals to determine the number of events that
have been counted between the intervals.
• Interrupt-based event sampling — A performance counter is configured to count one or more types of
events and to generate an interrupt when it overflows. To trigger an overflow, the counter is preset to a
modulus value that will cause the counter to overflow after a specific number of events have been counted.
When the counter overflows, the processor generates a performance monitoring interrupt (PMI). The interrupt
service routine for the PMI then records the return instruction pointer (RIP), resets the modulus, and restarts
the counter. Code performance can be analyzed by examining the distribution of RIPs with a tool like the
VTune™ Performance Analyzer.
• Processor event-based sampling (PEBS) — In PEBS, the processor writes a record of the architectural
state of the processor to a memory buffer after the counter overflows. The records of architectural state
provide additional information for use in performance tuning. Processor-based event sampling can be used to
count only a subset of at-retirement events. PEBS captures more precise processor state information compared
to interrupt based event sampling, because the latter need to use the interrupt service routine to re-construct
the architectural states of processor.
The following sections describe the MSRs and data structures used for performance monitoring in the Pentium 4
and Intel Xeon processors.
20.6.3.1 ESCR MSRs
The 45 ESCR MSRs (see Table 20-86) allow software to select specific events to be countered. Each ESCR is usually
associated with a pair of performance counters (see Table 20-86) and each performance counter has several ESCRs
associated with it (allowing the events counted to be selected from a variety of events).
Figure 20-47 shows the layout of an ESCR MSR. The functions of the flags and fields are:
• USR flag, bit 2 — When set, events are counted when the processor is operating at a current privilege level
(CPL) of 1, 2, or 3. These privilege levels are generally used by application code and unprotected operating
system code.
• OS flag, bit 3 — When set, events are counted when the processor is operating at CPL of 0. This privilege level
is generally reserved for protected operating system code. (When both the OS and USR flags are set, events
are counted at all privilege levels.)
31 30
25 24
9
8
5
4
3
2
1
0
Event
Tag
Event Mask
Select
Value
Tag Enable
Reserved
OS
USR
63
32
Reserved
Figure 20-47. Event Selection Control Register (ESCR) for Pentium 4
and Intel® Xeon® Processors without Intel HT Technology Support
• Tag enable, bit 4 — When set, enables tagging of μops to assist in at-retirement event counting; when clear,
disables tagging. See Section 20.6.3.6, “At-Retirement Counting.”
Vol. 3B
20-107
PERFORMANCE MONITORING
• Tag value field, bits 5 through 8 — Selects a tag value to associate with a μop to assist in at-retirement
event counting.
• Event mask field, bits 9 through 24 — Selects events to be counted from the event class selected with the
event select field.
• Event select field, bits 25 through 30) — Selects a class of events to be counted. The events within this
class that are counted are selected with the event mask field.
When setting up an ESCR, the event select field is used to select a specific class of events to count, such as retired
branches. The event mask field is then used to select one or more of the specific events within the class to be
counted. For example, when counting retired branches, four different events can be counted: branch not taken
predicted, branch not taken mispredicted, branch taken predicted, and branch taken mispredicted. The OS and
USR flags allow counts to be enabled for events that occur when operating system code and/or application code are
being executed. If neither the OS nor USR flag is set, no events will be counted.
The ESCRs are initialized to all 0s on reset. The flags and fields of an ESCR are configured by writing to the ESCR
using the WRMSR instruction. Table 20-86 gives the addresses of the ESCR MSRs.
Writing to an ESCR MSR does not enable counting with its associated performance counter; it only selects the event
or events to be counted. The CCCR for the selected performance counter must also be configured. Configuration of
the CCCR includes selecting the ESCR and enabling the counter.
20.6.3.2 Performance Counters
The performance counters in conjunction with the counter configuration control registers (CCCRs) are used for
filtering and counting the events selected by the ESCRs. Processors based on Intel NetBurst microarchitecture
provide 18 performance counters organized into 9 pairs. A pair of performance counters is associated with a partic-
ular subset of events and ESCR’s (see Table 20-86). The counter pairs are partitioned into four groups:
• The BPU group, includes two performance counter pairs:
— MSR_BPU_COUNTER0 and MSR_BPU_COUNTER1.
— MSR_BPU_COUNTER2 and MSR_BPU_COUNTER3.
• The MS group, includes two performance counter pairs:
— MSR_MS_COUNTER0 and MSR_MS_COUNTER1.
— MSR_MS_COUNTER2 and MSR_MS_COUNTER3.
• The FLAME group, includes two performance counter pairs:
— MSR_FLAME_COUNTER0 and MSR_FLAME_COUNTER1.
— MSR_FLAME_COUNTER2 and MSR_FLAME_COUNTER3.
• The IQ group, includes three performance counter pairs:
— MSR_IQ_COUNTER0 and MSR_IQ_COUNTER1.
— MSR_IQ_COUNTER2 and MSR_IQ_COUNTER3.
— MSR_IQ_COUNTER4 and MSR_IQ_COUNTER5.
The MSR_IQ_COUNTER4 counter in the IQ group provides support for the PEBS.
Alternate counters in each group can be cascaded: the first counter in one pair can start the first counter in the
second pair and vice versa. A similar cascading is possible for the second counters in each pair. For example, within
the BPU group of counters, MSR_BPU_COUNTER0 can start MSR_BPU_COUNTER2 and vice versa, and MSR_B-
PU_COUNTER1 can start MSR_BPU_COUNTER3 and vice versa (see Section 20.6.3.5.6, “Cascading Counters”).
The cascade flag in the CCCR register for the performance counter enables the cascading of counters.
Each performance counter is 40-bits wide (see Figure 20-48). The RDPMC instruction is intended to allow reading
of either the full counter-width (40-bits) or, if ECX[31] is set to 1, the low 32-bits of the counter. Reading the low
32-bits is faster than reading the full counter width and is appropriate in situations where the count is small enough
to be contained in 32 bits. In such cases, counter bits 31:0 are written to EAX, while 0 is written to EDX.
20-108
Vol. 3B

PERFORMANCE MONITORING
The RDPMC instruction can be used by programs or procedures running at any privilege level and in virtual-8086
mode to read these counters. The PCE flag in control register CR4 (bit 8) allows the use of this instruction to be
restricted to only programs and procedures running at privilege level 0.
31
0
Counter
63
39
32
Reserved
Counter
Figure 20-48. Performance Counter (Pentium 4 and Intel® Xeon® Processors)
The RDPMC instruction is not serializing or ordered with other instructions. Thus, it does not necessarily wait until
all previous instructions have been executed before reading the counter. Similarly, subsequent instructions may
begin execution before the RDPMC instruction operation is performed.
Only the operating system, executing at privilege level 0, can directly manipulate the performance counters, using
the RDMSR and WRMSR instructions. A secure operating system would clear the PCE flag during system initializa-
tion to disable direct user access to the performance-monitoring counters, but provide a user-accessible program-
ming interface that emulates the RDPMC instruction.
Some uses of the performance counters require the counters to be preset before counting begins (that is, before
the counter is enabled). This can be accomplished by writing to the counter using the WRMSR instruction. To set a
counter to a specified number of counts before overflow, enter a 2s complement negative integer in the counter.
The counter will then count from the preset value up to -1 and overflow. Writing to a performance counter in a
Pentium 4 or Intel Xeon processor with the WRMSR instruction causes all 40 bits of the counter to be written.
20.6.3.3 CCCR MSRs
Each of the 18 performance counters has one CCCR MSR associated with it (see Table 20-86). The CCCRs control
the filtering and counting of events as well as interrupt generation. Figure 20-49 shows the layout of an CCCR MSR.
The functions of the flags and fields are as follows:
• Enable flag, bit 12 — When set, enables counting; when clear, the counter is disabled. This flag is cleared on
reset.
• ESCR select field, bits 13 through 15 — Identifies the ESCR to be used to select events to be counted with
the counter associated with the CCCR.
• Compare flag, bit 18 — When set, enables filtering of the event count; when clear, disables filtering. The
filtering method is selected with the threshold, complement, and edge flags.
• Complement flag, bit 19 — Selects how the incoming event count is compared with the threshold value.
When set, event counts that are less than or equal to the threshold value result in a single count being
delivered to the performance counter; when clear, counts greater than the threshold value result in a count
being delivered to the performance counter (see Section 20.6.3.5.2, “Filtering Events”). The complement flag
is not active unless the compare flag is set.
• Threshold field, bits 20 through 23 — Selects the threshold value to be used for comparisons. The
processor examines this field only when the compare flag is set, and uses the complement flag setting to
determine the type of threshold comparison to be made. The useful range of values that can be entered in this
field depend on the type of event being counted (see Section 20.6.3.5.2, “Filtering Events”).
• Edge flag, bit 24 — When set, enables rising edge (false-to-true) edge detection of the threshold comparison
output for filtering event counts; when clear, rising edge detection is disabled. This flag is active only when the
compare flag is set.
Vol. 3B
20-109

PERFORMANCE MONITORING
Reserved
31 30 29
27 26 25 24 23
20 19 18 1716 15
13
12 11
0
Threshold
ESCR
Reserved
Select
Enable
Reserved: Must be set to 11B
Compare
Complement
Edge
FORCE_OVF
OVF_PMI
Cascade
OVF
63
32
Reserved
Figure 20-49. Counter Configuration Control Register (CCCR)
• FORCE_OVF flag, bit 25 — When set, forces a counter overflow on every counter increment; when clear,
overflow only occurs when the counter actually overflows.
• OVF_PMI flag, bit 26 — When set, causes a performance monitor interrupt (PMI) to be generated when the
counter overflows occurs; when clear, disables PMI generation. Note that the PMI is generated on the next
event count after the counter has overflowed.
• Cascade flag, bit 30 — When set, enables counting on one counter of a counter pair when its alternate
counter in the other the counter pair in the same counter group overflows (see Section 20.6.3.2, “Performance
Counters,” for further details); when clear, disables cascading of counters.
• OVF flag, bit 31 — Indicates that the counter has overflowed when set. This flag is a sticky flag that must be
explicitly cleared by software.
The CCCRs are initialized to all 0s on reset.
The events that an enabled performance counter actually counts are selected and filtered by the following flags and
fields in the ESCR and CCCR registers and in the qualification order given:
1. The event select and event mask fields in the ESCR select a class of events to be counted and one or more event
types within the class, respectively.
2. The OS and USR flags in the ESCR selected the privilege levels at which events will be counted.
3. The ESCR select field of the CCCR selects the ESCR. Since each counter has several ESCRs associated with it,
one ESCR must be chosen to select the classes of events that may be counted.
4. The compare and complement flags and the threshold field of the CCCR select an optional threshold to be used
in qualifying an event count.
5. The edge flag in the CCCR allows events to be counted only on rising-edge transitions.
The qualification order in the above list implies that the filtered output of one “stage” forms the input for the next.
For instance, events filtered using the privilege level flags can be further qualified by the compare and complement
flags and the threshold field, and an event that matched the threshold criteria, can be further qualified by edge
detection.
The uses of the flags and fields in the CCCRs are discussed in greater detail in Section 20.6.3.5, “Programming the
Performance Counters for Non-Retirement Events.”
20-110
Vol. 3B

PERFORMANCE MONITORING
20.6.3.4 Debug Store (DS) Mechanism
The debug store (DS) mechanism was introduced with processors based on Intel NetBurst microarchitecture to
allow various types of information to be collected in memory-resident buffers for use in debugging and tuning
programs. The DS mechanism can be used to collect two types of information: branch records and processor
event-based sampling (PEBS) records. The availability of the DS mechanism in a processor is indicated with the DS
feature flag (bit 21) returned by the CPUID instruction.
See Section 18.4.5, “Branch Trace Store (BTS),” and Section 20.6.3.8, “Processor Event-Based Sampling (PEBS),”
for a description of these facilities. Records collected with the DS mechanism are saved in the DS save area. See
Section 18.4.9, “BTS and DS Save Area.”
20.6.3.5 Programming the Performance Counters for Non-Retirement Events
The basic steps to program a performance counter and to count events include the following:
1. Select the event or events to be counted.
2. For each event, select an ESCR that supports the event.
3. Match the CCCR Select value and ESCR name to a value listed in Table 20-86; select a CCCR and performance
counter.
4. Set up an ESCR for the specific event or events to be counted and the privilege levels at which they are to be
counted.
5. Set up the CCCR for the performance counter by selecting the ESCR and the desired event filters.
6. Set up the CCCR for optional cascading of event counts, so that when the selected counter overflows its
alternate counter starts.
7. Set up the CCCR to generate an optional performance monitor interrupt (PMI) when the counter overflows. If
PMI generation is enabled, the local APIC must be set up to deliver the interrupt to the processor and a handler
for the interrupt must be in place.
8. Enable the counter to begin counting.
20.6.3.5.1 Selecting Events to Count
There is a set of at-retirement events for processors based on Intel NetBurst microarchitecture. For each event,
setup information is provided. Table 20-87 gives an example of one of the events.
Table 20-87. Event Example
Event Name
Event Parameters
Parameter Value
Description
branch_retired
Counts the retirement of a branch. Specify one or more mask bits to select
any combination of branch taken, not-taken, predicted, and mispredicted.
ESCR restrictions
MSR_CRU_ESCR2
See Table 15-3 for the addresses of the ESCR MSRs.
MSR_CRU_ESCR3
Counter numbers per
ESCR2: 12, 13, 16
The counter numbers associated with each ESCR are provided. The
ESCR
performance counters and corresponding CCCRs can be obtained from
ESCR3: 14, 15, 17
Table 15-3.
ESCR Event Select
06H
ESCR[31:25]
ESCR Event Mask
ESCR[24:9]
Bit 0: MMNP
Branch Not-taken Predicted
1: MMNM
Branch Not-taken Mispredicted
2: MMTP
Branch Taken Predicted
3: MMTM
Branch Taken Mispredicted
CCCR Select
05H
CCCR[15:13]
Vol. 3B
20-111

PERFORMANCE MONITORING
Table 20-87. Event Example (Contd.)
Event Name
Event Parameters
Parameter Value
Description
Event Specific Notes
P6: EMON_BR_INST_RETIRED
Can Support PEBS
No
Requires Additional
No
MSRs for Tagging
Event Parameters are described below.
•
ESCR restrictions — Lists the ESCRs that can be used to program the event. Typically only one ESCR is
needed to count an event.
•
Counter numbers per ESCR — Lists which performance counters are associated with each ESCR. Table 20-86
gives the name of the counter and CCCR for each counter number. Typically only one counter is needed to count
the event.
•
ESCR event select — Gives the value to be placed in the event select field of the ESCR to select the event.
•
ESCR event mask — Gives the value to be placed in the Event Mask field of the ESCR to select sub-events to
be counted. The parameter value column defines the documented bits with relative bit position offset starting
from 0, where the absolute bit position of relative offset 0 is bit 9 of the ESCR. All undocumented bits are
reserved and should be set to 0.
•
CCCR select — Gives the value to be placed in the ESCR select field of the CCCR associated with the counter
to select the ESCR to be used to define the event. This value is not the address of the ESCR; it is the number of
the ESCR from the Number column in Table 20-86.
•
Event specific notes — Gives additional information about the event, such as the name of the same or a
similar event defined for the P6 family processors.
•
Can support PEBS — Indicates if PEBS is supported for the event (only supplied for at-retirement events).
•
Requires additional MSR for tagging — Indicates which if any additional MSRs must be programmed to
count the events (only supplied for the at-retirement events).
NOTE
used as guides for performance tuning. The counter values reported are not guaranteed to be
absolutely accurate and should be used as a relative guide for tuning. Known discrepancies are
documented where applicable.
The following procedure shows how to set up a performance counter for basic counting; that is, the counter is set
up to count a specified event indefinitely, wrapping around whenever it reaches its maximum count. This procedure
is continued through the following four sections.
An event to be counted can be selected as follows:
1. Select the event to be counted.
2. Select the ESCR to be used to select events to be counted from the ESCRs field.
3. Select the number of the counter to be used to count the event from the Counter Numbers Per ESCR field.
4. Determine the name of the counter and the CCCR associated with the counter, and determine the MSR
addresses of the counter, CCCR, and ESCR from Table 20-86.
5. Use the WRMSR instruction to write the ESCR Event Select and ESCR Event Mask values into the appropriate
fields in the ESCR. At the same time set or clear the USR and OS flags in the ESCR as desired.
6. Use the WRMSR instruction to write the CCCR Select value into the appropriate field in the CCCR.
20-112
Vol. 3B

PERFORMANCE MONITORING
NOTE
Typically all the fields and flags of the CCCR will be written with one WRMSR instruction; however,
in this procedure, several WRMSR writes are used to more clearly demonstrate the uses of the
various CCCR fields and flags.
This setup procedure is continued in the next section, Section 20.6.3.5.2, “Filtering Events.”
20.6.3.5.2 Filtering Events
Each counter receives up to 4 input lines from the processor hardware from which it is counting events. The
counter treats these inputs as binary inputs (input 0 has a value of 1, input 1 has a value of 2, input 3 has a value
of 4, and input 3 has a value of 8). When a counter is enabled, it adds this binary input value to the counter value
on each clock cycle. For each clock cycle, the value added to the counter can then range from 0 (no event) to 15.
For many events, only the 0 input line is active, so the counter is merely counting the clock cycles during which the
0 input is asserted. However, for some events two or more input lines are used. Here, the counters threshold
setting can be used to filter events. The compare, complement, threshold, and edge fields control the filtering of
counter increments by input value.
If the compare flag is set, then a “greater than” or a “less than or equal to” comparison of the input value vs. a
threshold value can be made. The complement flag selects “less than or equal to” (flag set) or “greater than” (flag
clear). The threshold field selects a threshold value of from 0 to 15. For example, if the complement flag is cleared
and the threshold field is set to 6, than any input value of 7 or greater on the 4 inputs to the counter will cause the
counter to be incremented by 1, and any value less than 7 will cause an increment of 0 (or no increment) of the
counter. Conversely, if the complement flag is set, any value from 0 to 6 will increment the counter and any value
from 7 to 15 will not increment the counter. Note that when a threshold condition has been satisfied, the input to
the counter is always 1, not the input value that is presented to the threshold filter.
The edge flag provides further filtering of the counter inputs when a threshold comparison is being made. The edge
flag is only active when the compare flag is set. When the edge flag is set, the resulting output from the threshold
filter (a value of 0 or 1) is used as an input to the edge filter. Each clock cycle, the edge filter examines the last and
current input values and sends a count to the counter only when it detects a “rising edge” event; that is, a false-
to-true transition. Figure 20-50 illustrates rising edge filtering.
The following procedure shows how to configure a CCCR to filter events using the threshold filter and the edge
filter. This procedure is a continuation of the setup procedure introduced in Section 20.6.3.5.1, “Selecting Events
to Count.”
7.
(Optional) To set up the counter for threshold filtering, use the WRMSR instruction to write values in the CCCR
compare and complement flags and the threshold field:
— Set the compare flag.
— Set or clear the complement flag for less than or equal to or greater than comparisons, respectively.
— Enter a value from 0 to 15 in the threshold field.
8.
(Optional) Select rising edge filtering by setting the CCCR edge flag.
This setup procedure is continued in the next section, Section 20.6.3.5.3, “Starting Event Counting.”
Processor Clock
Output from
Threshold Filter
Counter Increments
On Rising Edge
(False-to-True)
Figure 20-50. Effects of Edge Filtering
Vol. 3B
20-113
PERFORMANCE MONITORING
20.6.3.5.3 Starting Event Counting
Event counting by a performance counter can be initiated in either of two ways. The typical way is to set the enable
flag in the counter’s CCCR. Following the instruction to set the enable flag, event counting begins and continues
until it is stopped (see Section 20.6.3.5.5, “Halting Event Counting”).
The following procedural step shows how to start event counting. This step is a continuation of the setup procedure
introduced in Section 20.6.3.5.2, “Filtering Events.”
9. To start event counting, use the WRMSR instruction to set the CCCR enable flag for the performance counter.
This setup procedure is continued in the next section, Section 20.6.3.5.4, “Reading a Performance Counter’s
Count.”
The second way that a counter can be started by using the cascade feature. Here, the overflow of one counter auto-
matically starts its alternate counter (see Section 20.6.3.5.6, “Cascading Counters”).
20.6.3.5.4 Reading a Performance Counter’s Count
Performance counters can be read using either the RDPMC or RDMSR instructions. The enhanced functions of the
RDPMC instruction (including fast read) are described in Section 20.6.3.2, “Performance Counters.” These instruc-
tions can be used to read a performance counter while it is counting or when it is stopped.
The following procedural step shows how to read the event counter. This step is a continuation of the setup proce-
dure introduced in Section 20.6.3.5.3, “Starting Event Counting.”
10. To read a performance counters current event count, execute the RDPMC instruction with the counter number
obtained from Table 20-86 used as an operand.
This setup procedure is continued in the next section, Section 20.6.3.5.5, “Halting Event Counting.”
20.6.3.5.5 Halting Event Counting
After a performance counter has been started (enabled), it continues counting indefinitely. If the counter overflows
(goes one count past its maximum count), it wraps around and continues counting. When the counter wraps
around, it sets its OVF flag to indicate that the counter has overflowed. The OVF flag is a sticky flag that indicates
that the counter has overflowed at least once since the OVF bit was last cleared.
To halt counting, the CCCR enable flag for the counter must be cleared.
The following procedural step shows how to stop event counting. This step is a continuation of the setup procedure
introduced in Section 20.6.3.5.4, “Reading a Performance Counter’s Count.”
11. To stop event counting, execute a WRMSR instruction to clear the CCCR enable flag for the performance
counter.
To halt a cascaded counter (a counter that was started when its alternate counter overflowed), either clear the
Cascade flag in the cascaded counter’s CCCR MSR or clear the OVF flag in the alternate counter’s CCCR MSR.
20.6.3.5.6 Cascading Counters
As described in Section 20.6.3.2, “Performance Counters,” eighteen performance counters are implemented in
pairs. Nine pairs of counters and associated CCCRs are further organized as four blocks: BPU, MS, FLAME, and IQ
(see Table 20-86). The first three blocks contain two pairs each. The IQ block contains three pairs of counters (12
through 17) with associated CCCRs (MSR_IQ_CCCR0 through MSR_IQ_CCCR5).
The first 8 counter pairs (0 through 15) can be programmed using ESCRs to detect performance monitoring events.
Pairs of ESCRs in each of the four blocks allow many different types of events to be counted. The cascade flag in the
CCCR MSR allows nested monitoring of events to be performed by cascading one counter to a second counter
located in another pair in the same block (see Figure 20-49 for the location of the flag).
Counters 0 and 1 form the first pair in the BPU block. Either counter 0 or 1 can be programmed to detect an event
via MSR_MO B_ESCR0. Counters 0 and 2 can be cascaded in any order, as can counters 1 and 3. It’s possible to set
up 4 counters in the same block to cascade on two pairs of independent events. The pairing described also applies
to subsequent blocks. Since the IQ PUB has two extra counters, cascading operates somewhat differently if 16 and
17 are involved. In the IQ block, counter 16 can only be cascaded from counter 14 (not from 12); counter 14
20-114
Vol. 3B

PERFORMANCE MONITORING
cannot be cascaded from counter 16 using the CCCR cascade bit mechanism. Similar restrictions apply to counter
17.
Example 20-1. Counting Events
Assume a scenario where counter X is set up to count 200 occurrences of event A; then counter Y is set up to count
400 occurrences of event B. Each counter is set up to count a specific event and overflow to the next counter. In
the above example, counter X is preset for a count of -200 and counter Y for a count of -400; this setup causes the
counters to overflow on the 200th and 400th counts respectively.
Continuing this scenario, counter X is set up to count indefinitely and wraparound on overflow. This is described in
the basic performance counter setup procedure that begins in Section 20.6.3.5.1, “Selecting Events to Count.”
Counter Y is set up with the cascade flag in its associated CCCR MSR set to 1 and its enable flag set to 0.
To begin the nested counting, the enable bit for the counter X is set. Once enabled, counter X counts until it over-
flows. At this point, counter Y is automatically enabled and begins counting. Thus counter X overflows after 200
occurrences of event A. Counter Y then starts, counting 400 occurrences of event B before overflowing. When
performance counters are cascaded, the counter Y would typically be set up to generate an interrupt on overflow.
This is described in Section 20.6.3.5.8, “Generating an Interrupt on Overflow.”
The cascading counters mechanism can be used to count a single event. The counting begins on one counter then
continues on the second counter after the first counter overflows. This technique doubles the number of event
counts that can be recorded, since the contents of the two counters can be added together.
20.6.3.5.7 EXTENDED CASCADING
Extended cascading is a model-specific feature in the Intel NetBurst microarchitecture with CPUID DisplayFami-
ly_DisplayModel 0F_02, 0F_03, 0F_04, 0F_06. This feature uses bit 11 in CCCRs associated with the IQ block. See
Table 20-88.
Table 20-88. CCR Names and Bit Positions
CCCR Name:Bit Position
Bit Name
Description
MSR_IQ_CCCR1|2:11
Reserved
MSR_IQ_CCCR0:11
CASCNT4INTO0
Allow counter 4 to cascade into counter 0
MSR_IQ_CCCR3:11
CASCNT5INTO3
Allow counter 5 to cascade into counter 3
MSR_IQ_CCCR4:11
CASCNT5INTO4
Allow counter 5 to cascade into counter 4
MSR_IQ_CCCR5:11
CASCNT4INTO5
Allow counter 4 to cascade into counter 5
The extended cascading feature can be adapted to the Interrupt based sampling usage model for performance
monitoring. However, it is known that performance counters do not generate PMI in cascade mode or extended
cascade mode due to an erratum. This erratum applies to processors with CPUID DisplayFamily_DisplayModel
signature of 0F_02. For processors with CPUID DisplayFamily_DisplayModel signature of 0F_00 and 0F_01, the
erratum applies to processors with stepping encoding greater than 09H.
Counters 16 and 17 in the IQ block are frequently used in processor event-based sampling or at-retirement
counting of events indicating a stalled condition in the pipeline. Neither counter 16 or 17 can initiate the cascading
of counter pairs using the cascade bit in a CCCR.
Extended cascading permits performance monitoring tools to use counters 16 and 17 to initiate cascading of two
counters in the IQ block. Extended cascading from counter 16 and 17 is conceptually similar to cascading other
counters, but instead of using CASCADE bit of a CCCR, one of the four CASCNTxINTOy bits is used.
Example 20-2. Scenario for Extended Cascading
A usage scenario for extended cascading is to sample instructions retired on logical processor 1 after the first 4096
instructions retired on logical processor 0. A procedure to program extended cascading in this scenario is outlined
below:
Vol. 3B
20-115
PERFORMANCE MONITORING
1. Write the value 0 to counter 12.
2. Write the value 04000603H to MSR_CRU_ESCR0 (corresponding to selecting the NBOGNTAG and NBOGTAG
event masks with qualification restricted to logical processor 1).
3. Write the value 04038800H to MSR_IQ_CCCR0. This enables CASCNT4INTO0 and OVF_PMI. An ISR can sample
on instruction addresses in this case (do not set ENABLE, or CASCADE).
4. Write the value FFFFF000H into counter 16.1.
5. Write the value 0400060CH to MSR_CRU_ESCR2 (corresponding to selecting the NBOGNTAG and NBOGTAG
event masks with qualification restricted to logical processor 0).
6. Write the value 00039000H to MSR_IQ_CCCR4 (set ENABLE bit, but not OVF_PMI).
Another use for cascading is to locate stalled execution in a multithreaded application. Assume MOB replays in
thread B cause thread A to stall. Getting a sample of the stalled execution in this scenario could be accomplished
by:
1. Set up counter B to count MOB replays on thread B.
2. Set up counter A to count resource stalls on thread A; set its force overflow bit and the appropriate CASCNTx-
INTOy bit.
3. Use the performance monitoring interrupt to capture the program execution data of the stalled thread.
20.6.3.5.8 Generating an Interrupt on Overflow
Any performance counter can be configured to generate a performance monitor interrupt (PMI) if the counter over-
flows. The PMI interrupt service routine can then collect information about the state of the processor or program
when overflow occurred. This information can then be used with a tool like the Intel® VTune™ Performance
Analyzer to analyze and tune program performance.
To enable an interrupt on counter overflow, the OVR_PMI flag in the counter’s associated CCCR MSR must be set.
When overflow occurs, a PMI is generated through the local APIC. (Here, the performance counter entry in the local
vector table [LVT] is set up to deliver the interrupt generated by the PMI to the processor.)
The PMI service routine can use the OVF flag to determine which counter overflowed when multiple counters have
been configured to generate PMIs. Also, note that these processors mask PMIs upon receiving an interrupt. Clear
this condition before leaving the interrupt handler.
When generating interrupts on overflow, the performance counter being used should be preset to value that will
cause an overflow after a specified number of events are counted plus 1. The simplest way to select the preset
value is to write a negative number into the counter, as described in Section 20.6.3.5.6, “Cascading Counters.”
Here, however, if an interrupt is to be generated after 100 event counts, the counter should be preset to minus 100
plus 1 (-100 + 1), or -99. The counter will then overflow after it counts 99 events and generate an interrupt on the
next (100th) event counted. The difference of 1 for this count enables the interrupt to be generated immediately
after the selected event count has been reached, instead of waiting for the overflow to be propagation through the
counter.
Because of latency in the microarchitecture between the generation of events and the generation of interrupts on
overflow, it is sometimes difficult to generate an interrupt close to an event that caused it. In these situations, the
FORCE_OVF flag in the CCCR can be used to improve reporting. Setting this flag causes the counter to overflow on
every counter increment, which in turn triggers an interrupt after every counter increment.
20.6.3.5.9 Counter Usage Guideline
There are some instances where the user must take care to configure counting logic properly, so that it is not
powered down. To use any ESCR, even when it is being used just for tagging, (any) one of the counters that the
particular ESCR (or its paired ESCR) can be connected to should be enabled. If this is not done, 0 counts may
result. Likewise, to use any counter, there must be some event selected in a corresponding ESCR (other than
no_event, which generally has a select value of 0).
20-116
Vol. 3B
PERFORMANCE MONITORING
20.6.3.6 At-Retirement Counting
At-retirement counting provides a means counting only events that represent work committed to architectural
state and ignoring work that was performed speculatively and later discarded.
One example of this speculative activity is branch prediction. When a branch misprediction occurs, the results of
instructions that were decoded and executed down the mispredicted path are canceled. If a performance counter
was set up to count all executed instructions, the count would include instructions whose results were canceled as
well as those whose results committed to architectural state.
To provide finer granularity in event counting in these situations, the performance monitoring facilities provided in
the Pentium 4 and Intel Xeon processors provide a mechanism for tagging events and then counting only those
tagged events that represent committed results. This mechanism is called “at-retirement counting.”
There are predefined at-retirement events and event metrics that can be used to for tagging events when using at
retirement counting. The following terminology is used in describing at-retirement counting:
•
Bogus, non-bogus, retire — In at-retirement event descriptions, the term “bogus” refers to instructions or
μops that must be canceled because they are on a path taken from a mispredicted branch. The terms “retired”
and “non-bogus” refer to instructions or μops along the path that results in committed architectural state
changes as required by the program being executed. Thus instructions and μops are either bogus or non-
bogus, but not both. Several of the Pentium 4 and Intel Xeon processors’ performance monitoring events (such
as, Instruction_Retired and Uops_Retired) can count instructions or μops that are retired based on the charac-
terization of bogus” versus non-bogus.
•
Tagging — Tagging is a means of marking μops that have encountered a particular performance event so they
can be counted at retirement. During the course of execution, the same event can happen more than once per
μop and a direct count of the event would not provide an indication of how many μops encountered that event.
The tagging mechanisms allow a μop to be tagged once during its lifetime and thus counted once at retirement.
The retired suffix is used for performance metrics that increment a count once per μop, rather than once per
event. For example, a μop may encounter a cache miss more than once during its life time, but a “Miss Retired”
metric (that counts the number of retired μops that encountered a cache miss) will increment only once for that
μop. A “Miss Retired” metric would be useful for characterizing the performance of the cache hierarchy for a
particular instruction sequence. Details of various performance metrics and how these can be constructed
using the Pentium 4 and Intel Xeon processors performance events are provided in the Intel® 64 and IA-32
Architectures Optimization Reference Manual (see Section 1.4, “Related Literature”).
•
Replay — To maximize performance for the common case, the Intel NetBurst microarchitecture aggressively
schedules μops for execution before all the conditions for correct execution are guaranteed to be satisfied. In
the event that all of these conditions are not satisfied, μops must be reissued. The mechanism that the Pentium
4 and Intel Xeon processors use for this reissuing of μops is called replay. Some examples of replay causes are
cache misses, dependence violations, and unforeseen resource constraints. In normal operation, some number
of replays is common and unavoidable. An excessive number of replays is an indication of a performance
problem.
•
Assist — When the hardware needs the assistance of microcode to deal with some event, the machine takes
an assist. One example of this is an underflow condition in the input operands of a floating-point operation. The
hardware must internally modify the format of the operands in order to perform the computation. Assists clear
the entire machine of μops before they begin and are costly.
20.6.3.6.1 Using At-Retirement Counting
Processors based on Intel NetBurst microarchitecture allow counting both events and μops that encountered a
specified event. For a subset of the at-retirement events, a μop may be tagged when it encounters that event. The
tagging mechanisms can be used in Interrupt-based event sampling, and a subset of these mechanisms can be
used in PEBS. There are four independent tagging mechanisms, and each mechanism uses a different event to
count μops tagged with that mechanism:
• Front-end tagging — This mechanism pertains to the tagging of μops that encountered front-end events (for
example, trace cache and instruction counts) and are counted with the Front_end_event event.
• Execution tagging — This mechanism pertains to the tagging of μops that encountered execution events (for
example, instruction types) and are counted with the Execution_Event event.
Vol. 3B
20-117
PERFORMANCE MONITORING
• Replay tagging — This mechanism pertains to tagging of μops whose retirement is replayed (for example, a
cache miss) and are counted with the Replay_event event. Branch mispredictions are also tagged with this
mechanism.
• No tags — This mechanism does not use tags. It uses the Instr_retired and the Uops_ retired events.
Each tagging mechanism is independent from all others; that is, a μop that has been tagged using one mechanism
will not be detected with another mechanism’s tagged-μop detector. For example, if μops are tagged using the
front-end tagging mechanisms, the Replay_event will not count those as tagged μops unless they are also tagged
using the replay tagging mechanism. However, execution tags allow up to four different types of μops to be counted
at retirement through execution tagging.
The independence of tagging mechanisms does not hold when using PEBS. When using PEBS, only one tagging
mechanism should be used at a time.
Certain kinds of μops that cannot be tagged, including I/O, uncacheable and locked accesses, returns, and far
transfers.
There are performance monitoring events that support at-retirement counting: specifically the Front_end_event,
Execution_event, Replay_event, Inst_retired, and Uops_retired events. The following sections describe the tagging
mechanisms for using these events to tag μop and count tagged μops.
20.6.3.6.2 Tagging Mechanism for Front_end_event
The Front_end_event counts μops that have been tagged as encountering any of the following events:
• μop decode events — Tagging μops for μop decode events requires specifying bits in the ESCR associated with
the performance-monitoring event, Uop_type.
• Trace cache events — Tagging μops for trace cache events may require specifying certain bits in the
MSR_TC_PRECISE_EVENT MSR.
The MSRs that are supported by the front-end tagging mechanism must be set and one or both of the NBOGUS and
BOGUS bits in the Front_end_event event mask must be set to count events. None of the events currently
supported requires the use of the MSR_TC_PRECISE_EVENT MSR.
20.6.3.6.3 Tagging Mechanism For Execution_event
The execution tagging mechanism differs from other tagging mechanisms in how it causes tagging. One upstream
ESCR is used to specify an event to detect and to specify a tag value (bits 5 through 8) to identify that event. A
second downstream ESCR is used to detect μops that have been tagged with that tag value identifier using Execu-
tion_event for the event selection.
The upstream ESCR that counts the event must have its tag enable flag (bit 4) set and must have an appropriate
tag value mask entered in its tag value field. The 4-bit tag value mask specifies which of tag bits should be set for
a particular μop. The value selected for the tag value should coincide with the event mask selected in the down-
stream ESCR. For example, if a tag value of 1 is set, then the event mask of NBOGUS0 should be enabled, corre-
spondingly in the downstream ESCR. The downstream ESCR detects and counts tagged μops. The normal (not tag
value) mask bits in the downstream ESCR specify which tag bits to count. If any one of the tag bits selected by the
mask is set, the related counter is incremented by one. The tag enable and tag value bits are irrelevant for the
downstream ESCR used to select the Execution_event.
The four separate tag bits allow the user to simultaneously but distinctly count up to four execution events at
retirement. (This applies for interrupt-based event sampling. There are additional restrictions for PEBS as noted in
Section 20.6.3.8.3, “Setting Up the PEBS Buffer.”) It is also possible to detect or count combinations of events by
setting multiple tag value bits in the upstream ESCR or multiple mask bits in the downstream ESCR. For example,
use a tag value of 3H in the upstream ESCR and use NBOGUS0/NBOGUS1 in the downstream ESCR event mask.
20.6.3.7 Tagging Mechanism for Replay_event
The replay mechanism enables tagging of μops for a subset of all replays before retirement. Use of the replay
mechanism requires selecting the type of μop that may experience the replay in the MSR_PEBS_MATRIX_VERT
MSR and selecting the type of event in the MSR_PEBS_ENABLE MSR. Replay tagging must also be enabled with the
UOP_Tag flag (bit 24) in the MSR_PEBS_ENABLE MSR.
20-118
Vol. 3B
PERFORMANCE MONITORING
The replay tags defined in Table A-5 also enable Processor Event-Based Sampling (PEBS, see Section 18.4.9). Each
of these replay tags can also be used in normal sampling by not setting Bit 24 nor Bit 25 in IA_32_PEBS_EN-
ABLE_MSR. Each of these metrics requires that the Replay_Event be used to count the tagged μops.
20.6.3.8 Processor Event-Based Sampling (PEBS)
The debug store (DS) mechanism in processors based on Intel NetBurst microarchitecture allow two types of infor-
mation to be collected for use in debugging and tuning programs: PEBS records and BTS records. See Section
18.4.5, “Branch Trace Store (BTS),” for a description of the BTS mechanism.
PEBS permits the saving of precise architectural information associated with one or more performance events in
the precise event records buffer, which is part of the DS save area (see Section 18.4.9, “BTS and DS Save Area”).
To use this mechanism, a counter is configured to overflow after it has counted a preset number of events. After
the counter overflows, the processor copies the current state of the general-purpose and EFLAGS registers and
instruction pointer into a record in the precise event records buffer. The processor then resets the count in the
performance counter and restarts the counter. When the precise event records buffer is nearly full, an interrupt is
generated, allowing the precise event records to be saved. A circular buffer is not supported for precise event
records.
PEBS is supported only for a subset of the at-retirement events: Execution_event, Front_end_event, and
Replay_event. Also, PEBS can only be carried out using the one performance counter, the MSR_IQ_COUNTER4
MSR.
In processors based on Intel Core microarchitecture, a similar PEBS mechanism is also supported using
IA32_PMC0 and IA32_PERFEVTSEL0 MSRs (See Section 20.6.2.4).
20.6.3.8.1 Detection of the Availability of the PEBS Facilities
The DS feature flag (bit 21) returned by the CPUID instruction indicates (when set) the availability of the DS mech-
anism in the processor, which supports the PEBS (and BTS) facilities. When this bit is set, the following PEBS facil-
ities are available:
• The PEBS_UNAVAILABLE flag in the IA32_MISC_ENABLE MSR indicates (when clear) the availability of the
PEBS facilities, including the MSR_PEBS_ENABLE MSR.
• The enable PEBS flag (bit 24) in the MSR_PEBS_ENABLE MSR allows PEBS to be enabled (set) or disabled
(clear).
• The IA32_DS_AREA MSR can be programmed to point to the DS save area.
20.6.3.8.2 Setting Up the DS Save Area
Section 18.4.9.2, “Setting Up the DS Save Area,” describes how to set up and enable the DS save area. This proce-
dure is common for PEBS and BTS.
20.6.3.8.3 Setting Up the PEBS Buffer
Only the MSR_IQ_COUNTER4 performance counter can be used for PEBS. Use the following procedure to set up the
processor and this counter for PEBS:
1. Set up the precise event buffering facilities. Place values in the precise event buffer base, precise event index,
precise event absolute maximum, and precise event interrupt threshold, and precise event counter reset fields
of the DS buffer management area (see Figure 18-5) to set up the precise event records buffer in memory.
2. Enable PEBS. Set the Enable PEBS flag (bit 24) in MSR_PEBS_ENABLE MSR.
3. Set up the MSR_IQ_COUNTER4 performance counter and its associated CCCR and one or more ESCRs for
PEBS.
Vol. 3B
20-119
PERFORMANCE MONITORING
20.6.3.8.4 Writing a PEBS Interrupt Service Routine
The PEBS facilities share the same interrupt vector and interrupt service routine (called the DS ISR) with the non-
precise event-based sampling and BTS facilities. To handle PEBS interrupts, PEBS handler code must be included in
the DS ISR. See Section 18.4.9.5, “Writing the DS Interrupt Service Routine,” for guidelines for writing the DS ISR.
20.6.3.8.5 Other DS Mechanism Implications
The DS mechanism is not available in the SMM. It is disabled on transition to the SMM mode. Similarly the DS
mechanism is disabled on the generation of a machine check exception and is cleared on processor RESET and INIT.
The DS mechanism is available in real address mode.
20.6.3.9 Operating System Implications
The DS mechanism can be used by the operating system as a debugging extension to facilitate failure analysis.
When using this facility, a 25 to 30 times slowdown can be expected due to the effects of the trace store occurring
on every taken branch.
Depending upon intended usage, the instruction pointers that are part of the branch records or the PEBS records
need to have an association with the corresponding process. One solution requires the ability for the DS specific
operating system module to be chained to the context switch. A separate buffer can then be maintained for each
process of interest and the MSR pointing to the configuration area saved and setup appropriately on each context
switch.
If the BTS facility has been enabled, then it must be disabled and state stored on transition of the system to a sleep
state in which processor context is lost. The state must be restored on return from the sleep state.
It is required that an interrupt gate be used for the DS interrupt as opposed to a trap gate to prevent the generation
of an endless interrupt loop.
Pages that contain buffers must have mappings to the same physical address for all processes/logical processors,
such that any change to CR3 will not change DS addresses. If this requirement cannot be satisfied (that is, the
feature is enabled on a per thread/process basis), then the operating system must ensure that the feature is
enabled/disabled appropriately in the context switch code.
20.6.4 Performance Monitoring and Intel® Hyper-Threading Technology in Processors Based
on Intel NetBurst® Microarchitecture
The performance monitoring capability of processors based on Intel NetBurst microarchitecture and supporting
Intel Hyper-Threading Technology is similar to that described in Section 20.6.3. However, the capability is extended
so that:
• Performance counters can be programmed to select events qualified by logical processor IDs.
• Performance monitoring interrupts can be directed to a specific logical processor within the physical processor.
The sections below describe performance counters, event qualification by logical processor ID, and special purpose
bits in ESCRs/CCCRs. They also describe MSR_PEBS_ENABLE, MSR_PEBS_MATRIX_VERT, and MSR_TC_PRE-
CISE_EVENT.
20.6.4.1 ESCR MSRs
Figure 20-51 shows the layout of an ESCR MSR in processors supporting Intel Hyper-Threading Technology.
The functions of the flags and fields are as follows:
• T1_USR flag, bit 0 — When set, events are counted when thread 1 (logical processor 1) is executing at a
current privilege level (CPL) of 1, 2, or 3. These privilege levels are generally used by application code and
unprotected operating system code.
20-120
Vol. 3B

PERFORMANCE MONITORING
31 30
25 24
9
8
5
4
3
2
1
0
Event
Tag
Event Mask
Select
Value
Tag Enable
T0_OS
Reserved
T0_USR
T1_OS
T1_USR
63
32
Reserved
Figure 20-51. Event Selection Control Register (ESCR) for the Pentium 4 Processor, Intel® Xeon® Processor, and
Intel® Xeon® Processor MP Supporting Hyper-Threading Technology
• T1_OS flag, bit 1 — When set, events are counted when thread 1 (logical processor 1) is executing at CPL of
0. This privilege level is generally reserved for protected operating system code. (When both the T1_OS and
T1_USR flags are set, thread 1 events are counted at all privilege levels.)
• T0_USR flag, bit 2 — When set, events are counted when thread 0 (logical processor 0) is executing at a CPL
of 1, 2, or 3.
• T0_OS flag, bit 3 — When set, events are counted when thread 0 (logical processor 0) is executing at CPL of
0. (When both the T0_OS and T0_USR flags are set, thread 0 events are counted at all privilege levels.)
• Tag enable, bit 4 — When set, enables tagging of μops to assist in at-retirement event counting; when clear,
disables tagging. See Section 20.6.3.6, “At-Retirement Counting.”
• Tag value field, bits 5 through 8 — Selects a tag value to associate with a μop to assist in at-retirement
event counting.
• Event mask field, bits 9 through 24 — Selects events to be counted from the event class selected with the
event select field.
• Event select field, bits 25 through 30) — Selects a class of events to be counted. The events within this
class that are counted are selected with the event mask field.
The T0_OS and T0_USR flags and the T1_OS and T1_USR flags allow event counting and sampling to be specified
for a specific logical processor (0 or 1) within an Intel Xeon processor MP (See also: Section 9.4.5, “Identifying
Logical Processors in an MP System,” in the Intel® 64 and IA-32 Architectures Software Developer’s Manual,
Volume 3A).
Not all performance monitoring events can be detected within an Intel Xeon processor MP on a per logical processor
basis (see Section 20.6.4.4, “Performance Monitoring Events”). Some sub-events (specified by an event mask bits)
are counted or sampled without regard to which logical processor is associated with the detected event.
20.6.4.2 CCCR MSRs
Figure 20-52 shows the layout of a CCCR MSR in processors supporting Intel Hyper-Threading Technology. The
functions of the flags and fields are as follows:
• Enable flag, bit 12 — When set, enables counting; when clear, the counter is disabled. This flag is cleared on
reset
• ESCR select field, bits 13 through 15 — Identifies the ESCR to be used to select events to be counted with
the counter associated with the CCCR.
• Active thread field, bits 16 and 17 — Enables counting depending on which logical processors are active
(executing a thread). This field enables filtering of events based on the state (active or inactive) of the logical
processors. The encodings of this field are as follows:
00 — None. Count only when neither logical processor is active.
Vol. 3B
20-121

PERFORMANCE MONITORING
01 — Single. Count only when one logical processor is active (either 0 or 1).
10 — Both. Count only when both logical processors are active.
11 — Any. Count when either logical processor is active.
A halted logical processor or a logical processor in the “wait for SIPI” state is considered inactive.
•
Compare flag, bit 18 — When set, enables filtering of the event count; when clear, disables filtering. The
filtering method is selected with the threshold, complement, and edge flags.
Reserved
31 30 29
27 26 25 24 23
20 19 18 1716 15
13
12 11
0
Threshold
ESCR
Reserved
Select
Enable
Active Thread
Compare
Complement
Edge
FORCE_OVF
OVF_PMI_T0
OVF_PMI_T1
Cascade
OVF
63
32
Reserved
Figure 20-52. Counter Configuration Control Register (CCCR)
•
Complement flag, bit 19 — Selects how the incoming event count is compared with the threshold value.
When set, event counts that are less than or equal to the threshold value result in a single count being delivered
to the performance counter; when clear, counts greater than the threshold value result in a count being
delivered to the performance counter (see Section 20.6.3.5.2, “Filtering Events”). The compare flag is not
active unless the compare flag is set.
•
Threshold field, bits 20 through 23 — Selects the threshold value to be used for comparisons. The
processor examines this field only when the compare flag is set, and uses the complement flag setting to
determine the type of threshold comparison to be made. The useful range of values that can be entered in this
field depend on the type of event being counted (see Section 20.6.3.5.2, “Filtering Events”).
•
Edge flag, bit 24 — When set, enables rising edge (false-to-true) edge detection of the threshold comparison
output for filtering event counts; when clear, rising edge detection is disabled. This flag is active only when the
compare flag is set.
•
FORCE_OVF flag, bit 25 — When set, forces a counter overflow on every counter increment; when clear,
overflow only occurs when the counter actually overflows.
•
OVF_PMI_T0 flag, bit 26 — When set, causes a performance monitor interrupt (PMI) to be sent to logical
processor 0 when the counter overflows occurs; when clear, disables PMI generation for logical processor 0.
Note that the PMI is generate on the next event count after the counter has overflowed.
•
OVF_PMI_T1 flag, bit 27 — When set, causes a performance monitor interrupt (PMI) to be sent to logical
processor 1 when the counter overflows occurs; when clear, disables PMI generation for logical processor 1.
Note that the PMI is generate on the next event count after the counter has overflowed.
•
Cascade flag, bit 30 — When set, enables counting on one counter of a counter pair when its alternate
counter in the other the counter pair in the same counter group overflows (see Section 20.6.3.2, “Performance
Counters,” for further details); when clear, disables cascading of counters.
20-122
Vol. 3B

PERFORMANCE MONITORING
• OVF flag, bit 31 — Indicates that the counter has overflowed when set. This flag is a sticky flag that must be
explicitly cleared by software.
20.6.4.3 IA32_PEBS_ENABLE MSR
In a processor supporting Intel Hyper-Threading Technology and based on the Intel NetBurst microarchitecture,
PEBS is enabled and qualified with two bits in the MSR_PEBS_ENABLE MSR: bit 25 (ENABLE_PEBS_MY_THR) and
26 (ENABLE_PEBS_OTH_THR) respectively. These bits do not explicitly identify a specific logical processor by logic
processor ID(T0 or T1); instead, they allow a software agent to enable PEBS for subsequent threads of execution
on the same logical processor on which the agent is running (“my thread”) or for the other logical processor in the
physical package on which the agent is not running (“other thread”).
PEBS is supported for only a subset of the at-retirement events: Execution_event, Front_end_event, and
Replay_event. Also, PEBS can be carried out only with two performance counters: MSR_IQ_CCCR4 (MSR address
370H) for logical processor 0 and MSR_IQ_CCCR5 (MSR address 371H) for logical processor 1.
Performance monitoring tools should use a processor affinity mask to bind the kernel mode components that need
to modify the ENABLE_PEBS_MY_THR and ENABLE_PEBS_OTH_THR bits in the MSR_PEBS_ENABLE MSR to a
specific logical processor. This is to prevent these kernel mode components from migrating between different
logical processors due to OS scheduling.
20.6.4.4 Performance Monitoring Events
When Intel Hyper-Threading Technology is active, many performance monitoring events can be can be qualified by
the logical processor ID, which corresponds to bit 0 of the initial APIC ID. This allows for counting an event in any
or all of the logical processors. However, not all the events have this logic processor specificity, or thread specificity.
Here, each event falls into one of two categories:
• Thread specific (TS) — The event can be qualified as occurring on a specific logical processor.
• Thread independent (TI) — The event cannot be qualified as being associated with a specific logical
processor.
If for example, a TS event occurred in logical processor T0, the counting of the event (as shown in Table 20-89)
depends only on the setting of the T0_USR and T0_OS flags in the ESCR being used to set up the event counter.
The T1_USR and T1_OS flags have no effect on the count.
Table 20-89. Effect of Logical Processor and CPL Qualification
for Logical-Processor-Specific (TS) Events
T1_OS/T1_USR = 00
T1_OS/T1_USR = 01
T1_OS/T1_USR = 11
T1_OS/T1_USR = 10
T0_OS/T0_USR = 00
Zero count
Counts while T1 in USR
Counts while T1 in OS or
Counts while T1 in OS
USR
T0_OS/T0_USR = 01
Counts while T0 in USR
Counts while T0 in USR
Counts while (a) T0 in
Counts while (a) T0 in OS
or T1 in USR
USR or (b) T1 in OS or (c)
or (b) T1 in OS
T1 in USR
T0_OS/T0_USR = 11
Counts while T0 in OS or
Counts while (a) T0 in OS
Counts irrespective of
Counts while (a) T0 in OS
USR
or (b) T0 in USR or (c) T1
CPL, T0, T1
or (b) or T0 in USR or (c)
in USR
T1 in OS
T0_OS/T0_USR = 10
Counts T0 in OS
Counts T0 in OS or T1 in
Counts while (a)T0 in Os
Counts while (a) T0 in OS
USR
or (b) T1 in OS or (c) T1
or (b) T1 in OS
in USR
When a bit in the event mask field is TI, the effect of specifying bit-0-3 of the associated ESCR are described in
Table 15-6. For events that are marked as TI, the effect of selectively specifying T0_USR, T0_OS, T1_USR, T1_OS
bits is shown in Table 20-90.
Vol. 3B
20-123

PERFORMANCE MONITORING
Table 20-90. Effect of Logical Processor and CPL Qualification
for Non-logical-Processor-specific (TI) Events
T1_OS/T1_USR = 00
T1_OS/T1_USR = 01
T1_OS/T1_USR = 11
T1_OS/T1_USR = 10
T0_OS/T0_USR = 00
Zero count
Counts while (a) T0 in
Counts irrespective of
Counts while (a) T0 in OS
USR or (b) T1 in USR
CPL, T0, T1
or (b) T1 in OS
T0_OS/T0_USR = 01
Counts while (a) T0 in
Counts while (a) T0 in
Counts irrespective of
Counts irrespective of
USR or (b) T1 in USR
USR or (b) T1 in USR
CPL, T0, T1
CPL, T0, T1
T0_OS/T0_USR = 11
Counts irrespective of
Counts irrespective of
Counts irrespective of
Counts irrespective of
CPL, T0, T1
CPL, T0, T1
CPL, T0, T1
CPL, T0, T1
T0_OS/T0_USR = 0
Counts while (a) T0 in OS
Counts irrespective of
Counts irrespective of
Counts while (a) T0 in OS
or (b) T1 in OS
CPL, T0, T1
CPL, T0, T1
or (b) T1 in OS
20.6.4.5 Counting Clocks on systems with Intel® Hyper-Threading Technology in Processors Based on
Intel NetBurst® Microarchitecture
20.6.4.5.1 Non-Halted Clockticks
Use the following procedure to program ESCRs and CCCRs to obtain non-halted clockticks on processors based on
Intel NetBurst microarchitecture:
1. Select an ESCR for the global_power_events and specify the RUNNING sub-event mask and the desired
T0_OS/T0_USR/T1_OS/T1_USR bits for the targeted processor.
2. Select an appropriate counter.
3. Enable counting in the CCCR for that counter by setting the enable bit.
20.6.4.5.2 Non-Sleep Clockticks
Performance monitoring counters can be configured to count clockticks whenever the performance monitoring
hardware is not powered-down. To count Non-sleep Clockticks with a performance-monitoring counter, do the
following:
1. Select one of the 18 counters.
2. Select any of the ESCRs whose events the selected counter can count. Set its event select to anything other
than “no_event”; the counter may be disabled if this is not done.
3. Turn threshold comparison on in the CCCR by setting the compare bit to “1”.
4. Set the threshold to “15” and the complement to “1” in the CCCR. Since no event can exceed this threshold, the
threshold condition is met every cycle and the counter counts every cycle. Note that this overrides any qualifi-
cation (e.g., by CPL) specified in the ESCR.
5. Enable counting in the CCCR for the counter by setting the enable bit.
In most cases, the counts produced by the non-halted and non-sleep metrics are equivalent if the physical package
supports one logical processor and is not placed in a power-saving state. Operating systems may execute an HLT
instruction and place a physical processor in a power-saving state.
On processors that support Intel Hyper-Threading Technology (Intel HT Technology), each physical package can
support two or more logical processors. Current implementation of Intel HT Technology provides two logical proces-
sors for each physical processor. While both logical processors can execute two threads simultaneously, one logical
processor may halt to allow the other logical processor to execute without sharing execution resources between
two logical processors.
Non-halted Clockticks can be set up to count the number of processor clock cycles for each logical processor when-
ever the logical processor is not halted (the count may include some portion of the clock cycles for that logical
processor to complete a transition to a halted state). Physical processors that support Intel HT Technology enter
into a power-saving state if all logical processors halt.
20-124
Vol. 3B
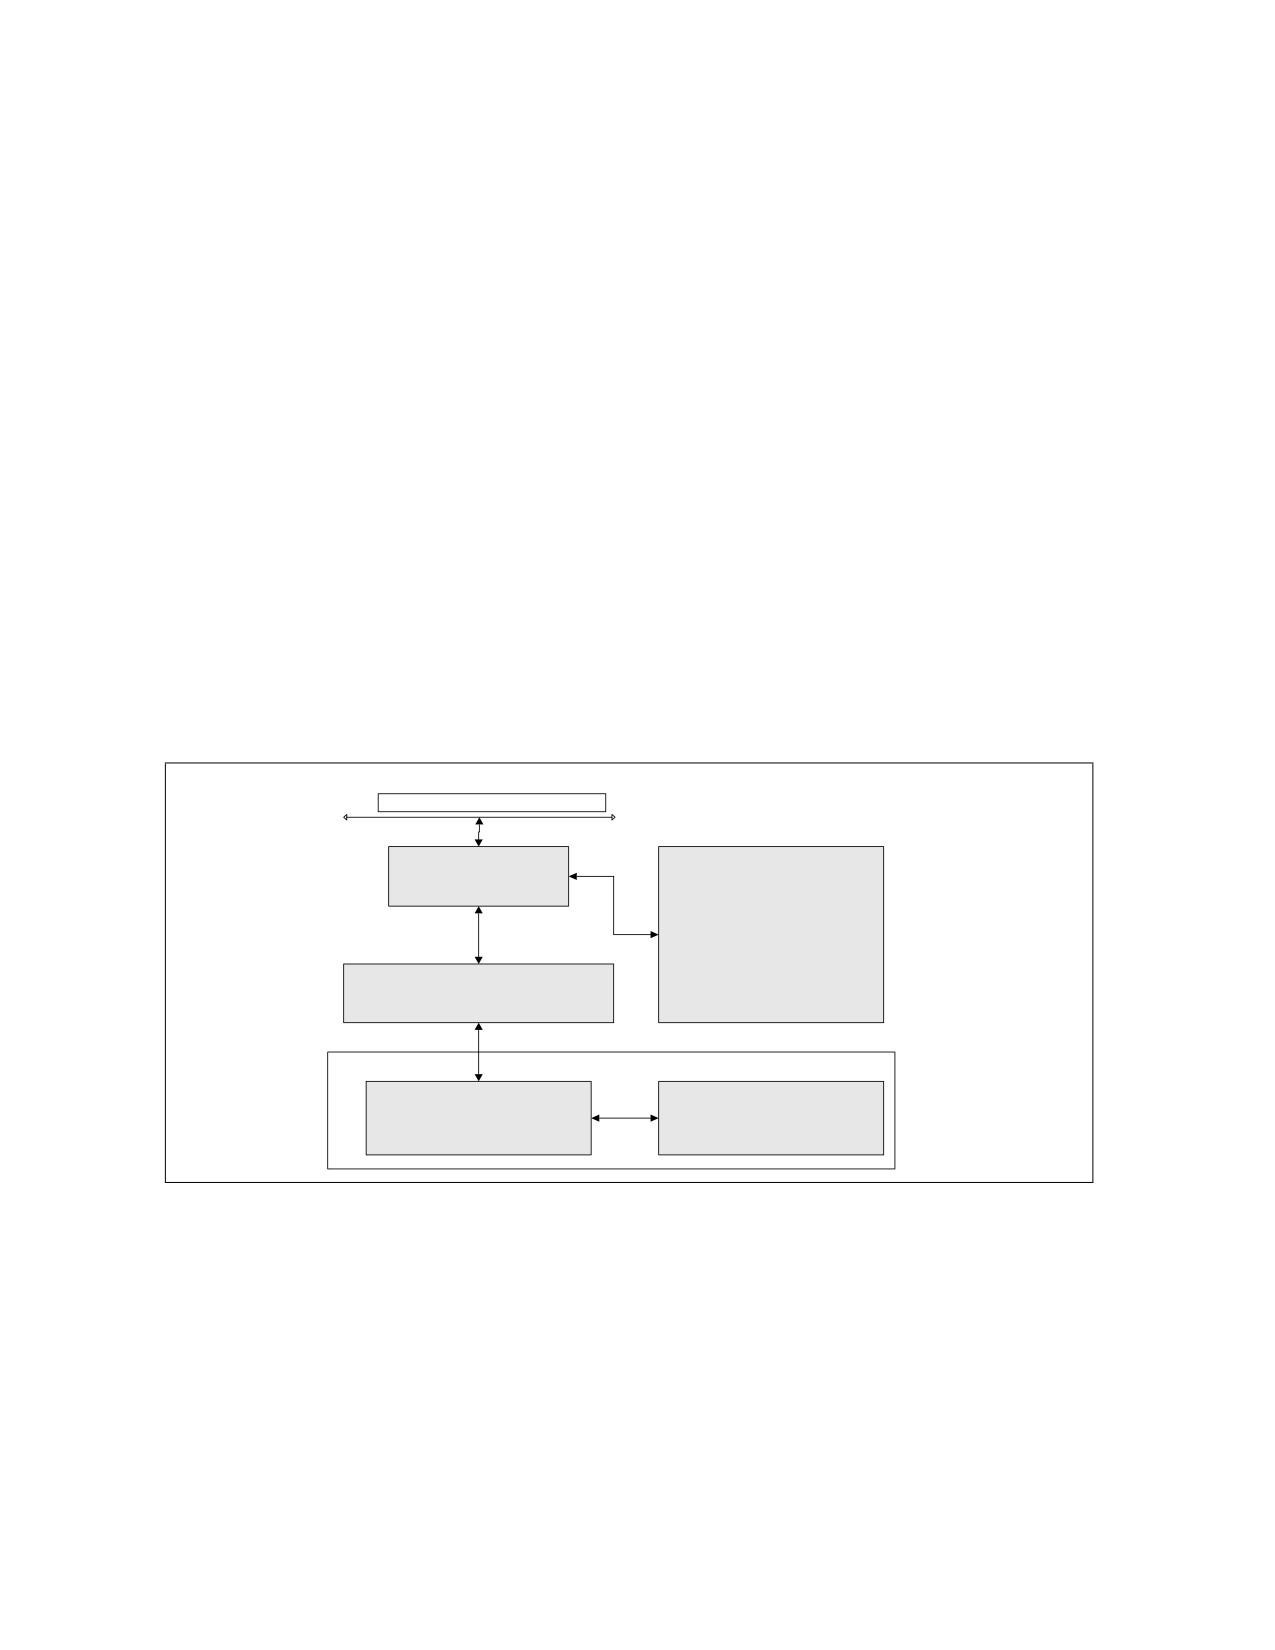
PERFORMANCE MONITORING
The Non-sleep Clockticks mechanism uses a filtering mechanism in CCCRs. The mechanism will continue to incre-
ment as long as one logical processor is not halted or in a power-saving state. Applications may cause a processor
to enter into a power-saving state by using an OS service that transfers control to an OS's idle loop. The idle loop
then may place the processor into a power-saving state after an implementation-dependent period if there is no
work for the processor.
20.6.5 Performance Monitoring and Dual-Core Technology
The performance monitoring capability of dual-core processors duplicates the microarchitectural resources of a
single-core processor implementation. Each processor core has dedicated performance monitoring resources.
In the case of Pentium D processor, each logical processor is associated with dedicated resources for performance
monitoring. In the case of Pentium processor Extreme edition, each processor core has dedicated resources, but
two logical processors in the same core share performance monitoring resources (see Section 20.6.4, “Perfor-
mance Monitoring and Intel® Hyper-Threading Technology in Processors Based on Intel NetBurst® Microarchitec-
ture”).
20.6.6 Performance Monitoring on 64-bit Intel® Xeon® Processor MP with Up to 8-MByte L3
Cache
The 64-bit Intel Xeon processor MP with up to 8-MByte L3 cache has a CPUID signature of family [0FH], model
[03H or 04H]. Performance monitoring capabilities available to Pentium 4 and Intel Xeon processors with the same
values (see Section 20.1 and Section 20.6.4) apply to the 64-bit Intel Xeon processor MP with an L3 cache.
The level 3 cache is connected between the system bus and IOQ through additional control logic. See Figure 20-53.
System Bus
iBUSQ and iSNPQ
3rd Level Cache
8 or 4 -way
iFSB
Processor Core
IOQ
(Front end, Execution,
Retirement, L1, L2
Figure 20-53. Block Diagram of 64-bit Intel® Xeon® Processor MP with 8-MByte L3
Additional performance monitoring capabilities and facilities unique to 64-bit Intel Xeon processor MP with an L3
cache are described in this section. The facility for monitoring events consists of a set of dedicated model-specific
registers (MSRs), each dedicated to a specific event. Programming of these MSRs requires using RDMSR/WRMSR
instructions with 64-bit values.
The lower 32-bits of the MSRs at addresses 107CC through 107D3 are treated as 32 bit performance counter regis-
ters. These performance counters can be accessed using RDPMC instruction with the index starting from 18
through 25. The EDX register returns zero when reading these 8 PMCs.
The performance monitoring capabilities consist of four events. These are:
Vol. 3B
20-125
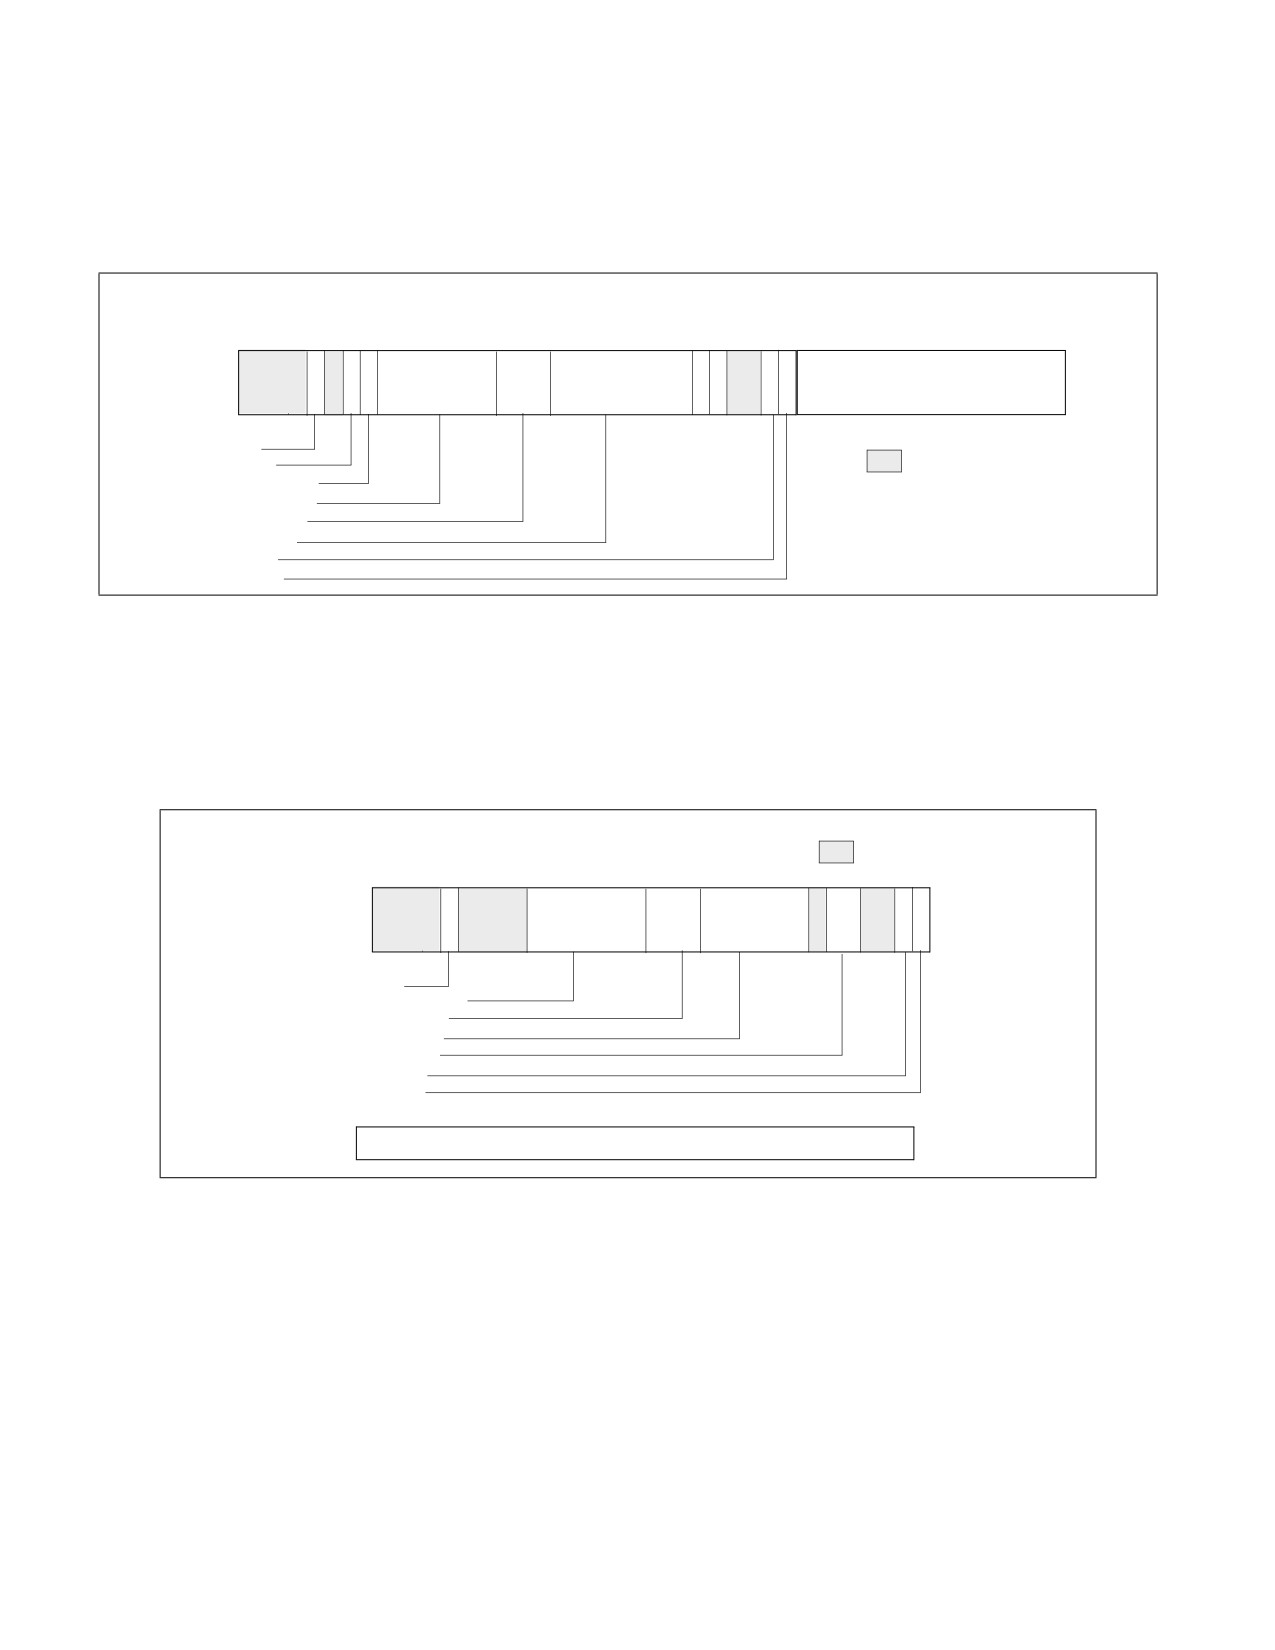
PERFORMANCE MONITORING
• IBUSQ event — This event detects the occurrence of micro-architectural conditions related to the iBUSQ unit.
It provides two MSRs: MSR_IFSB_IBUSQ0 and MSR_IFSB_IBUSQ1. Configure sub-event qualification and
enable/disable functions using the high 32 bits of these MSRs. The low 32 bits act as a 32-bit event counter.
Counting starts after software writes a non-zero value to one or more of the upper 32 bits. See Figure 20-54.
MSR_IFSB_IBUSQx, Addresses: 107CCH and 107CDH
63
60 59 58 57 56 55
4948
46 45
38 37 36
35
34 33
3231
0
1
1
32 bit event count
Saturate
Fill_match
Reserved
Eviction_match
L3_state_match
Snoop_match
Type_match
T1_match
T0_match
Figure 20-54. MSR_IFSB_IBUSQx, Addresses: 107CCH and 107CDH
• ISNPQ event — This event detects the occurrence of microarchitectural conditions related to the iSNPQ unit.
It provides two MSRs: MSR_IFSB_ISNPQ0 and MSR_IFSB_ISNPQ1. Configure sub-event qualifications and
enable/disable functions using the high 32 bits of the MSRs. The low 32-bits act as a 32-bit event counter.
Counting starts after software writes a non-zero value to one or more of the upper 32-bits. See Figure 20-55.
MSR_IFSB_ISNPQx, Addresses: 107CEH and 107CFH
Reserved
63
60 59 58 57 56 55
48
46 45
39
38 37 36
35
34 33
32
Saturate
L3_state_match
Snoop_match
Type_match
Agent_match
T1_match
T0_match
31
0
32 bit event count
Figure 20-55. MSR_IFSB_ISNPQx, Addresses: 107CEH and 107CFH
• EFSB event — This event can detect the occurrence of micro-architectural conditions related to the iFSB unit
or system bus. It provides two MSRs: MSR_EFSB_DRDY0 and MSR_EFSB_DRDY1. Configure sub-event qualifi-
cations and enable/disable functions using the high 32 bits of the 64-bit MSR. The low 32-bit act as a 32-bit
event counter. Counting starts after software writes a non-zero value to one or more of the qualification bits in
the upper 32-bits of the MSR. See Figure 20-56.
20-126
Vol. 3B

PERFORMANCE MONITORING
MSR_EFSB_DRDYx, Addresses: 107D0H and 107D1H
63
60 59 58 57 56 55
50 49
48
39
38 37 36
35
34 33
32
Saturate
Other
Reserved
Own
31
0
32 bit event count
Figure 20-56. MSR_EFSB_DRDYx, Addresses: 107D0H and 107D1H
• IBUSQ Latency event — This event accumulates weighted cycle counts for latency measurement of transac-
tions in the iBUSQ unit. The count is enabled by setting MSR_IFSB_CTRL6[bit 26] to 1; the count freezes after
software sets MSR_IFSB_CTRL6[bit 26] to 0. MSR_IFSB_CNTR7 acts as a 64-bit event counter for this event.
See Figure 20-57.
MSR_IFSB_CTL6 Address: 107D2H
63
59
57
0
Enable
MSR_IFSB_CNTR7 Address: 107D3H
Reserved
63
0
64 bit event count
Figure 20-57. MSR_IFSB_CTL6, Address: 107D2H; MSR_IFSB_CNTR7, Address: 107D3H
20.6.7 Performance Monitoring on L3 and Caching Bus Controller Sub-Systems
The Intel Xeon processor 7400 series and Dual-Core Intel Xeon processor 7100 series employ a distinct L3/caching
bus controller sub-system. These sub-system have a unique set of performance monitoring capability and
programming interfaces that are largely common between these two processor families.
Intel Xeon processor 7400 series are based on 45 nm enhanced Intel Core microarchitecture. The CPUID signature
is indicated by DisplayFamily_DisplayModel value of 06_1DH (see the CPUID instruction in Chapter 3, “Instruction
Set Reference, A-L‚” of the Intel® 64 and IA-32 Architectures Software Developer’s Manual, Volume 2A). Intel Xeon
processor 7400 series have six processor cores that share an L3 cache.
Dual-Core Intel Xeon processor 7100 series are based on Intel NetBurst microarchitecture, have a CPUID signature
of family [0FH], model [06H] and a unified L3 cache shared between two cores. Each core in an Intel Xeon
processor 7100 series supports Intel Hyper-Threading Technology, providing two logical processors per core.
Both Intel Xeon processor 7400 series and Intel Xeon processor 7100 series support multi-processor configurations
using system bus interfaces. In Intel Xeon processor 7400 series, the L3/caching bus controller sub-system
provides three Simple Direct Interface (SDI) to service transactions originated the XQ-replacement SDI logic in
each dual-core modules. In Intel Xeon processor 7100 series, the IOQ logic in each processor core is replaced with
a Simple Direct Interface (SDI) logic. The L3 cache is connected between the system bus and the SDI through
additional control logic. See Figure 20-58 for the block configuration of six processor cores and the L3/Caching bus
Vol. 3B
20-127
PERFORMANCE MONITORING
controller sub-system in Intel Xeon processor 7400 series. Figure 20-58 shows the block configuration of two
processor cores (four logical processors) and the L3/Caching bus controller sub-system in Intel Xeon processor
7100 series.
FSB
GBSQ, GSNPQ,
GINTQ, ...
L3
SDI
SDI interface
SDI interface
SDI interface
L2
L2
L2
Core
Core
Core
Core
Core
Core
Figure 20-58. Block Diagram of the Intel® Xeon® Processor 7400 Series
Almost all of the performance monitoring capabilities available to processor cores with the same CPUID signatures
(see Section 20.1 and Section 20.6.4) apply to Intel Xeon processor 7100 series. The MSRs used by performance
monitoring interface are shared between two logical processors in the same processor core.
The performance monitoring capabilities available to processor with DisplayFamily_DisplayModel signature 06_17H
also apply to Intel Xeon processor 7400 series. Each processor core provides its own set of MSRs for performance
monitoring interface.
The IOQ_allocation and IOQ_active_entries events are not supported in Intel Xeon processor 7100 series and 7400
series. Additional performance monitoring capabilities applicable to the L3/caching bus controller sub-system are
described in this section.
20-128
Vol. 3B
PERFORMANCE MONITORING
FSB
GBSQ, GSNPQ,
GINTQ, ...
L3
SDI
SDI interface
SDI interface
Processor core
Processor core
Logical
Logical
Logical
Logical
processor
processor
processor
processor
Figure 20-59. Block Diagram of the Intel® Xeon® Processor 7100 Series
20.6.7.1 Overview of Performance Monitoring with L3/Caching Bus Controller
The facility for monitoring events consists of a set of dedicated model-specific registers (MSRs). There are eight
event select/counting MSRs that are dedicated to counting events associated with specified microarchitectural
conditions. Programming of these MSRs requires using RDMSR/WRMSR instructions with 64-bit values. In addition,
an MSR MSR_EMON_L3_GL_CTL provides simplified interface to control freezing, resetting, re-enabling operation
of any combination of these event select/counting MSRs.
The eight MSRs dedicated to count occurrences of specific conditions are further divided to count three sub-classes
of microarchitectural conditions:
• Two MSRs (MSR_EMON_L3_CTR_CTL0 and MSR_EMON_L3_CTR_CTL1) are dedicated to counting GBSQ
events. Up to two GBSQ events can be programmed and counted simultaneously.
• Two MSRs (MSR_EMON_L3_CTR_CTL2 and MSR_EMON_L3_CTR_CTL3) are dedicated to counting GSNPQ
events. Up to two GBSQ events can be programmed and counted simultaneously.
• Four MSRs (MSR_EMON_L3_CTR_CTL4, MSR_EMON_L3_CTR_CTL5, MSR_EMON_L3_CTR_CTL6, and
MSR_EMON_L3_CTR_CTL7) are dedicated to counting external bus operations.
The bit fields in each of eight MSRs share the following common characteristics:
• Bits 63:32 is the event control field that includes an event mask and other bit fields that control counter
operation. The event mask field specifies details of the microarchitectural condition, and its definition differs
across GBSQ, GSNPQ, FSB.
• Bits 31:0 is the event count field. If the specified condition is met during each relevant clock domain of the
event logic, the matched condition signals the counter logic to increment the associated event count field. The
lower 32-bits of these 8 MSRs at addresses 107CC through 107D3 are treated as 32 bit performance counter
registers.
In Dual-Core Intel Xeon processor 7100 series, the uncore performance counters can be accessed using RDPMC
instruction with the index starting from 18 through 25. The EDX register returns zero when reading these 8 PMCs.
In Intel Xeon processor 7400 series, RDPMC with ECX between 2 and 9 can be used to access the eight uncore
performance counter/control registers.
Vol. 3B
20-129
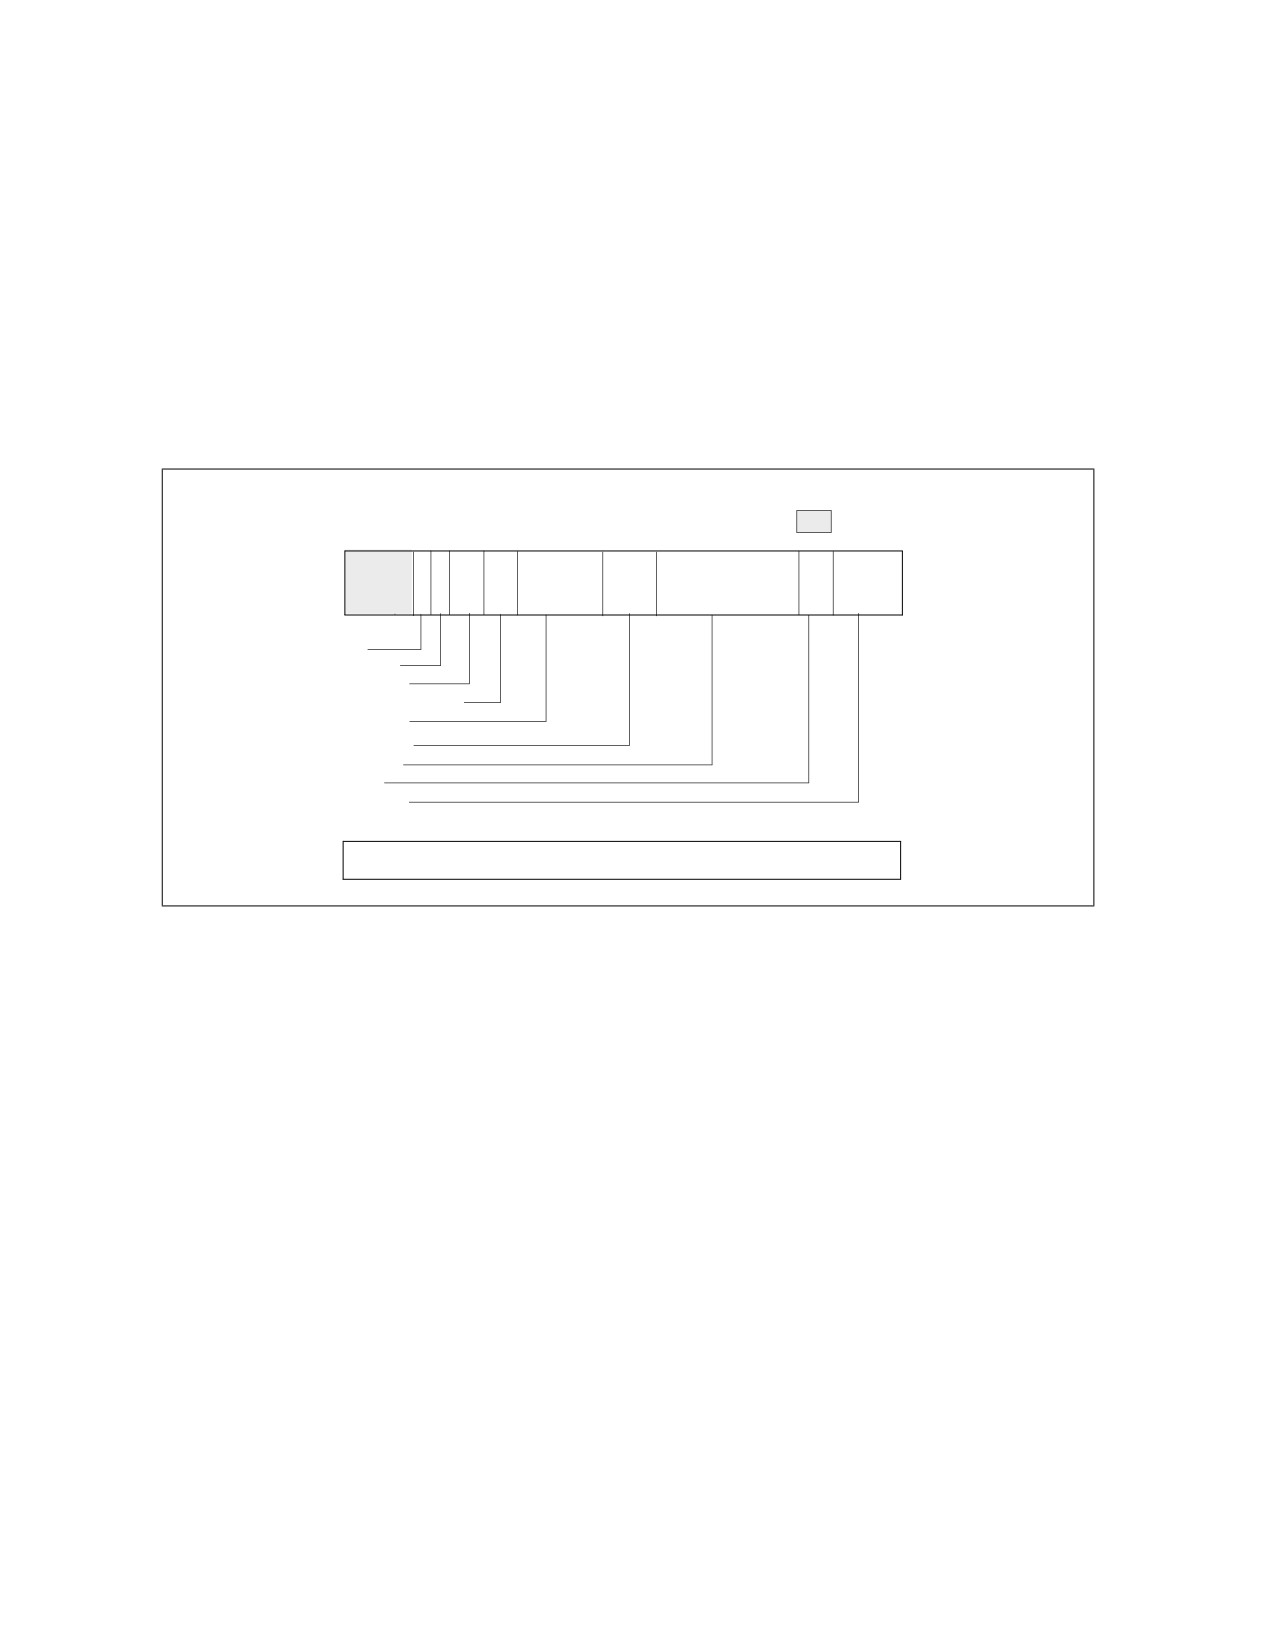
PERFORMANCE MONITORING
20.6.7.2 GBSQ Event Interface
The layout of MSR_EMON_L3_CTR_CTL0 and MSR_EMON_L3_CTR_CTL1 is given in Figure 20-60. Counting starts
after software writes a non-zero value to one or more of the upper 32 bits.
The event mask field (bits 58:32) consists of the following eight attributes:
• Agent_Select (bits 35:32): The definition of this field differs slightly between Intel Xeon processor 7100 and
7400.
For Intel Xeon processor 7100 series, each bit specifies a logical processor in the physical package. The lower
two bits corresponds to two logical processors in the first processor core, the upper two bits corresponds to two
logical processors in the second processor core. 0FH encoding matches transactions from any logical processor.
For Intel Xeon processor 7400 series, each bit of [34:32] specifies the SDI logic of a dual-core module as the
originator of the transaction. A value of 0111B in bits [35:32] specifies transaction from any processor core.
MSR_EMON_L3_CTR_CTL0/1, Addresses: 107CCH/107CDH
Reserved
63
60 59 58 57 56 55
54 53
4746
44 43
38 37 36
35
32
Saturate
Cross_snoop
Fill_eviction
Core_module_select
L3_state
Snoop_match
Type_match
Data_flow
Agent_select
31
0
32 bit event count
Figure 20-60. MSR_EMON_L3_CTR_CTL0/1, Addresses: 107CCH/107CDH
•
Data_Flow (bits 37:36): Bit 36 specifies demand transactions, bit 37 specifies prefetch transactions.
•
Type_Match (bits 43:38): Specifies transaction types. If all six bits are set, event count will include all
transaction types.
•
Snoop_Match: (bits 46:44): The three bits specify (in ascending bit position) clean snoop result, HIT snoop
result, and HITM snoop results respectively.
•
L3_State (bits 53:47): Each bit specifies an L2 coherency state.
•
Core_Module_Select (bits 55:54): The valid encodings for L3 lookup differ slightly between Intel Xeon
processor 7100 and 7400.
For Intel Xeon processor 7100 series,
— 00B: Match transactions from any core in the physical package
— 01B: Match transactions from this core only
— 10B: Match transactions from the other core in the physical package
— 11B: Match transaction from both cores in the physical package
For Intel Xeon processor 7400 series,
— 00B: Match transactions from any dual-core module in the physical package
— 01B: Match transactions from this dual-core module only
— 10B: Match transactions from either one of the other two dual-core modules in the physical package
20-130
Vol. 3B
PERFORMANCE MONITORING
— 11B: Match transaction from more than one dual-core modules in the physical package
• Fill_Eviction (bits 57:56): The valid encodings are
— 00B: Match any transactions
— 01B: Match transactions that fill L3
— 10B: Match transactions that fill L3 without an eviction
— 11B: Match transaction fill L3 with an eviction
• Cross_Snoop (bit 58): The encodings are
— 0B: Match any transactions
— 1B: Match cross snoop transactions
For each counting clock domain, if all eight attributes match, event logic signals to increment the event count field.
20.6.7.3 GSNPQ Event Interface
The layout of MSR_EMON_L3_CTR_CTL2 and MSR_EMON_L3_CTR_CTL3 is given in Figure 20-61. Counting starts
after software writes a non-zero value to one or more of the upper 32 bits.
The event mask field (bits 58:32) consists of the following six attributes:
•
Agent_Select (bits 37:32): The definition of this field differs slightly between Intel Xeon processor 7100 and
7400.
•
For Intel Xeon processor 7100 series, each of the lowest 4 bits specifies a logical processor in the physical
package. The lowest two bits corresponds to two logical processors in the first processor core, the next two bits
corresponds to two logical processors in the second processor core. Bit 36 specifies other symmetric agent
transactions. Bit 37 specifies central agent transactions. 3FH encoding matches transactions from any logical
processor.
For Intel Xeon processor 7400 series, each of the lowest 3 bits specifies a dual-core module in the physical
package. Bit 37 specifies central agent transactions.
•
Type_Match (bits 43:38): Specifies transaction types. If all six bits are set, event count will include any
transaction types.
•
Snoop_Match: (bits 46:44): The three bits specify (in ascending bit position) clean snoop result, HIT snoop
result, and HITM snoop results respectively.
•
L2_State (bits 53:47): Each bit specifies an L3 coherency state.
•
Core_Module_Select (bits 56:54): Bit 56 enables Core_Module_Select matching. If bit 56 is clear, Core_Mod-
ule_Select encoding is ignored. The valid encodings for the lower two bits (bit 55, 54) differ slightly between
Intel Xeon processor 7100 and 7400.
For Intel Xeon processor 7100 series, if bit 56 is set, the valid encodings for the lower two bits (bit 55, 54) are
— 00B: Match transactions from only one core (irrespective which core) in the physical package
— 01B: Match transactions from this core and not the other core
— 10B: Match transactions from the other core in the physical package, but not this core
— 11B: Match transaction from both cores in the physical package
For Intel Xeon processor 7400 series, if bit 56 is set, the valid encodings for the lower two bits (bit 55, 54) are
— 00B: Match transactions from only one dual-core module (irrespective which module) in the physical
package.
— 01B: Match transactions from one or more dual-core modules.
— 10B: Match transactions from two or more dual-core modules.
— 11B: Match transaction from all three dual-core modules in the physical package.
•
Block_Snoop (bit 57): specifies blocked snoop.
For each counting clock domain, if all six attributes match, event logic signals to increment the event count field.
Vol. 3B
20-131

PERFORMANCE MONITORING
MSR_EMON_L3_CTR_CTL2/3, Addresses: 107CEH/107CFH
Reserved
63
60 59 58 57 56 5554
53
47
46
44 43
39
38 37 36
32
Saturate
Block_snoop
Core_select
L2_state
Snoop_match
Type_match
Agent_match
31
0
32 bit event count
Figure 20-61. MSR_EMON_L3_CTR_CTL2/3, Addresses: 107CEH/107CFH
20.6.7.4 FSB Event Interface
The layout of MSR_EMON_L3_CTR_CTL4 through MSR_EMON_L3_CTR_CTL7 is given in Figure 20-62. Counting
starts after software writes a non-zero value to one or more of the upper 32 bits.
The event mask field (bits 58:32) is organized as follows:
• Bit 58: must set to 1.
• FSB_Submask (bits 57:32): Specifies FSB-specific sub-event mask.
The FSB sub-event mask defines a set of independent attributes. The event logic signals to increment the associ-
ated event count field if one of the attribute matches. Some of the sub-event mask bit counts durations. A duration
event increments at most once per cycle.
MSR_EMON_L3_CTR_CTL4/5/6/7, Addresses: 107D0H-107D3H
63
60 59 58 57 56 55
50 49
48
39
38 37 36
35
34 33
32
1
Saturate
Reserved
FSB submask
31
0
32 bit event count
Figure 20-62. MSR_EMON_L3_CTR_CTL4/5/6/7, Addresses: 107D0H-107D3H
20.6.7.4.1 FSB Sub-Event Mask Interface
• FSB_type (bit 37:32): Specifies different FSB transaction types originated from this physical package.
• FSB_L_clear (bit 38): Count clean snoop results from any source for transaction originated from this physical
package.
• FSB_L_hit (bit 39): Count HIT snoop results from any source for transaction originated from this physical
package.
20-132
Vol. 3B
PERFORMANCE MONITORING
•
FSB_L_hitm (bit 40): Count HITM snoop results from any source for transaction originated from this physical
package.
•
FSB_L_defer (bit 41): Count DEFER responses to this processor’s transactions.
•
FSB_L_retry (bit 42): Count RETRY responses to this processor’s transactions.
•
FSB_L_snoop_stall (bit 43): Count snoop stalls to this processor’s transactions.
•
FSB_DBSY (bit 44): Count DBSY assertions by this processor (without a concurrent DRDY).
•
FSB_DRDY (bit 45): Count DRDY assertions by this processor.
•
FSB_BNR (bit 46): Count BNR assertions by this processor.
•
FSB_IOQ_empty (bit 47): Counts each bus clocks when the IOQ is empty.
•
FSB_IOQ_full (bit 48): Counts each bus clocks when the IOQ is full.
•
FSB_IOQ_active (bit 49): Counts each bus clocks when there is at least one entry in the IOQ.
•
FSB_WW_data (bit 50): Counts back-to-back write transaction’s data phase.
•
FSB_WW_issue (bit 51): Counts back-to-back write transaction request pairs issued by this processor.
•
FSB_WR_issue (bit 52): Counts back-to-back write-read transaction request pairs issued by this processor.
•
FSB_RW_issue (bit 53): Counts back-to-back read-write transaction request pairs issued by this processor.
•
FSB_other_DBSY (bit 54): Count DBSY assertions by another agent (without a concurrent DRDY).
•
FSB_other_DRDY (bit 55): Count DRDY assertions by another agent.
•
FSB_other_snoop_stall (bit 56): Count snoop stalls on the FSB due to another agent.
•
FSB_other_BNR (bit 57): Count BNR assertions from another agent.
20.6.7.5 Common Event Control Interface
The MSR_EMON_L3_GL_CTL MSR provides simplified access to query overflow status of the GBSQ, GSNPQ, FSB
event counters. It also provides control bit fields to freeze, unfreeze, or reset those counters. The following bit
fields are supported:
• GL_freeze_cmd (bit 0): Freeze the event counters specified by the GL_event_select field.
• GL_unfreeze_cmd (bit 1): Unfreeze the event counters specified by the GL_event_select field.
• GL_reset_cmd (bit 2): Clear the event count field of the event counters specified by the GL_event_select field.
The event select field is not affected.
• GL_event_select (bit 23:16): Selects one or more event counters to subject to specified command operations
indicated by bits 2:0. Bit 16 corresponds to MSR_EMON_L3_CTR_CTL0, bit 23 corresponds to
MSR_EMON_L3_CTR_CTL7.
• GL_event_status (bit 55:48): Indicates the overflow status of each event counters. Bit 48 corresponds to
MSR_EMON_L3_CTR_CTL0, bit 55 corresponds to MSR_EMON_L3_CTR_CTL7.
In the event control field (bits 63:32) of each MSR, if the saturate control (bit 59, see Figure 20-60 for example) is
set, the event logic forces the value FFFF_FFFFH into the event count field instead of incrementing it.
20.6.8 Performance Monitoring (P6 Family Processor)
The P6 family processors provide two 40-bit performance counters, allowing two types of events to be monitored
simultaneously. These can either count events or measure duration. When counting events, a counter increments
each time a specified event takes place or a specified number of events takes place. When measuring duration, it
counts the number of processor clocks that occur while a specified condition is true. The counters can count events
or measure durations that occur at any privilege level.
Vol. 3B
20-133

PERFORMANCE MONITORING
NOTE
used as guides for performance tuning. Counter values reported are not guaranteed to be accurate
and should be used as a relative guide for tuning. Known discrepancies are documented where
applicable.
The performance-monitoring counters are supported by four MSRs: the performance event select MSRs (PerfEvt-
Sel0 and PerfEvtSel1) and the performance counter MSRs (PerfCtr0 and PerfCtr1). These registers can be read
from and written to using the RDMSR and WRMSR instructions, respectively. They can be accessed using these
instructions only when operating at privilege level 0. The PerfCtr0 and PerfCtr1 MSRs can be read from any privilege
level using the RDPMC (read performance-monitoring counters) instruction.
NOTE
The PerfEvtSel0, PerfEvtSel1, PerfCtr0, and PerfCtr1 MSRs and the events listed for P6 family
processors are model-specific for P6 family processors. They are not guaranteed to be available in
other IA-32 processors.
20.6.8.1 PerfEvtSel0 and PerfEvtSel1 MSRs
The PerfEvtSel0 and PerfEvtSel1 MSRs control the operation of the performance-monitoring counters, with one
register used to set up each counter. They specify the events to be counted, how they should be counted, and the
privilege levels at which counting should take place. Figure 20-63 shows the flags and fields in these MSRs.
The functions of the flags and fields in the PerfEvtSel0 and PerfEvtSel1 MSRs are as follows:
•
Event select field (bits 0 through 7) — Selects the event logic unit to detect certain microarchitectural
conditions.
•
Unit mask (UMASK) field (bits 8 through 15) — Further qualifies the event logic unit selected in the event
select field to detect a specific microarchitectural condition. For example, for some cache events, the mask is
used as a MESI-protocol qualifier of cache states.
31
2423222120191817 16 15
8 7
0
Counter Mask
I
I
U
N
E
N
P
E
O
S
Unit Mask (UMASK)
Event Select
(CMASK)
N
C
S
V
T
R
INV—Invert counter mask
EN—Enable counters*
INT—APIC interrupt enable
Reserved
PC—Pin control
E—Edge detect
OS—Operating system mode
* Only available in PerfEvtSel0.
USR—User Mode
Figure 20-63. PerfEvtSel0 and PerfEvtSel1 MSRs
•
USR (user mode) flag (bit 16) — Specifies that events are counted only when the processor is operating at
privilege levels 1, 2 or 3. This flag can be used in conjunction with the OS flag.
•
OS (operating system mode) flag (bit 17) — Specifies that events are counted only when the processor is
operating at privilege level 0. This flag can be used in conjunction with the USR flag.
•
E (edge detect) flag (bit 18) — Enables (when set) edge detection of events. The processor counts the
number of deasserted to asserted transitions of any condition that can be expressed by the other fields. The
mechanism is limited in that it does not permit back-to-back assertions to be distinguished. This mechanism
allows software to measure not only the fraction of time spent in a particular state, but also the average length
of time spent in such a state (for example, the time spent waiting for an interrupt to be serviced).
20-134
Vol. 3B
PERFORMANCE MONITORING
• PC (pin control) flag (bit 19) — When set, the processor toggles the PMi pins and increments the counter
when performance-monitoring events occur; when clear, the processor toggles the PMi pins when the counter
overflows. The toggling of a pin is defined as assertion of the pin for a single bus clock followed by deassertion.
• INT (APIC interrupt enable) flag (bit 20) — When set, the processor generates an exception through its
local APIC on counter overflow.
• EN (Enable Counters) Flag (bit 22) — This flag is only present in the PerfEvtSel0 MSR. When set,
performance counting is enabled in both performance-monitoring counters; when clear, both counters are
disabled.
• INV (invert) flag (bit 23) — When set, inverts the counter-mask (CMASK) comparison, so that both greater
than or equal to and less than comparisons can be made (0: greater than or equal; 1: less than). Note if
counter-mask is programmed to zero, INV flag is ignored.
• Counter mask (CMASK) field (bits 24 through 31) — When nonzero, the processor compares this mask to
the number of events counted during a single cycle. If the event count is greater than or equal to this mask, the
counter is incremented by one. Otherwise the counter is not incremented. This mask can be used to count
events only if multiple occurrences happen per clock (for example, two or more instructions retired per clock).
If the counter-mask field is 0, then the counter is incremented each cycle by the number of events that
occurred that cycle.
20.6.8.2 PerfCtr0 and PerfCtr1 MSRs
The performance-counter MSRs (PerfCtr0 and PerfCtr1) contain the event or duration counts for the selected
events being counted. The RDPMC instruction can be used by programs or procedures running at any privilege level
and in virtual-8086 mode to read these counters. The PCE flag in control register CR4 (bit 8) allows the use of this
instruction to be restricted to only programs and procedures running at privilege level 0.
The RDPMC instruction is not serializing or ordered with other instructions. Thus, it does not necessarily wait until
all previous instructions have been executed before reading the counter. Similarly, subsequent instructions may
begin execution before the RDPMC instruction operation is performed.
Only the operating system, executing at privilege level 0, can directly manipulate the performance counters, using
the RDMSR and WRMSR instructions. A secure operating system would clear the PCE flag during system initializa-
tion to disable direct user access to the performance-monitoring counters, but provide a user-accessible program-
ming interface that emulates the RDPMC instruction.
The WRMSR instruction cannot arbitrarily write to the performance-monitoring counter MSRs (PerfCtr0 and
PerfCtr1). Instead, the lower-order 32 bits of each MSR may be written with any value, and the high-order 8 bits
are sign-extended according to the value of bit 31. This operation allows writing both positive and negative values
to the performance counters.
20.6.8.3 Starting and Stopping the Performance-Monitoring Counters
The performance-monitoring counters are started by writing valid setup information in the PerfEvtSel0 and/or
PerfEvtSel1 MSRs and setting the enable counters flag in the PerfEvtSel0 MSR. If the setup is valid, the counters
begin counting following the execution of a WRMSR instruction that sets the enable counter flag. The counters can
be stopped by clearing the enable counters flag or by clearing all the bits in the PerfEvtSel0 and PerfEvtSel1 MSRs.
Counter 1 alone can be stopped by clearing the PerfEvtSel1 MSR.
20.6.8.4 Event and Time-Stamp Monitoring Software
To use the performance-monitoring counters and time-stamp counter, the operating system needs to provide an
event-monitoring device driver. This driver should include procedures for handling the following operations:
• Feature checking.
• Initialize and start counters.
• Stop counters.
• Read the event counters.
• Read the time-stamp counter.
Vol. 3B
20-135
PERFORMANCE MONITORING
The event monitor feature determination procedure must check whether the current processor supports the perfor-
mance-monitoring counters and time-stamp counter. This procedure compares the family and model of the
processor returned by the CPUID instruction with those of processors known to support performance monitoring.
(The Pentium and P6 family processors support performance counters.) The procedure also checks the MSR and
TSC flags returned to register EDX by the CPUID instruction to determine if the MSRs and the RDTSC instruction are
supported.
The initialize and start counters procedure sets the PerfEvtSel0 and/or PerfEvtSel1 MSRs for the events to be
counted and the method used to count them and initializes the counter MSRs (PerfCtr0 and PerfCtr1) to starting
counts. The stop counters procedure stops the performance counters (see Section 20.6.8.3, “Starting and Stopping
the Performance-Monitoring Counters”).
The read counters procedure reads the values in the PerfCtr0 and PerfCtr1 MSRs, and a read time-stamp counter
procedure reads the time-stamp counter. These procedures would be provided in lieu of enabling the RDTSC and
RDPMC instructions that allow application code to read the counters.
20.6.8.5 Monitoring Counter Overflow
The P6 family processors provide the option of generating a local APIC interrupt when a performance-monitoring
counter overflows. This mechanism is enabled by setting the interrupt enable flag in either the PerfEvtSel0 or the
PerfEvtSel1 MSR. The primary use of this option is for statistical performance sampling.
To use this option, the operating system should do the following things on the processor for which performance
events are required to be monitored:
• Provide an interrupt vector for handling the counter-overflow interrupt.
• Initialize the APIC PERF local vector entry to enable handling of performance-monitor counter overflow events.
• Provide an entry in the IDT that points to a stub exception handler that returns without executing any instruc-
tions.
• Provide an event monitor driver that provides the actual interrupt handler and modifies the reserved IDT entry
to point to its interrupt routine.
When interrupted by a counter overflow, the interrupt handler needs to perform the following actions:
• Save the instruction pointer (EIP register), code-segment selector, TSS segment selector, counter values and
other relevant information at the time of the interrupt.
• Reset the counter to its initial setting and return from the interrupt.
An event monitor application utility or another application program can read the information collected for analysis
of the performance of the profiled application.
20.6.9 Performance Monitoring (Pentium Processors)
The Pentium processor provides two 40-bit performance counters, which can be used to count events or measure
duration. The counters are supported by three MSRs: the control and event select MSR (CESR) and the perfor-
mance counter MSRs (CTR0 and CTR1). These can be read from and written to using the RDMSR and WRMSR
instructions, respectively. They can be accessed using these instructions only when operating at privilege level 0.
Each counter has an associated external pin (PM0/BP0 and PM1/BP1), which can be used to indicate the state of the
counter to external hardware.
NOTES
The CESR, CTR0, and CTR1 MSRs and the events listed for Pentium processors are model-specific
for the Pentium processor.
used as guides for performance tuning. Counter values reported are not guaranteed to be accurate
and should be used as a relative guide for tuning. Known discrepancies are documented where
applicable.
20-136
Vol. 3B

PERFORMANCE MONITORING
20.6.9.1 Control and Event Select Register (CESR)
The 32-bit control and event select MSR (CESR) controls the operation of performance-monitoring counters CTR0
and CTR1 and the associated pins (see Figure 20-64). To control each counter, the CESR register contains a 6-bit
event select field (ES0 and ES1), a pin control flag (PC0 and PC1), and a 3-bit counter control field (CC0 and CC1).
The functions of these fields are as follows:
•
ES0 and ES1 (event select) fields (bits 0-5, bits 16-21) — Selects (by entering an event code in the field)
up to two events to be monitored.
31
26 25
24
22 21
1615
10
9
8
65
0
P
P
C
CC1
ES1
C
CC0
ESO
1
0
PC1—Pin control 1
CC1—Counter control 1
ES1—Event select 1
PC0—Pin control 0
CC0—Counter control 0
ES0—Event select 0
Reserved
Figure 20-64. CESR MSR (Pentium Processor Only)
•
CC0 and CC1 (counter control) fields (bits 6-8, bits 22-24) — Controls the operation of the counter.
Control codes are as follows:
000 — Count nothing (counter disabled).
001 — Count the selected event while CPL is 0, 1, or 2.
010 — Count the selected event while CPL is 3.
011 — Count the selected event regardless of CPL.
100 — Count nothing (counter disabled).
101 — Count clocks (duration) while CPL is 0, 1, or 2.
110 — Count clocks (duration) while CPL is 3.
111 — Count clocks (duration) regardless of CPL.
The highest order bit selects between counting events and counting clocks (duration); the middle bit enables
counting when the CPL is 3; and the low-order bit enables counting when the CPL is 0, 1, or 2.
•
PC0 and PC1 (pin control) flags (bits 9, 25) — Selects the function of the external performance-monitoring
counter pin (PM0/BP0 and PM1/BP1). Setting one of these flags to 1 causes the processor to assert its
associated pin when the counter has overflowed; setting the flag to 0 causes the pin to be asserted when the
counter has been incremented. These flags permit the pins to be individually programmed to indicate the
overflow or incremented condition. The external signaling of the event on the pins will lag the internal event by
a few clocks as the signals are latched and buffered.
While a counter need not be stopped to sample its contents, it must be stopped and cleared or preset before
switching to a new event. It is not possible to set one counter separately. If only one event needs to be changed,
the CESR register must be read, the appropriate bits modified, and all bits must then be written back to CESR. At
reset, all bits in the CESR register are cleared.
20.6.9.2 Use of the Performance-Monitoring Pins
When performance-monitor pins PM0/BP0 and/or PM1/BP1 are configured to indicate when the performance-
monitor counter has incremented and an “occurrence event” is being counted, the associated pin is asserted (high)
each time the event occurs. When a “duration event” is being counted, the associated PM pin is asserted for the
Vol. 3B
20-137
PERFORMANCE MONITORING
entire duration of the event. When the performance-monitor pins are configured to indicate when the counter has
overflowed, the associated PM pin is asserted when the counter has overflowed.
When the PM0/BP0 and/or PM1/BP1 pins are configured to signal that a counter has incremented, it should be
noted that although the counters may increment by 1 or 2 in a single clock, the pins can only indicate that the event
occurred. Moreover, since the internal clock frequency may be higher than the external clock frequency, a single
external clock may correspond to multiple internal clocks.
A “count up to” function may be provided when the event pin is programmed to signal an overflow of the counter.
Because the counters are 40 bits, a carry out of bit 39 indicates an overflow. A counter may be preset to a specific
value less then 240 − 1. After the counter has been enabled and the prescribed number of events has transpired,
the counter will overflow.
Approximately 5 clocks later, the overflow is indicated externally and appropriate action, such as signaling an inter-
rupt, may then be taken.
The PM0/BP0 and PM1/BP1 pins also serve to indicate breakpoint matches during in-circuit emulation, during which
time the counter increment or overflow function of these pins is not available. After RESET, the PM0/BP0 and
PM1/BP1 pins are configured for performance monitoring, however a hardware debugger may reconfigure these
pins to indicate breakpoint matches.
20.6.9.3 Events Counted
Events that performance-monitoring counters can be set to count and record (using CTR0 and CTR1) are divided in
two categories: occurrence and duration:
• Occurrence events — Counts are incremented each time an event takes place. If PM0/BP0 or PM1/BP1 pins
are used to indicate when a counter increments, the pins are asserted each clock counters increment. But if an
event happens twice in one clock, the counter increments by 2 (the pins are asserted only once).
• Duration events — Counters increment the total number of clocks that the condition is true. When used to
indicate when counters increment, PM0/BP0 and/or PM1/BP1 pins are asserted for the duration.
20.7
COUNTING CLOCKS
The count of cycles, also known as clockticks, forms the basis for measuring how long a program takes to execute.
Clockticks are also used as part of efficiency ratios like cycles per instruction (CPI). Processor clocks may stop
ticking under circumstances like the following:
• The processor is halted when there is nothing for the CPU to do. For example, the processor may halt to save
power while the computer is servicing an I/O request. When Intel Hyper-Threading Technology is enabled, both
logical processors must be halted for performance-monitoring counters to be powered down.
• The processor is asleep as a result of being halted or because of a power-management scheme. There are
different levels of sleep. In the some deep sleep levels, the time-stamp counter stops counting.
In addition, processor core clocks may undergo transitions at different ratios relative to the processor’s bus clock
frequency. Some of the situations that can cause processor core clock to undergo frequency transitions include:
• TM2 transitions.
• Enhanced Intel SpeedStep Technology transitions (P-state transitions).
For Intel processors that support TM2, the processor core clocks may operate at a frequency that differs from the
Processor Base frequency (as indicated by processor frequency information reported by CPUID instruction). See
Section 20.7.2 for more detail.
Due to the above considerations there are several important clocks referenced in this manual:
• Base Clock — The frequency of this clock is the frequency of the processor when the processor is not in turbo
mode, and not being throttled via Intel SpeedStep.
• Maximum Clock — This is the maximum frequency of the processor when turbo mode is at the highest point.
• Bus Clock — These clockticks increment at a fixed frequency and help coordinate the bus on some systems.
20-138
Vol. 3B