TM920 Diagnostics and service (2018) - page 2
Diagnostic tools
5 Diagnostic tools
The following section describes the diagnostic possibilities for pre-
liminary diagnostics, which can be performed with or without an ad-
ditional computer. Before getting started, it is advisable to make sure
you have all important information from the manufacturer such as
data sheets and manuals.
It is recommended to have a computer with a network card and net-
work cable ready for diagnosis. It is also helpful to have an Internet
connection for the diagnostic computer. This makes it possible to
quickly obtain further information as needed.
The following diagnostic methods can be used:
•
5.1 "Diagnostics without a PC" on page 32
•
5.2 "Diagnostics via PC" on page 36
5.1 Diagnostics without a PC
When an error occurs, the first line of action is to get an overview.
Does the HMI application already show the first status reports?
What is the behavior of the LED status indicators for the electromechanics and control electronics?
This information provides important hints for the initial diagnosis.
5.1.1 HMI application
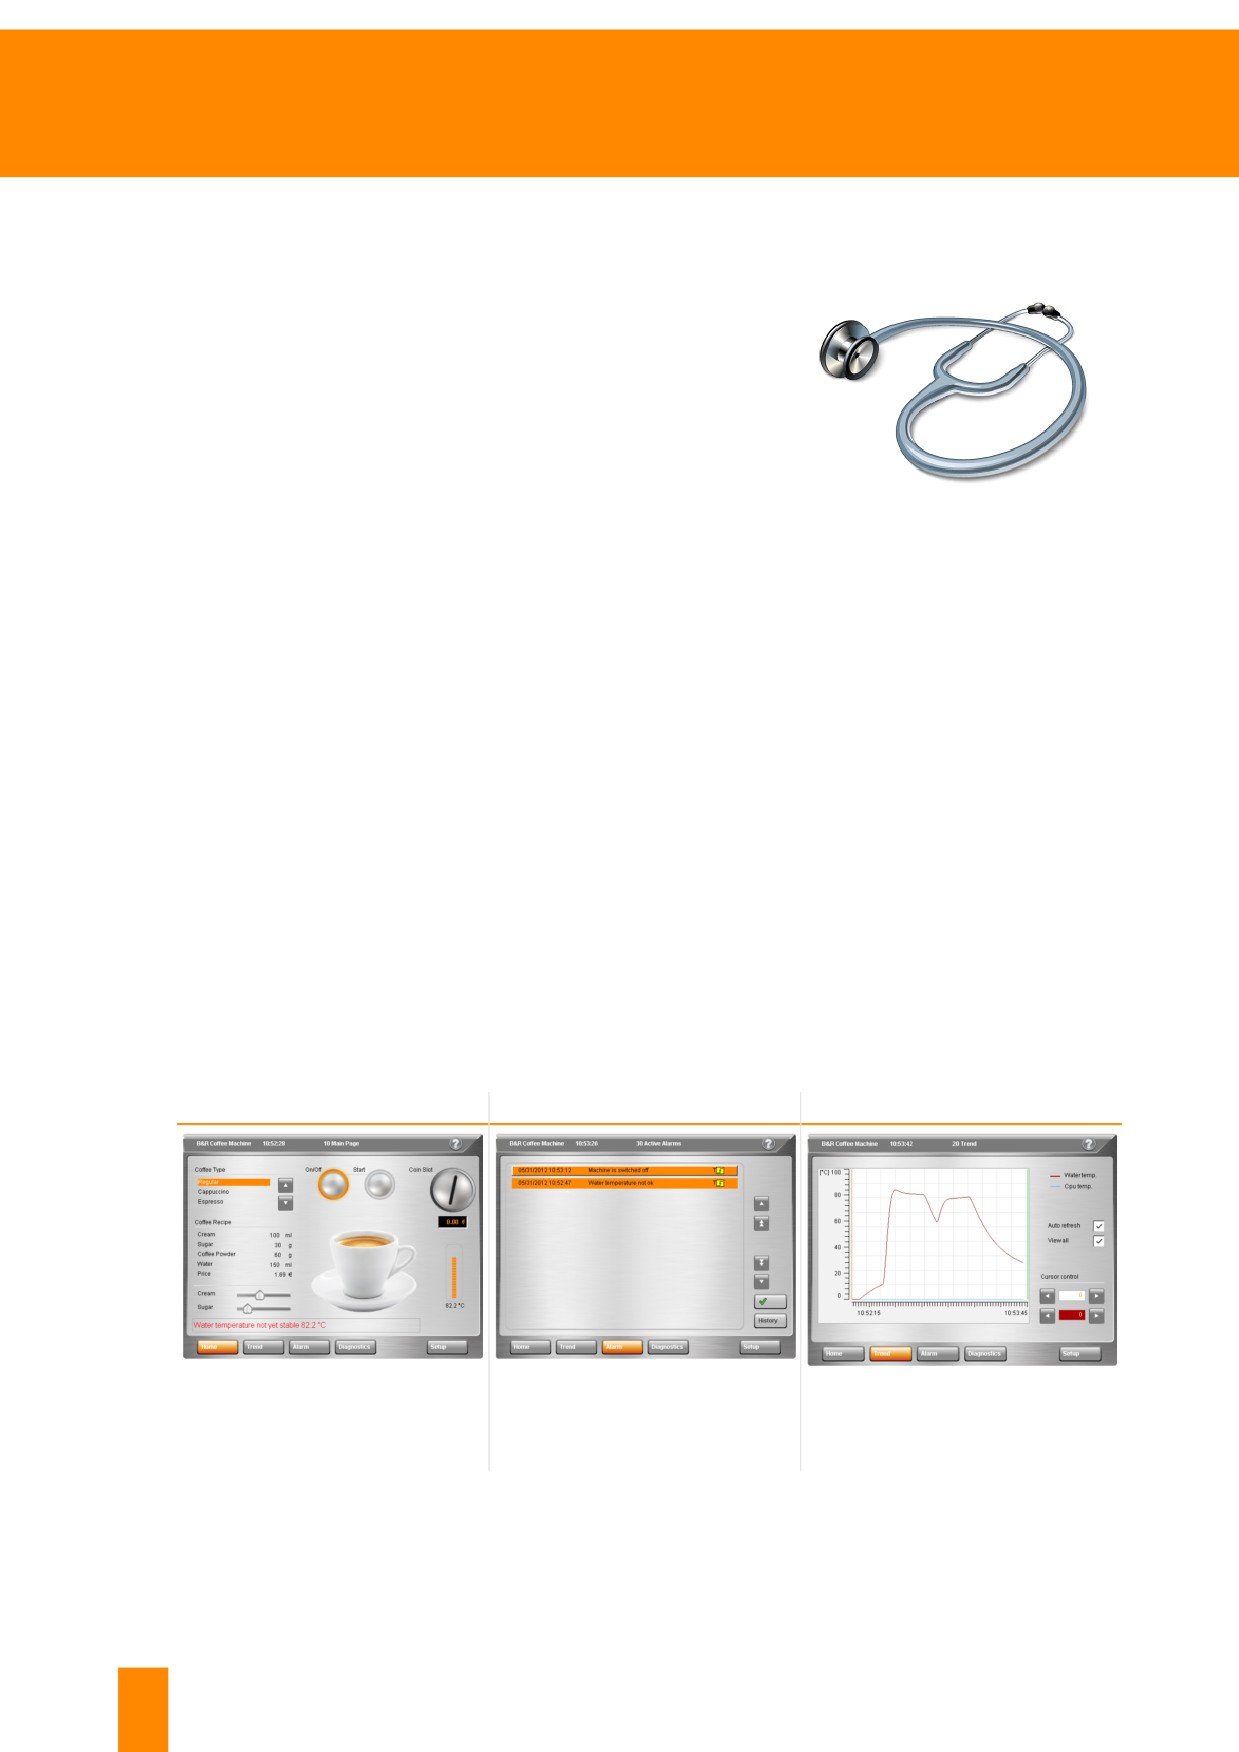
Almost every machine has a visualization. This is used to operate and diagnose the machine. Overview
pages display the most important information. Any message texts available or specialized alarm and
diagnostics pages can also provide information about the cause of the problem.
Modern visualization applications also provide a help system and instructions for working with the ma-
chine.
Overview screen
Alarm page
Trend page
Figure 25: Overview page - Everything
Figure 26: Alarms, messages and
Figure 27: Trend curves for graphic
at a glance
warnings provide information about the
representation of process values
machine status
Table 4: Sample visualization pages
32
TM920 - Diagnostics and service
Diagnostic tools
Can System Diagnostics Manager be embedded in the HMI application?
The machine's manual explains all the possibilities of the HMI application. The manufacturer
of the machine can also provide more detailed information.
It is possible that some machine manufacturers integrate System Diagnostics Manager in the
HMI application.
Further information:
•
6.1 "SDM functions" on page 40
5.1.2 Electromechanical parts, sensor, actuator
Most machines contain some optical signaling devices for diagnos-
tics of the devices connected to the machine controller. Thus many
sensors and actuators have LED status indicators.
More complex devices often feature status displays for displaying
error codes or textual information. The manufacturer's data sheet
for the sensor or actuator should explain how to interpret and under-
stand this information.
The LED status indicators on devices are generally assigned specific
functions. For example, some LED signals indicate the quality of the
measured value, while others indicate the quality of communication
with the higher level system. Different blinking patterns are used to
display additional information.
In addition to the meaning of status indicators, further important in-
formation is contained in the manufacturer data sheet or the user's
manual. For example, improper installation of a device can lead to
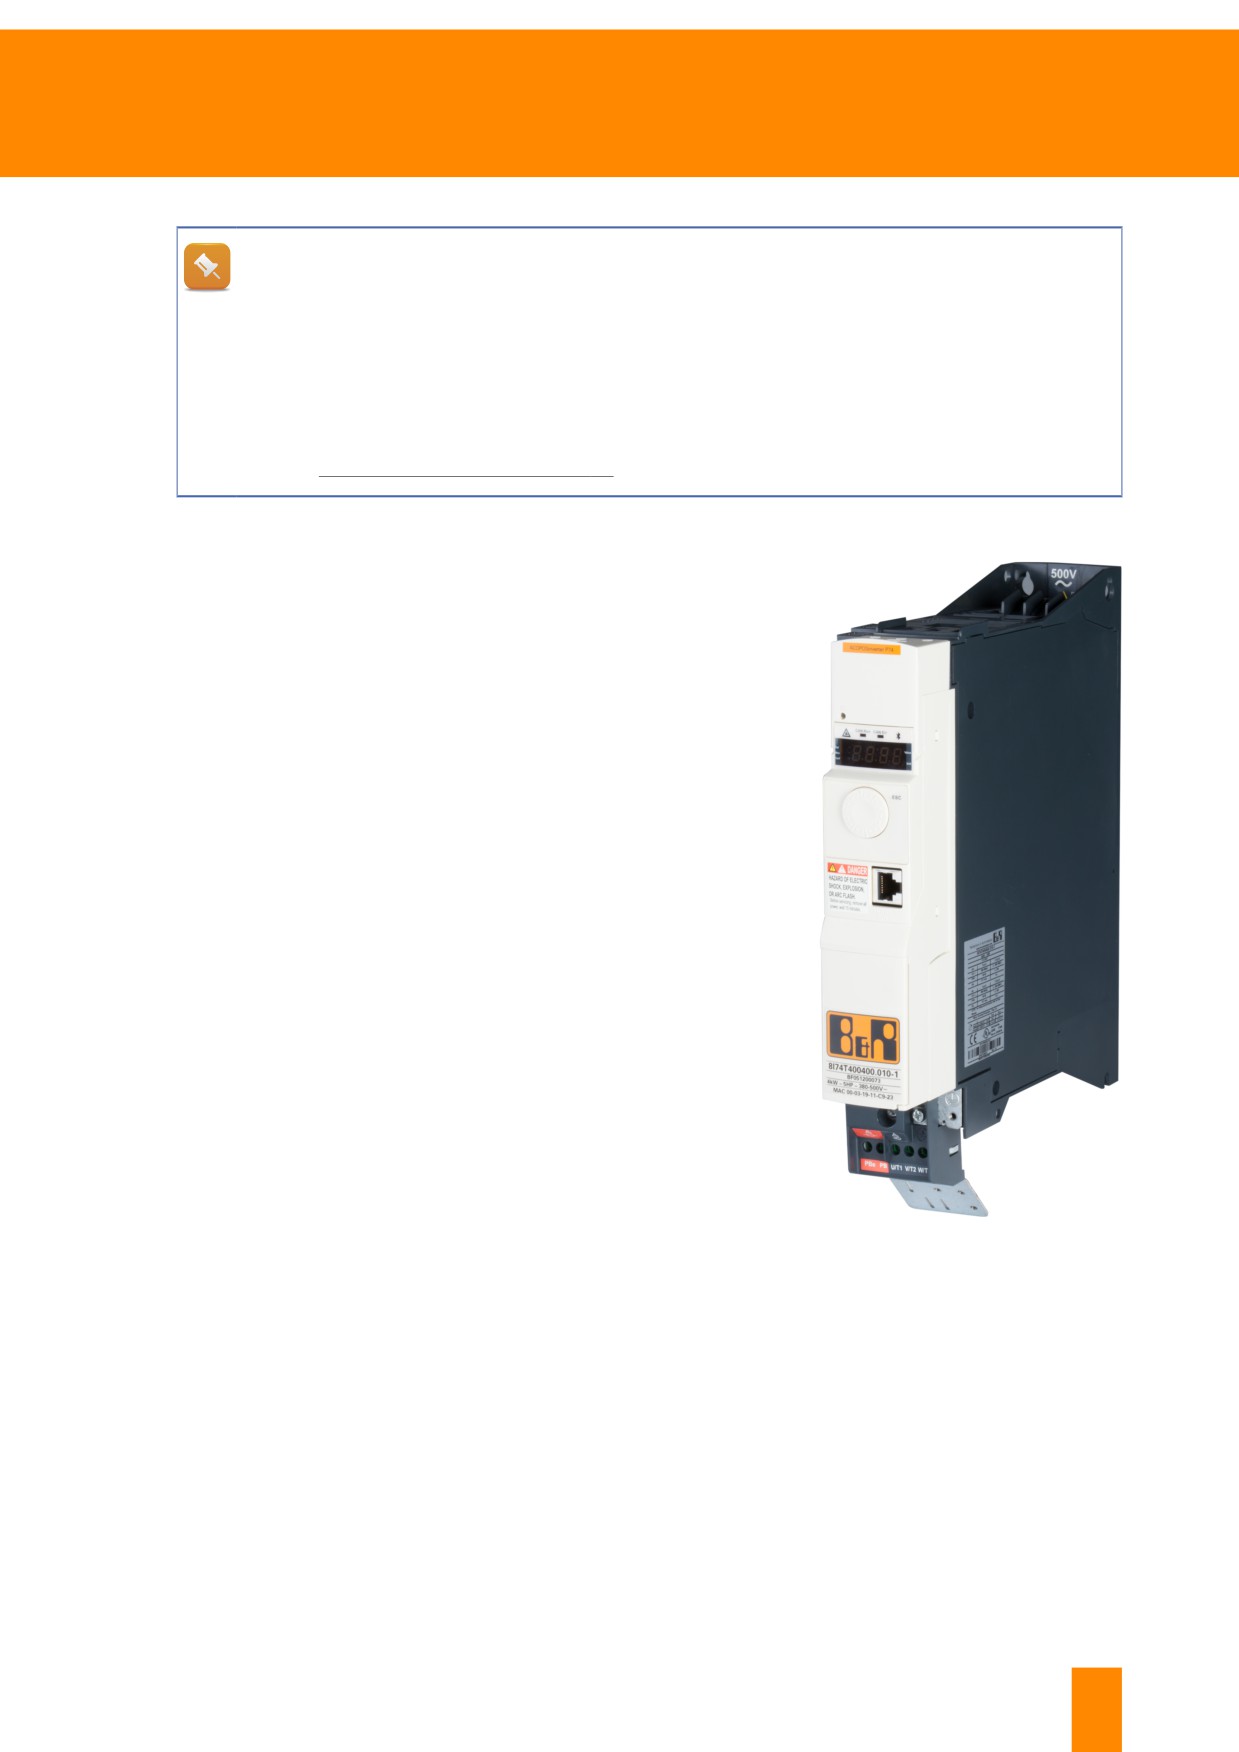
errors. The image shows the metal EMC plate. The regulations for
cable arrangement on the EMC plate can be found in the corre-
sponding user's manual. In the ACOPOSinverter P74 user's manu-
al, it can be found in chapter "Installation", subchapter "Initial Instal-
lation".
Figure 28: ACOPOSinverter P74
frequency converter with status display
and operating elements; EMC plate
below
TM920 - Diagnostics and service
33
Diagnostic tools
5.1.3 LED status indicators on the control system
All B&R devices contain LED status indicators that indicate the cur-
rent operating status and quality. The following section briefly de-
scribes what information can be obtained from the LED status indi-
cators and where to find additional information.
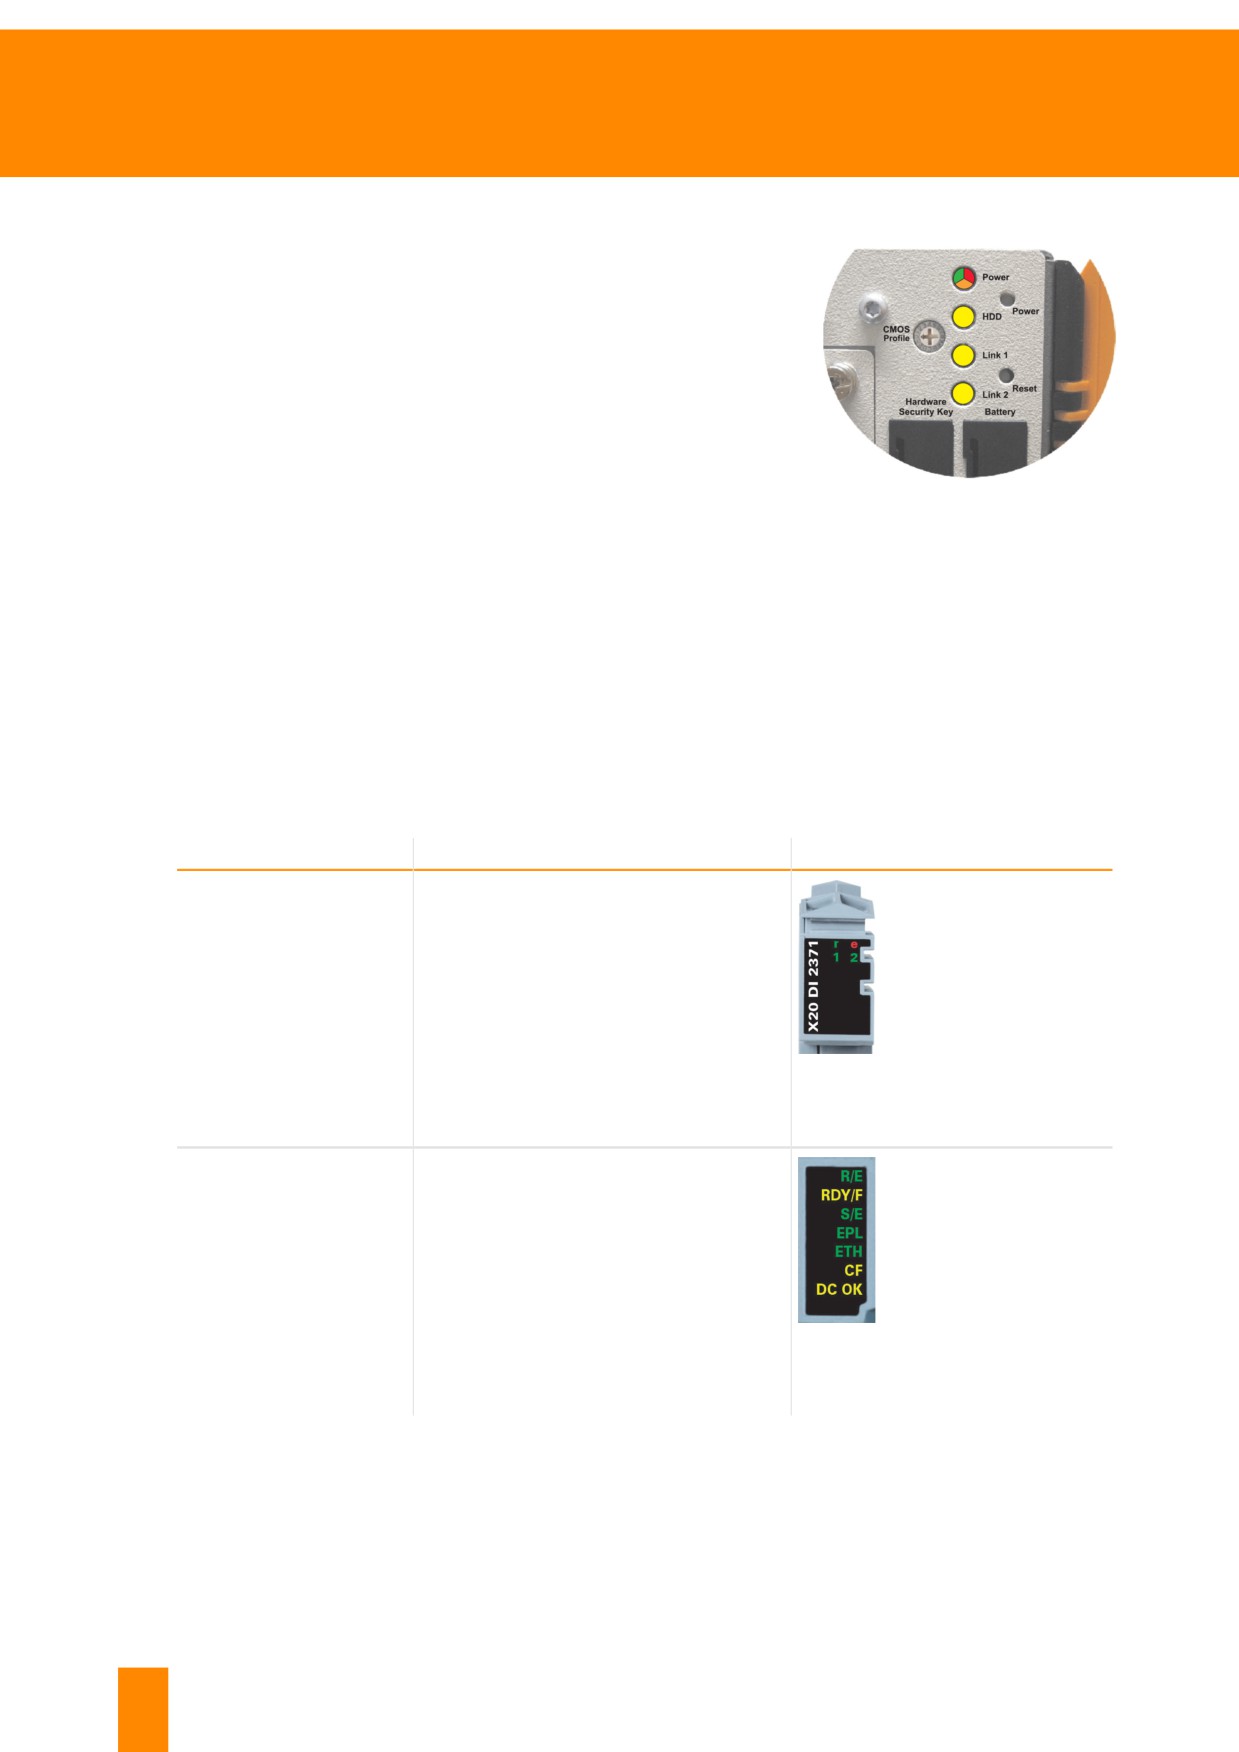
The LED status indicators on B&R devices are designed so that they
are visible from the front in the control cabinet. HMI devices are the
only exception since the LED status indicators are located on the
back of the displays.
Figure 29: LED status indicators on an
Automation PC 810
Types of LED status indicators
Each LED is assigned different functions. For instance I/O modules feature a general module status as
well as one LED status indicator per channel in order to display the channel status.
Communication interfaces also feature one or two LEDs each for displaying communication activity in
addition to the general module status. Each LED provides additional information using specific blink
codes.
The following table provides an overview of the LED types on control systems.
Device
LED information
Overview on the device
• Module status
I/O modules
• Module error
• Channel status
LED status indicators on a 2-
channel digital input module
• Module status
• Boot phase
Control CPUs
• Battery status
• CompactFlash
• Communication
LED status indicators on an X20
CPU
Table: Example of some LED status indicators on the X20 system
34
TM920 - Diagnostics and service
Diagnostic tools
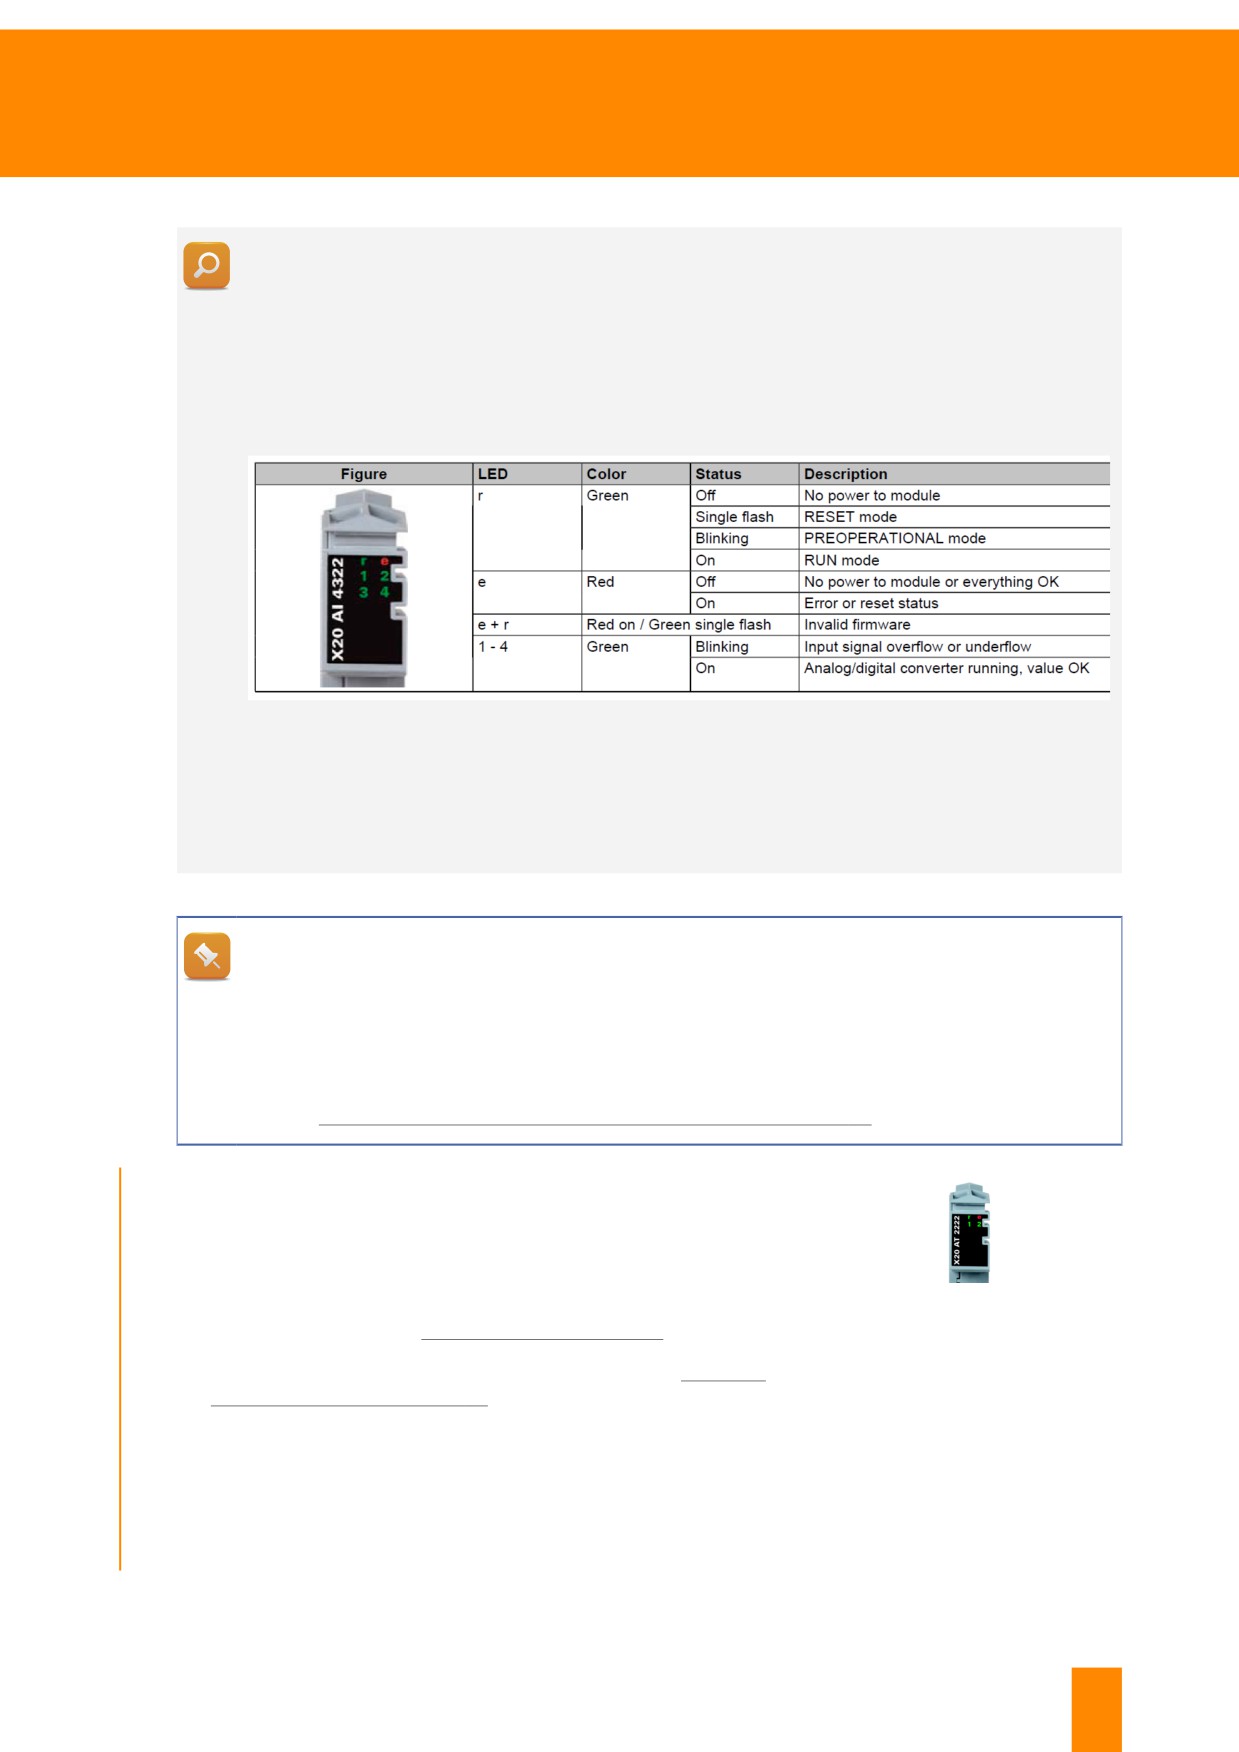
The image shows the description of the LED status indicators of the analog X20AI4322 input
module. The LED called "r" shows the module status. If LED "r" blinks, then the module is
in mode "PREOPERATIONAL". This means that the module is started internally and ready
for operation. However, modules in module "PREOPERATIONAL" have not been initialized or
configured yet. Reasons for this could be that the module has not yet been accessed, that there
is no configuration for the module in the automation project or that the bus connection to the
module is suspended.
Figure 30: Extract from data sheet X20AI4322, chapter 4 "LED status indicators"
After switching out a module, a firmware update is carried out by the controller CPU if required.
This is indicated by double flashing. You have to wait until this procedure is complete before
proceeding.
Where can I find detailed description of the LED status indicators?
To get access to the description of the LED status indicators, the serial number of the device is
required. With this information, the corresponding documents, such as data sheets and user's
manuals, can then be downloaded from the B&R website.
Further information:
•
4 "Obtaining information about the B&R system" on page 20
Exercise: Interpret X20AT2222 LED status indicators
Use the data sheet of the X20AT2222 module to interpret the LED
status indicators. LED status indicator "e" is blinking red (single
flash). What does this mean and what could cause this?
1) Visit the B&R website, www.br-automation.com
Figure 31: LED status indicators of the
X20AT2222 module
2) Search for "Data sheet X20AT2222". For help, see 4.4 "B&R
website functions" on page 24
3) Download the data sheet
4) Read chapter "LED status indicators"
5) Interpret description
TM920 - Diagnostics and service
35
Diagnostic tools
A single flash on LED "e" means there is a pending warning or error on a channel. This can be
caused by an open circuit or a value being too high or low. It is also possible that the wrong
channel type was configured or the sensor was connected to the 2-wire connections instead of
the 3-wire connections. The green flashing channel LED indicates which channel is affected.
Exercise: System overview using LED status indicators
This exercise focuses on obtaining a complete overview of the current practice system. The focus will be
on the LED status indicators of the individual components.
1) Note down all installed components
2) Visit the B&R website, www.br-automation.com
3) Search and download required data sheets and user's manuals. For help, see 4.4 "B&R website
functions" on page 24
4) Evaluate the LED status for:
° Control CPU (general operating state, interfaces, battery, CompactFlash card)
° I/O modules (general operating state, channel status)
° HMI
° Motion control (axis status, communication, encoder interface)
° Safety technology (SafeLOGIC, SafeIOs)
When is the controller ready for operation?
Only when status "RUN" is signaled for all components, it can be assumed that the control
system is working perfectly. If any component is signaling a different status, then the LED
status indicators can be used to localize the affected component, which can then be replaced
if necessary.
5.2 Diagnostics via PC
System Diagnostics Manager
System Diagnostics Manager is a web-based interface used for diagnosing B&R control systems. The
hostname or IP address of the controller as well as a web browser are needed to gain access. A separate
chapter in this documentation is dedicated to System Diagnostics Manager.
Further information:
•
6 "Diagnostics using the System Diagnostics Manager" on page 39
Which version of Automation Runtime is required?
System Diagnostics Manager was introduced with Automation Runtime version11 3.00 and later;
the integrated drive diagnostics was introduced with Automation Runtime 3.08 and later. To
make System Diagnostics Manager available, it needs to be enabled in the application program.
11 The Automation Runtime version can be read in the Runtime Utility Center using command "AR Version".
For step-by-step instructions, see 8.1.5 "Outputting data via online connection" on page 78.
36
TM920 - Diagnostics and service
Diagnostic tools
mapp technology WebXs
If mapp Technology components were used for creating applications, they can be shown via the mapp di-
agnostic page "WebXs". The components deliver comprehensive status information that is helpful when
communicating directly with the machine manufacturer.
Further information:
•
6.7 "Information about the application status in WebXs" on page 54
Which version of Automation Runtime is required?
mapp Technology WebXs was introduced as of Automation Runtime 4.08 and later. mapp We-
bXs must be enabled in the application program so that this diagnostic option becomes avail-
able.
Runtime Utility Center
The Runtime Utility Center can be used for all B&R systems with Automation Runtime. It permits a
connection to be created over a serial interface and the Ethernet interface.
The Runtime Utility Center is a service tool and can be downloaded from the B&R website. In some
additional chapters in this documentation, the functions of the Runtime Utility Center are explained in
more detail.
Further information:
•
8.1 "Backing up and restoring using the Runtime Utility Center" on page 70
•
10.2 "Where SDM and Runtime Utility Center can be used" on page 84
HMI Diagnostics tool
The HMI diagnostics tool is downloaded from the B&R website and is used for reading device data from
B&R industrial PCs. The data provides information about operating hours, components used and the
Windows installation used.
PVI Snapshot Viewer
The Process Visualization Interface (PVI) is a communication service between Windows applications
and B&R controllers. The PVI Snapshot Viewer is used to troubleshoot the connection between the PC
and controller. It displays the connected process variables and their statuses.
OPC UA is used to transfer data in modern applications. A separate logger file for troubleshooting can
be found in System Diagnostics Manager.
HMI Service Center
HMI Service Center is delivered preinstalled on a bootable USB flash drive from B&R. It can be used
to read device data from B&R Industrial PCs, Panel PCs, Automation Panels, interface options and I/
O boards.
Embedded OS Installer
Functions for backing up and restoring Windows installations are available via the Embedded OS In-
staller, which is also downloaded via the B&R website. Images can be backed up and restored. Func-
tions include:
TM920 - Diagnostics and service
37
Diagnostic tools
• Easy installation of B&R Windows CE and B&R Windows XP Embedded.
• Installation of customized Windows CE and Windows XP Embedded images.
• Simple installation of MS-DOS on a USB flash drive.
• Creating a USB flash drive for a B&R upgrade (Bios, MTCX12).
• Simple installation of Windows Embedded Standard 7 setup files on a USB flash drive.
• Disk image generation and backup.
• File manager for editing existing disk images.
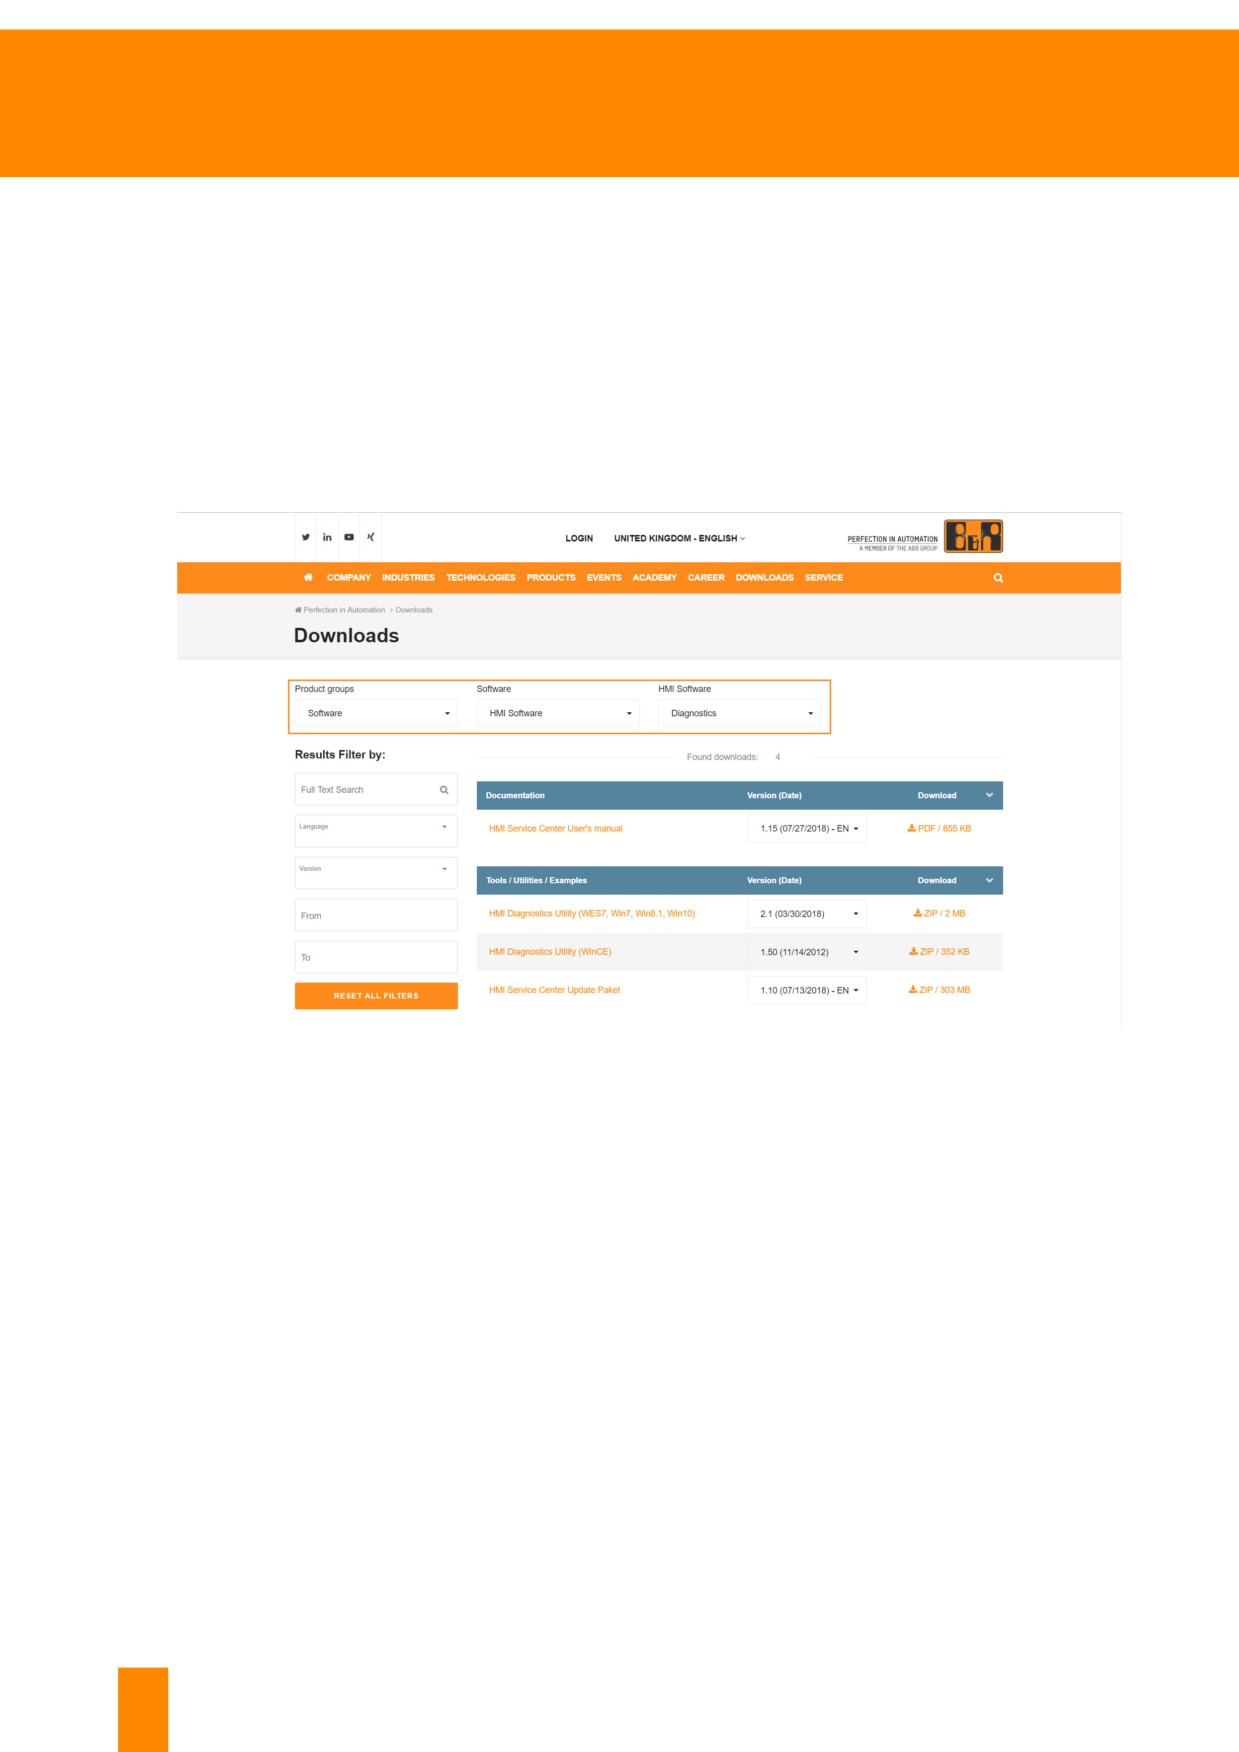
The downloads for the HMI tools are stored in section "Downloads" in category "Software / HMI software".
The installation of the HMI tools is only possible on Windows operating systems.
Figure 32: HMI software in the download section of the B&R website
12 The MTCX (Maintenance Controller Extended) is located on the CPU board of the device. It is responsible
for the following monitoring and control functions.
38
TM920 - Diagnostics and service
Diagnostics using the System Diagnostics Manager
6 Diagnostics using the System Diagnostics Manager
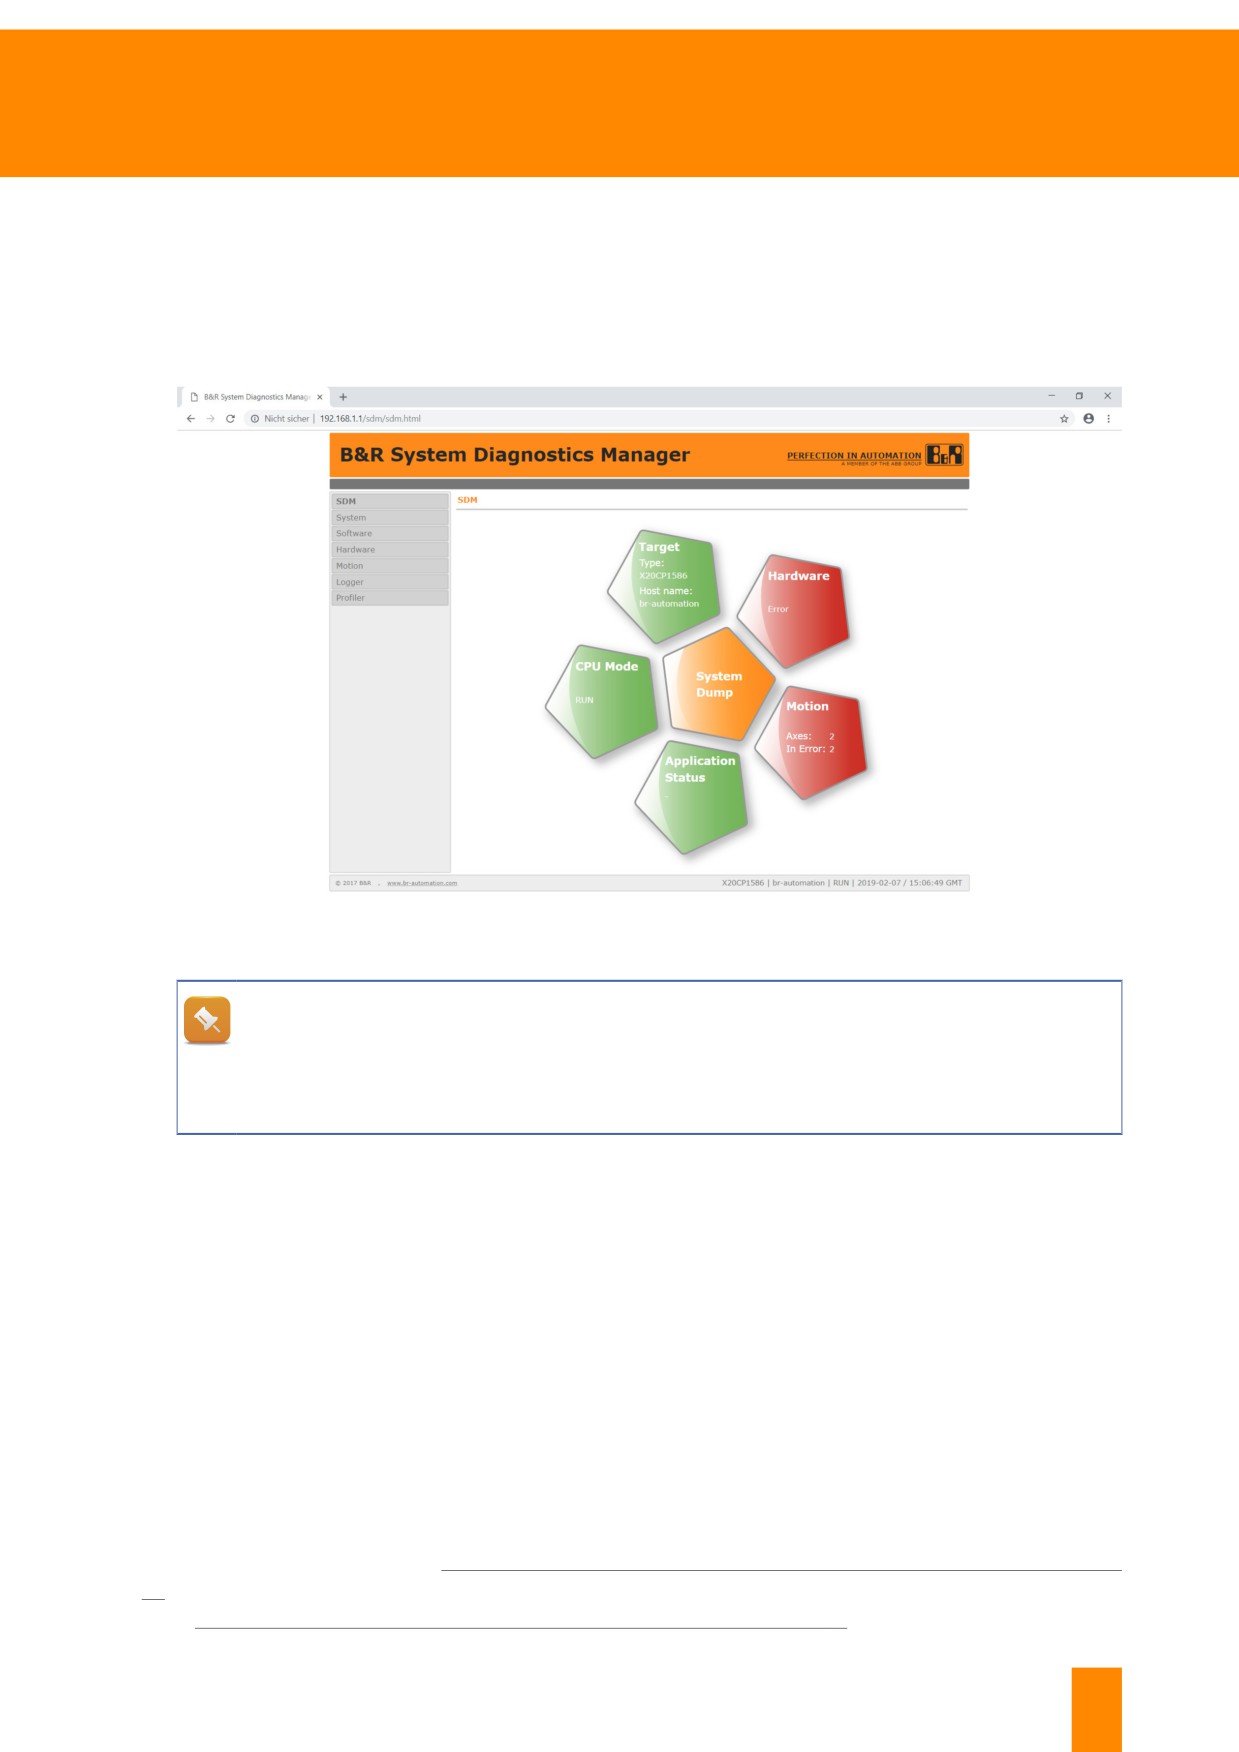
B&R controller components come with an extensive diagnostics interface. This interface is called "Sys-
tem Diagnostics Manager" or "SDM" for short. The controller is accessed using Google Chrome via the
IP address or hostname of the controller13.
SDM is accessed using a web browser via the link "http://ip-address/SDM".
Figure 33: System Diagnostics Manager homepage
Can System Diagnostics Manager be embedded in the HMI application?
Depending on the machine visualization application, some of the SDM pages may already be
embedded in the HMI application. This is described in greater detail in the manual provided by
the machine manufacturer.
13 SDM can generally be enabled on all B&R control systems with integrated web server by the machine
manufacturer. Alternatively, the 8.1 "Backing up and restoring using the Runtime Utility Center" on page
70 can be used. A comparison of the possibilities in SDM and in the Runtime Utility Center is provided
here: 10.2 "Where SDM and Runtime Utility Center can be used" on page 84
TM920 - Diagnostics and service
39
Diagnostics using the System Diagnostics Manager
6.1 SDM functions
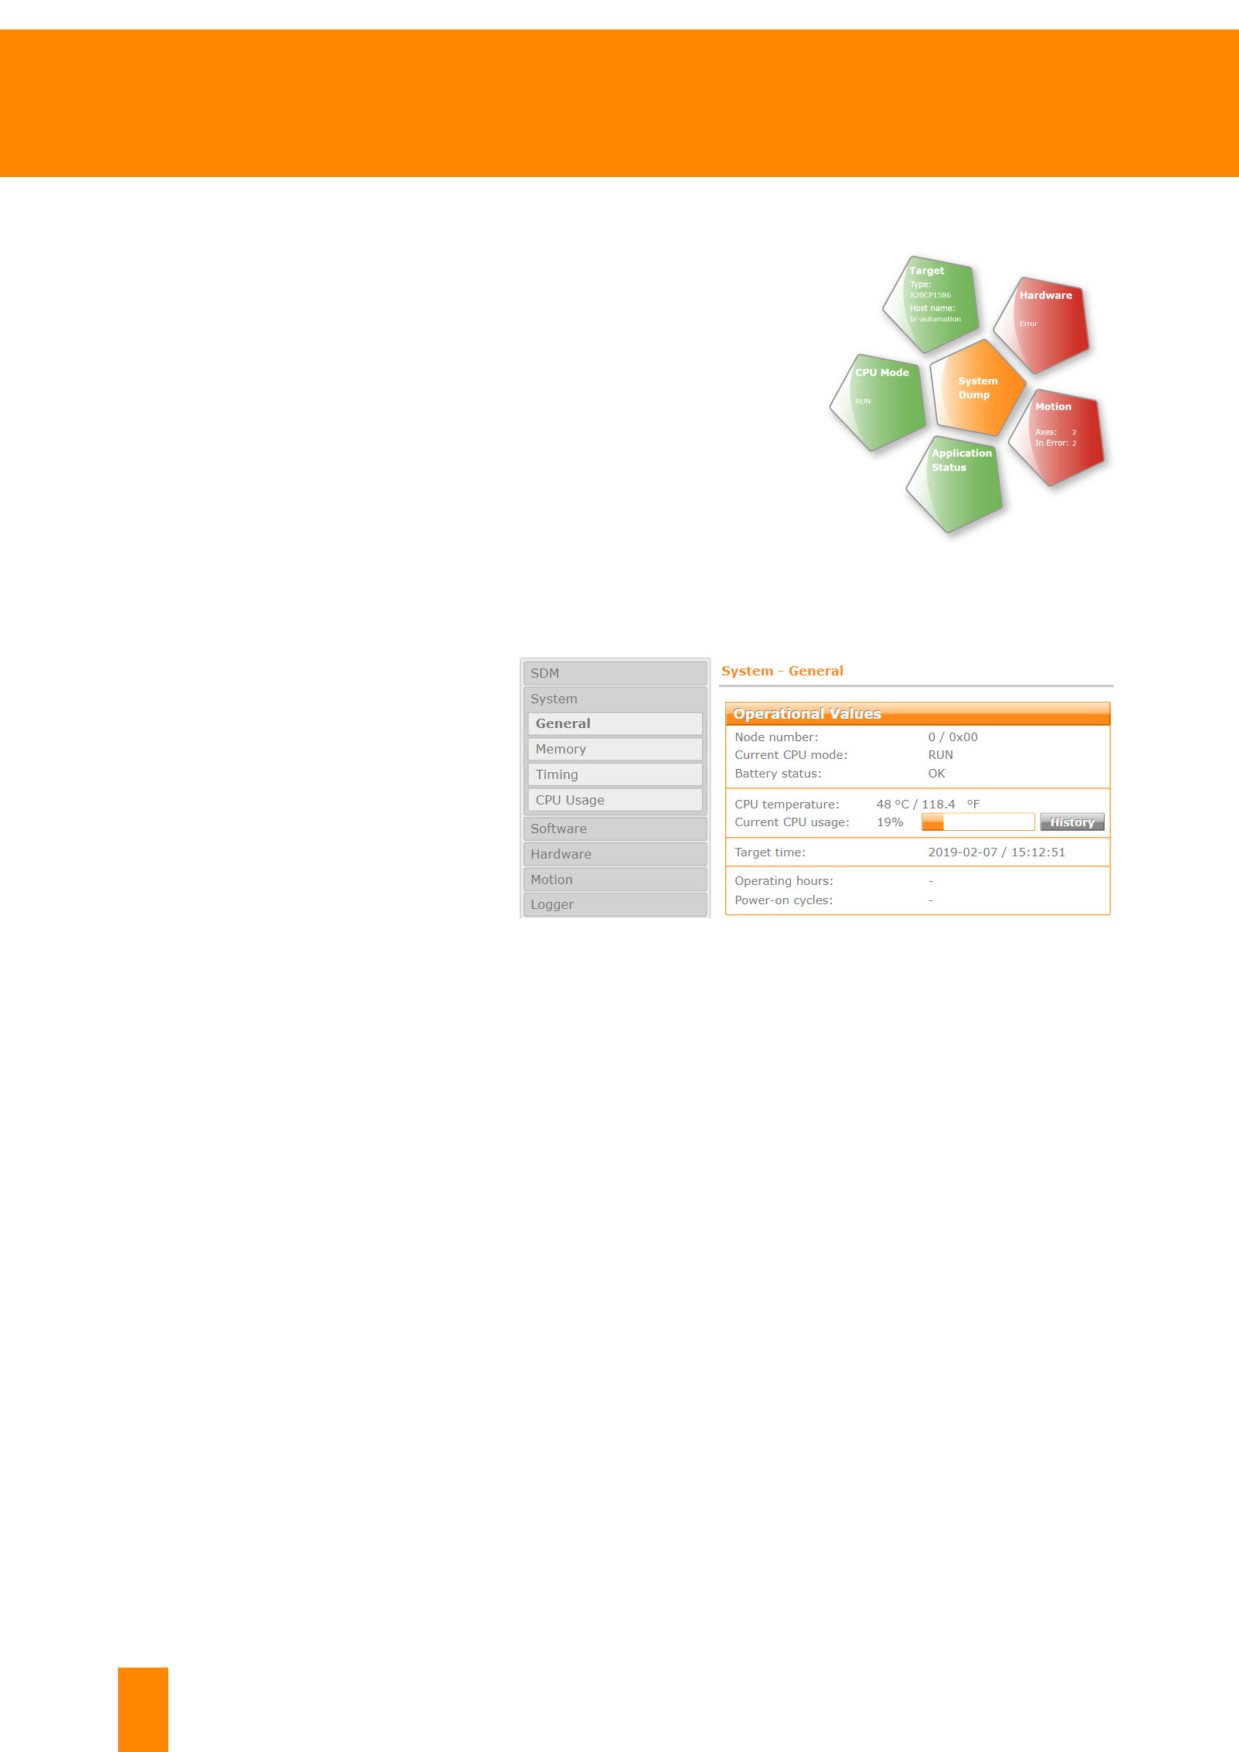
The most important functions in SDM can be accessed via the home-
page. A system dump can be generated via the button in the center,
see 6.4 "Generating and saving a system dump" on page 47. All
relevant information sources and Logger files from the controller are
then loaded. These files can be used for further diagnostics.
The other buttons can be used to request information about the in-
dividual parts of the controller. The information displayed on these
in-depth pages can also be saved as a file.
Figure 34: Areas of System Diagnostics
Manager
General system overview
The general system overview con-
tains data such as the battery sta-
tus, CPU usage and the basic sys-
tem settings. The configured CPU
timing and memory usage is also
displayed.
Figure 35: General system overview
40
TM920 - Diagnostics and service
Diagnostics using the System Diagnostics Manager
Displaying and saving Logger files
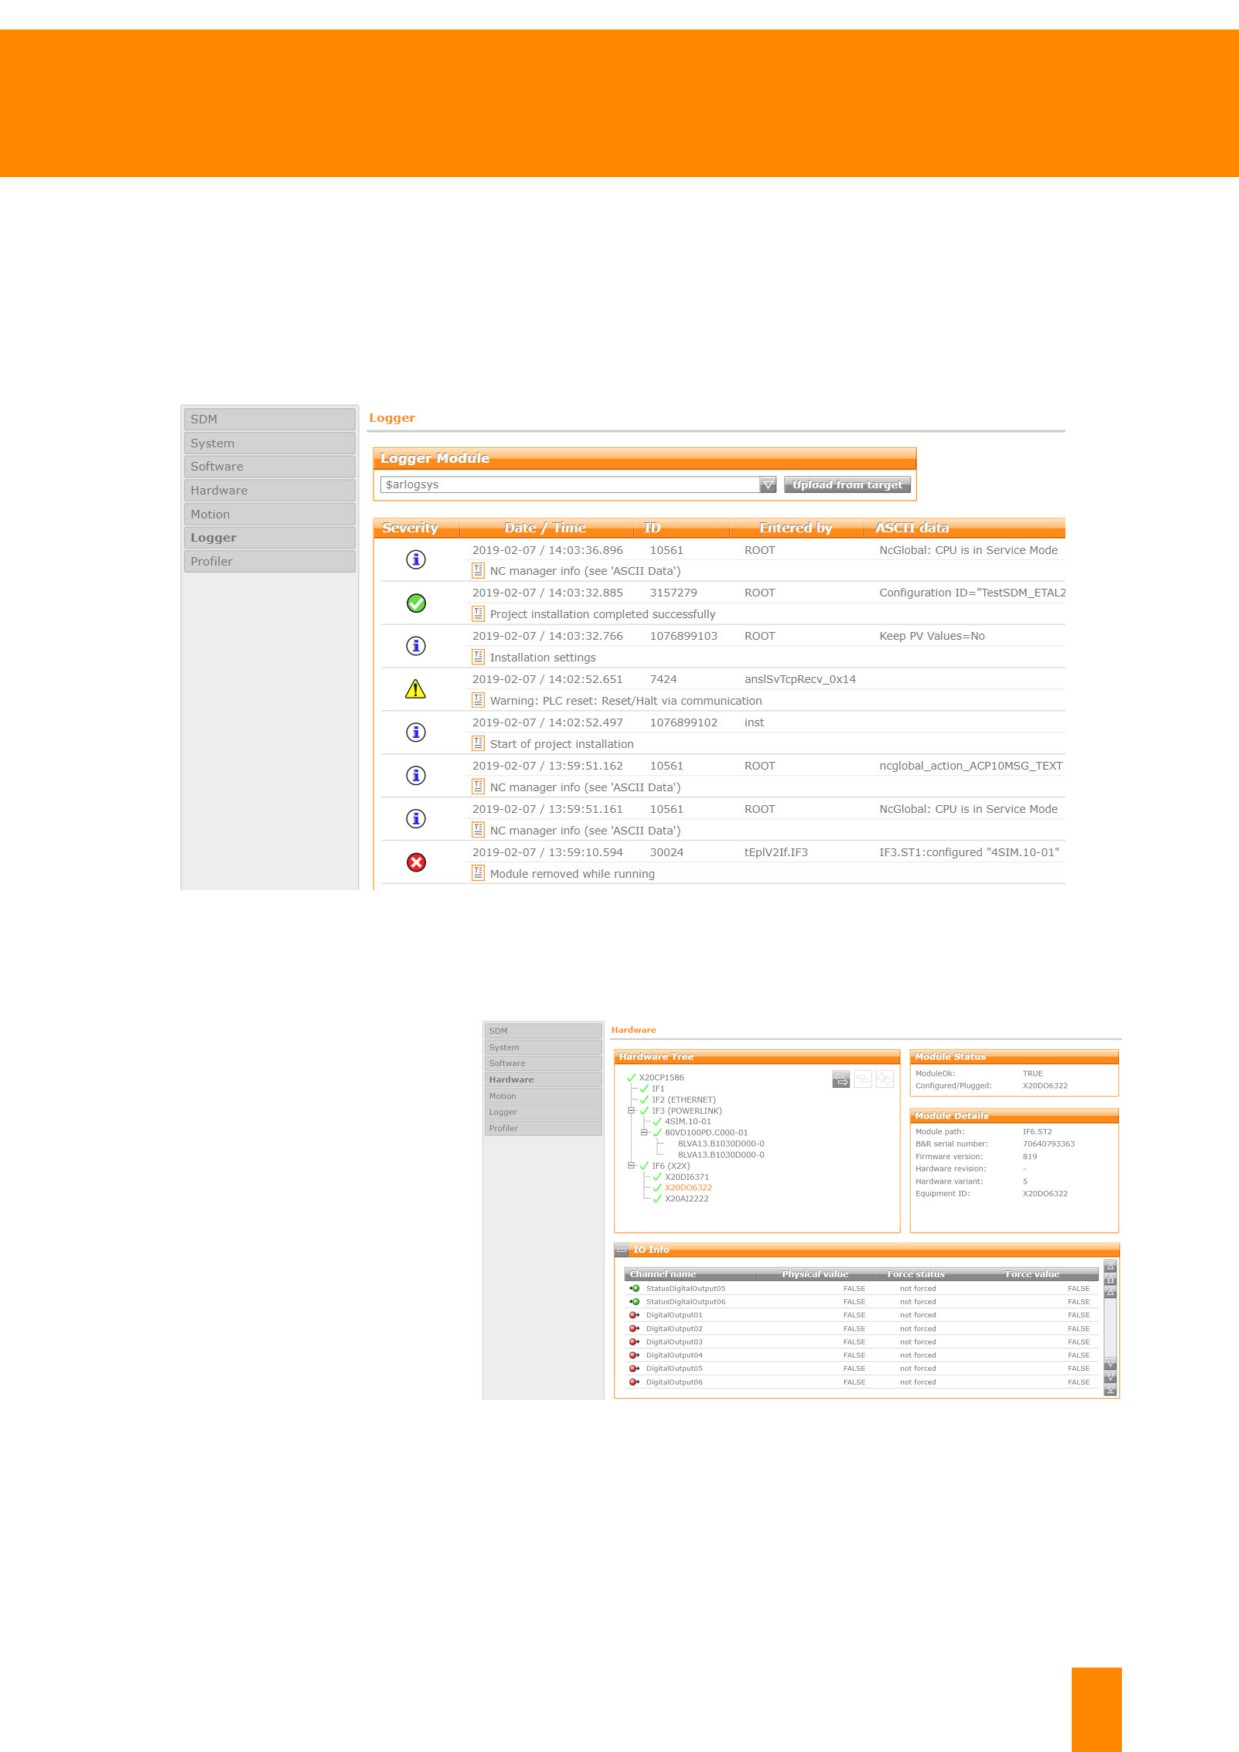
The B&R control system monitors itself. Relevant and important information about the system status is
displayed in a list. The Logger files are displayed for further analysis in SDM or uploaded and saved by
the controller. Data refer to the control system, integrated safety technology, fieldbuses or user events
triggered by the control program. Machine manufacturers are provided with functions to create their own
Logger files that, for example, log all events of the machine sequence.
Figure 36: Display of Logger files in SDM
Hardware modules and I/O status
The hardware diagnostics pro-
vided by SDM are particularly
helpful. This makes it possible
to diagnose the entire control
system status at once. The se-
rial numbers of the hardware
modules are listed. An addi-
tional function is reading chan-
nel data from various I/O mod-
ules. At the bottom part of the
window, information about the
current values of inputs and
outputs is displayed.
Figure 37: Hardware information and I/O status
TM920 - Diagnostics and service
41
Diagnostics using the System Diagnostics Manager
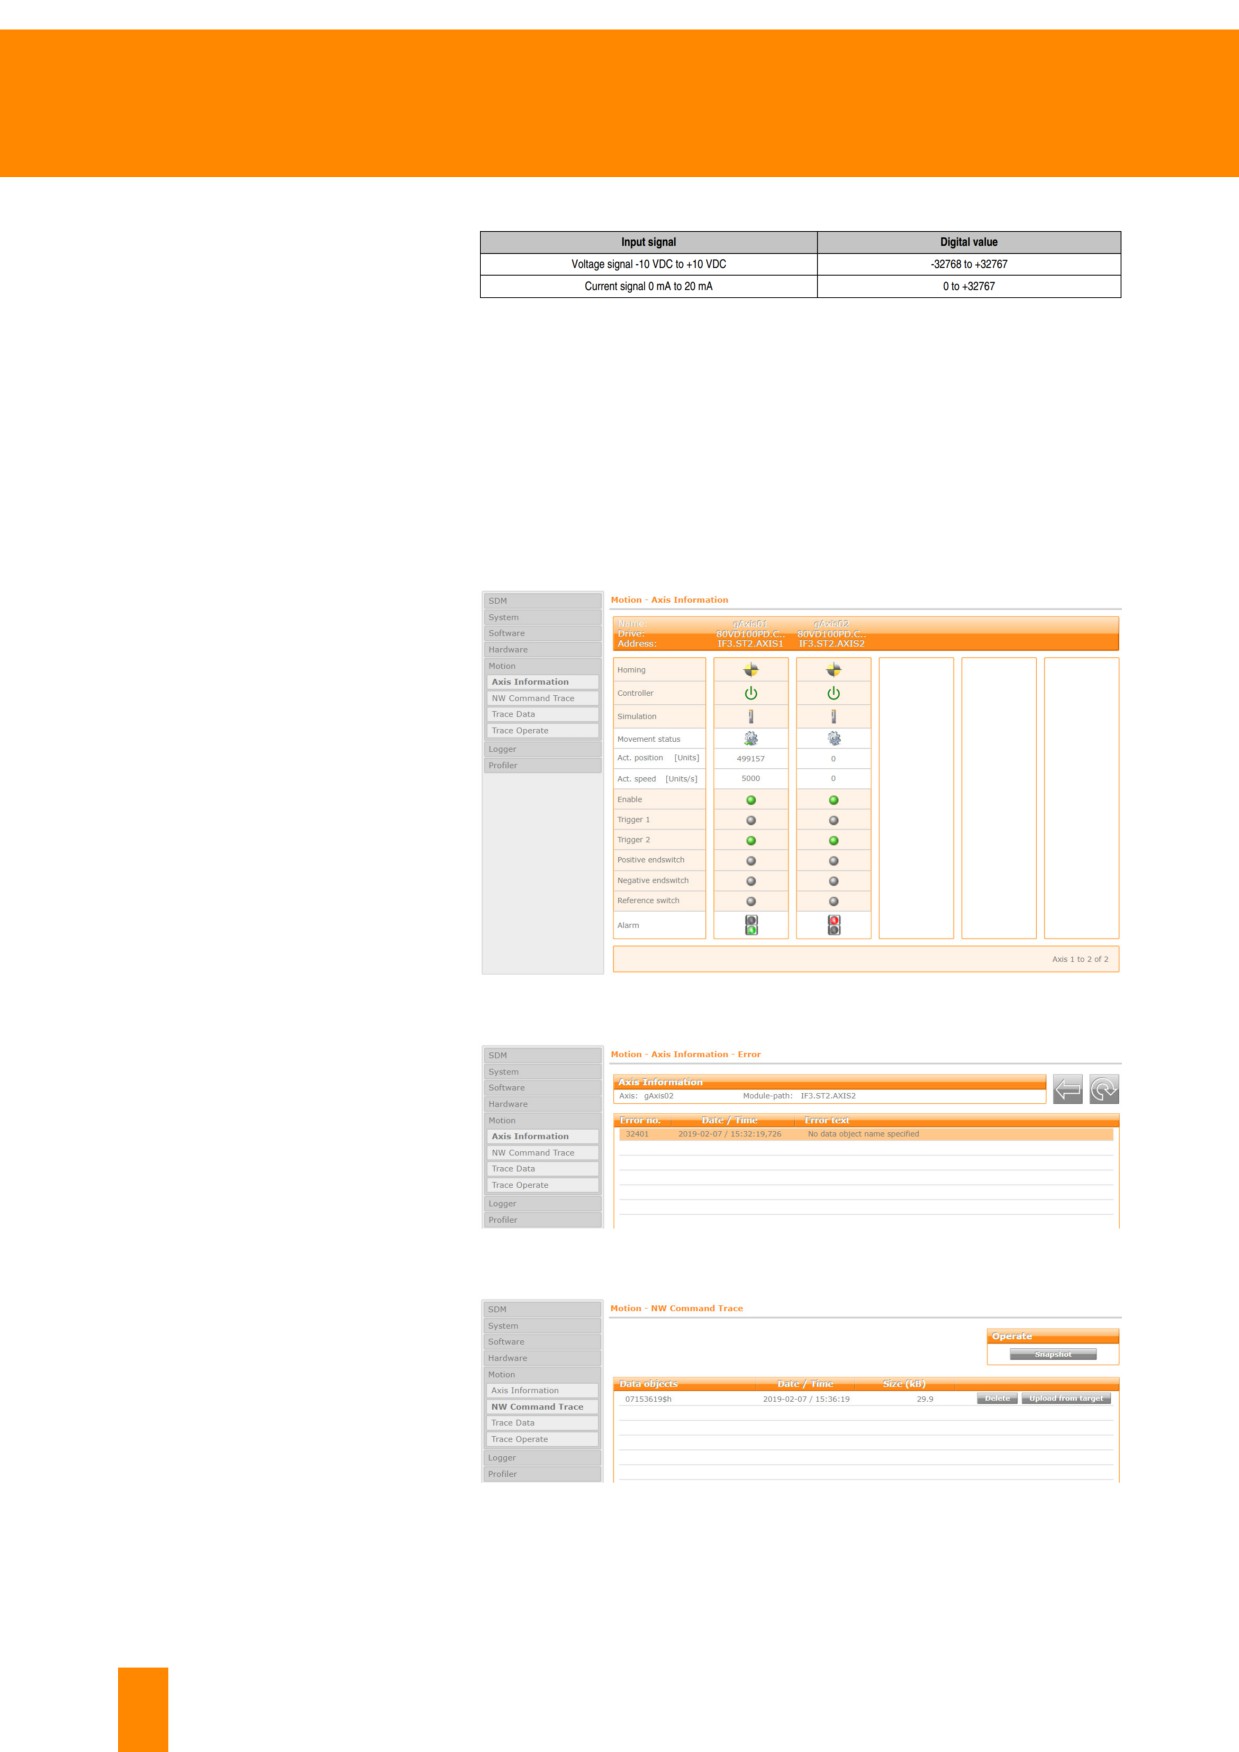
With analog modules, volt-
ages and currents are con-
verted into numerical values
which can be processed on
the controller. Independent of
the resolution, the numerical
Figure 38: Display of measure values of voltage and currents (extract from X20 user's
values exist predominantly in
manual)
the 16-bit 2s complement.
Additional information
•
6.5 "Information in the hardware tree" on page 48
•
6.6 "Diagnostics via I/O and status data points" on page 52
Motion control
Diagnostic options are avail-
able for machines with drive
technology via the SDM's Mo-
tion diagnostics. The axis sta-
tus, homing status, current po-
sition and movement status
are shown. If an error occurs,
additional information such as
the axis error list can be ob-
tained by clicking on the traffic
light icon.
Figure 39: Displaying the axis diagnostics, all axis objects are listed
In the axis error list, the axis
error numbers are displayed
with the corresponding clear
text description and time-
stamp.
Figure 40: Displaying the axis error list for a selected axis object
The network command trace
logs commands that are sent
to and from the drive. Button
"Snapshot" is pressed in or-
der to take a snapshot of the
data. Any data object on the
displayed list can be uploaded
or saved. It is only possible to
analyze the data in Automa-
tion Studio.
Figure 41: List of the recorded network command trace data objects
42
TM920 - Diagnostics and service
Diagnostics using the System Diagnostics Manager
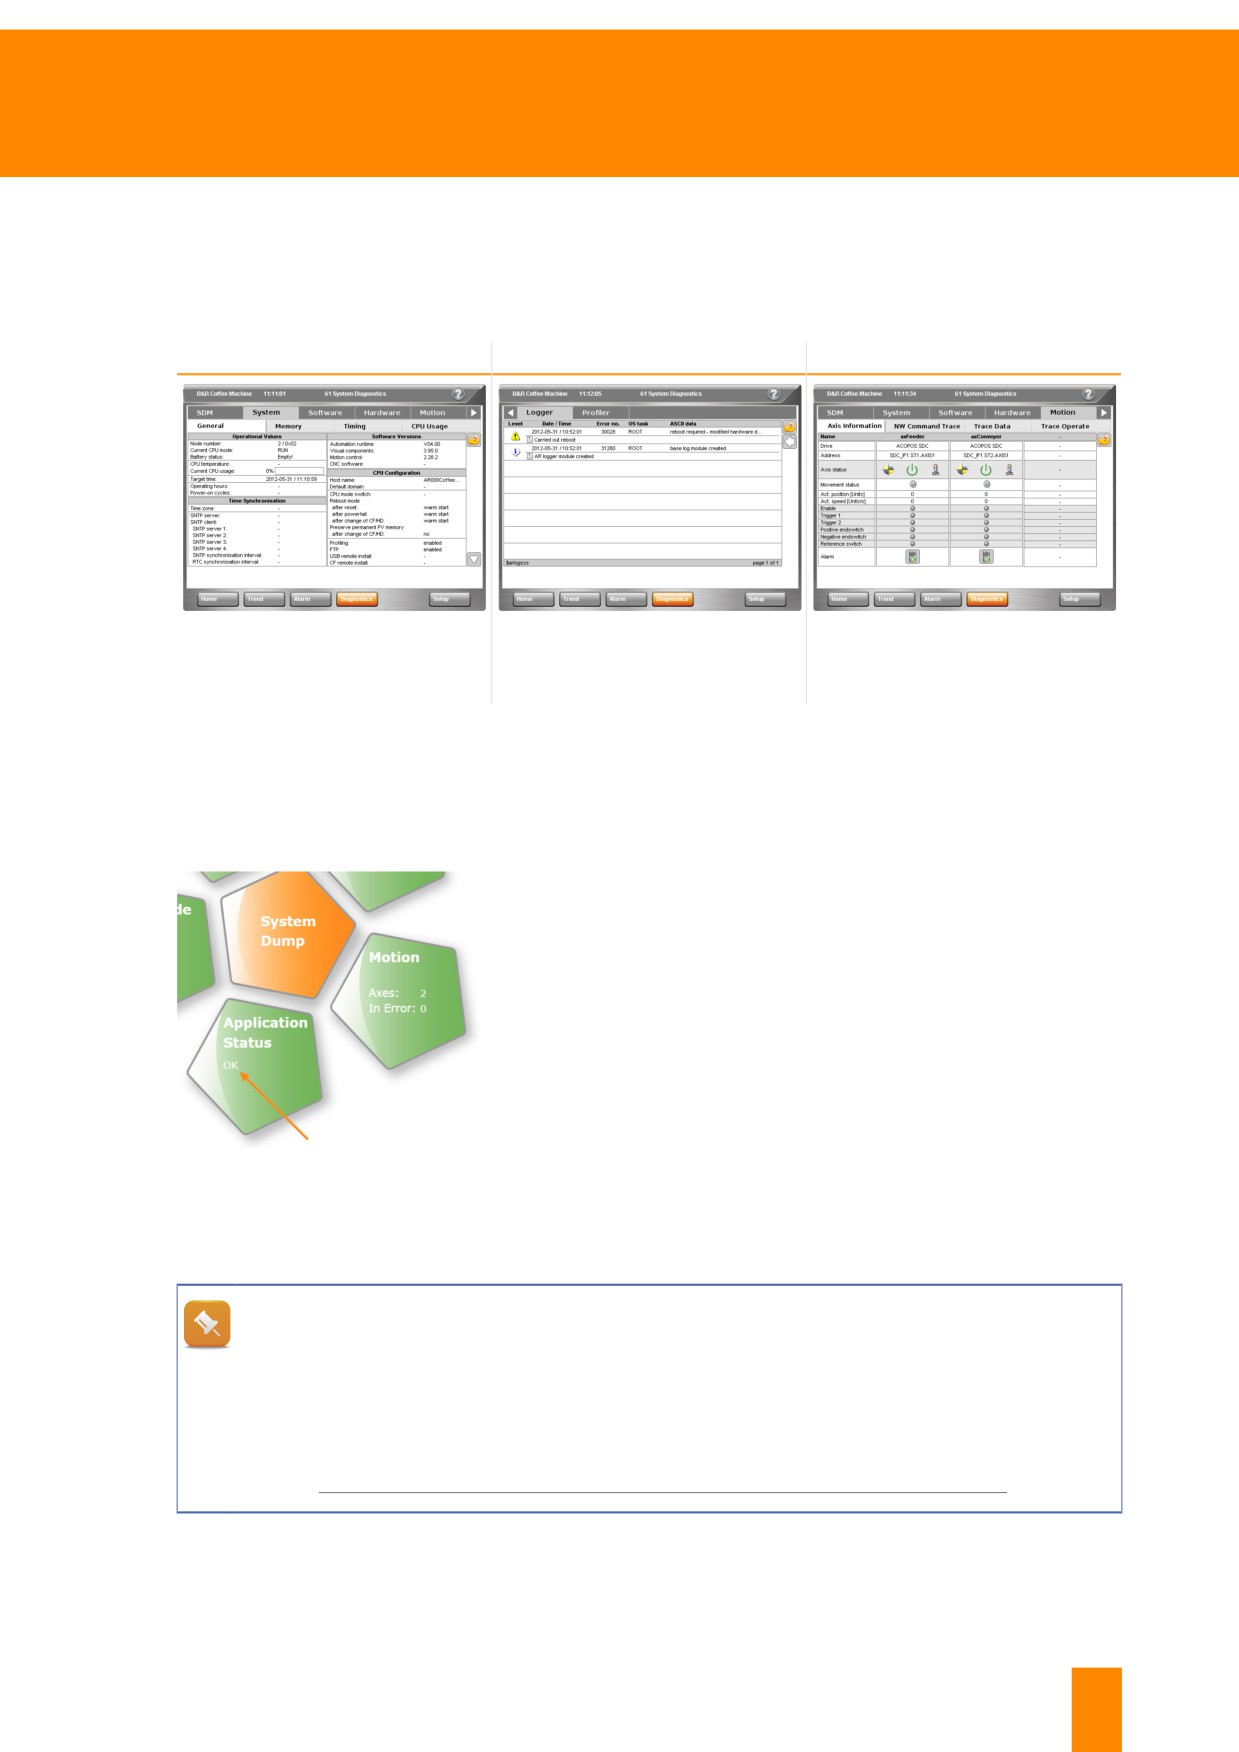
Embedded SDM in the HMI application
Machine manufacturers are able to integrate the SDM right in the HMI application. The same functions
are available as those provided when running the SDM in a web browser. Just the display of diagnostic
pages differs a bit from the embedded SDM version.
System overview
System logger
Drive technology diagnostics
Figure 42: SDM system overview
Figure 43: SDM system logger
Figure 44: SDM drive technology
diagnostics
Embedding of application specific data
The System Diagnostics Manager (SDM) enables application specific data be accessible by software
developers. Status information relating to a controller application can be shown by pushing the "appli-
cation status" button.
If the "Application Status" function in the application is not used, you
end up directly on the start page of mapp Technology WebXs (if this
is enabled).
Figure 45: "Application status" button in
SDM
Can SDM be used to upload a software object?
System Diagnostics Manager can be used to view the system status and general system infor-
mation. There are no functions provided for manipulating process variables or uploading/down-
loading software objects. The Runtime Utility Center can be used for such application situations.
Further information:
•
8.1 "Backing up and restoring using the Runtime Utility Center" on page 70
TM920 - Diagnostics and service
43
Diagnostics using the System Diagnostics Manager
Exercise: System overview with the help of SDM
Use the SDM to get a general overview of the practice system. Check the general system status, the
system usage, the overview of hardware modules and the status of the motion components.
1) Establishing a connection to the SDM
2) Check system status
3) Check system usage and make a note of the maximum values
4) Make a note of the battery status
5) Have a look at the overview of hardware modules and check the status of the individual modules
6) Call up the status of the motion components
While the LED status indicators can be used to obtain a good overview of the control system's
overall status, SDM makes it easier to view all of this information at once. SDM is a better
option for larger machines with distributed control cabinets, control components hard to access
or when running remote diagnostics.
6.2 Establishing a connection to the SDM
Before connecting to the controller, the network configuration of the PC in use may have to be modified
(10.3 "Changing network settings on the PC" on page 86). It is recommended to make a note of the
original settings before doing this.
A standard network cable is used to connect with the controller. The LED status indicators of the PC and
the controller indicate whether there is an online connection or not.
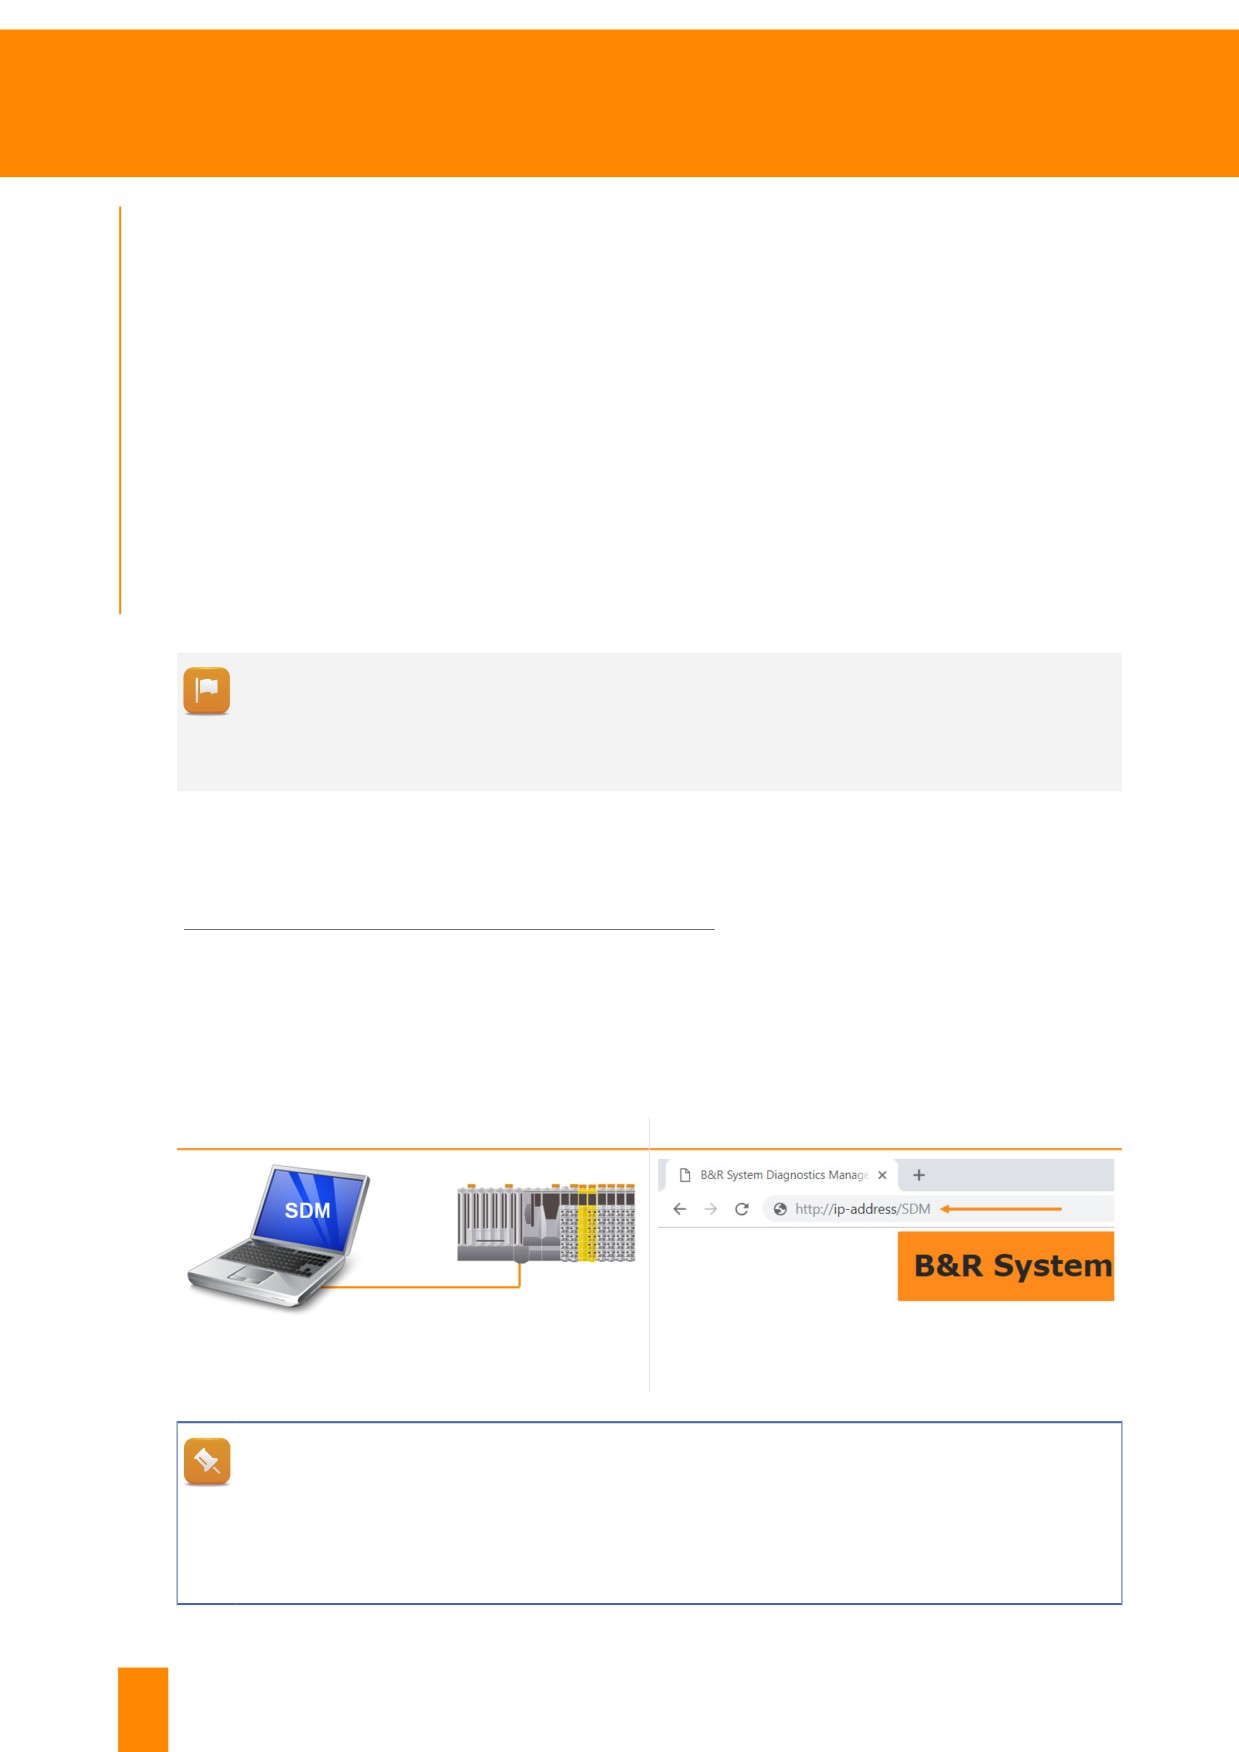
The connection to SDM is made via the controller's IP address or hostname. SDM is accessed via the
browser14 using link"http://ip-address/SDM".
Step 1 - Connect PC to controller
Step 2 - View SDM in web browser
Figure 47: Accessing the SDM via web browser
Figure 46: Connecting PC to controller via network cable
Which browser is required?
An SVG-capable web browser is required to view SDM pages. Most current web browsers
support this. An SVG plug-in is offered when using older browsers. If viewing SVGs is still
not possible, then an HTML view of System Diagnostics Manager can also be accessed via
"http://IP-address/sdm-vga".
14 B&R recommends using Google Chrome as your browser.
44
TM920 - Diagnostics and service
Diagnostics using the System Diagnostics Manager
Which IP address must be entered in the browser?
The controller's IP address or hostname can be found in the documentation provided or re-
quested directly from the manufacturer. In some cases, the set IP address is written on the
control cabinet.
6.3 Saving Logger files
The Logger records important system events in several Logger files. The events are displayed as a list
using SDM. The machine manufacturer has the option to record events via the application program in
Logger files.
Why are there multiple Logger files?
Several Logger files with different affiliations can exist on the B&R control system. The controller
may also contain Logger files for fieldbuses, integrated safety technology or machine events,
for example.
If necessary, back up each Logger file individually or perform a system dump.
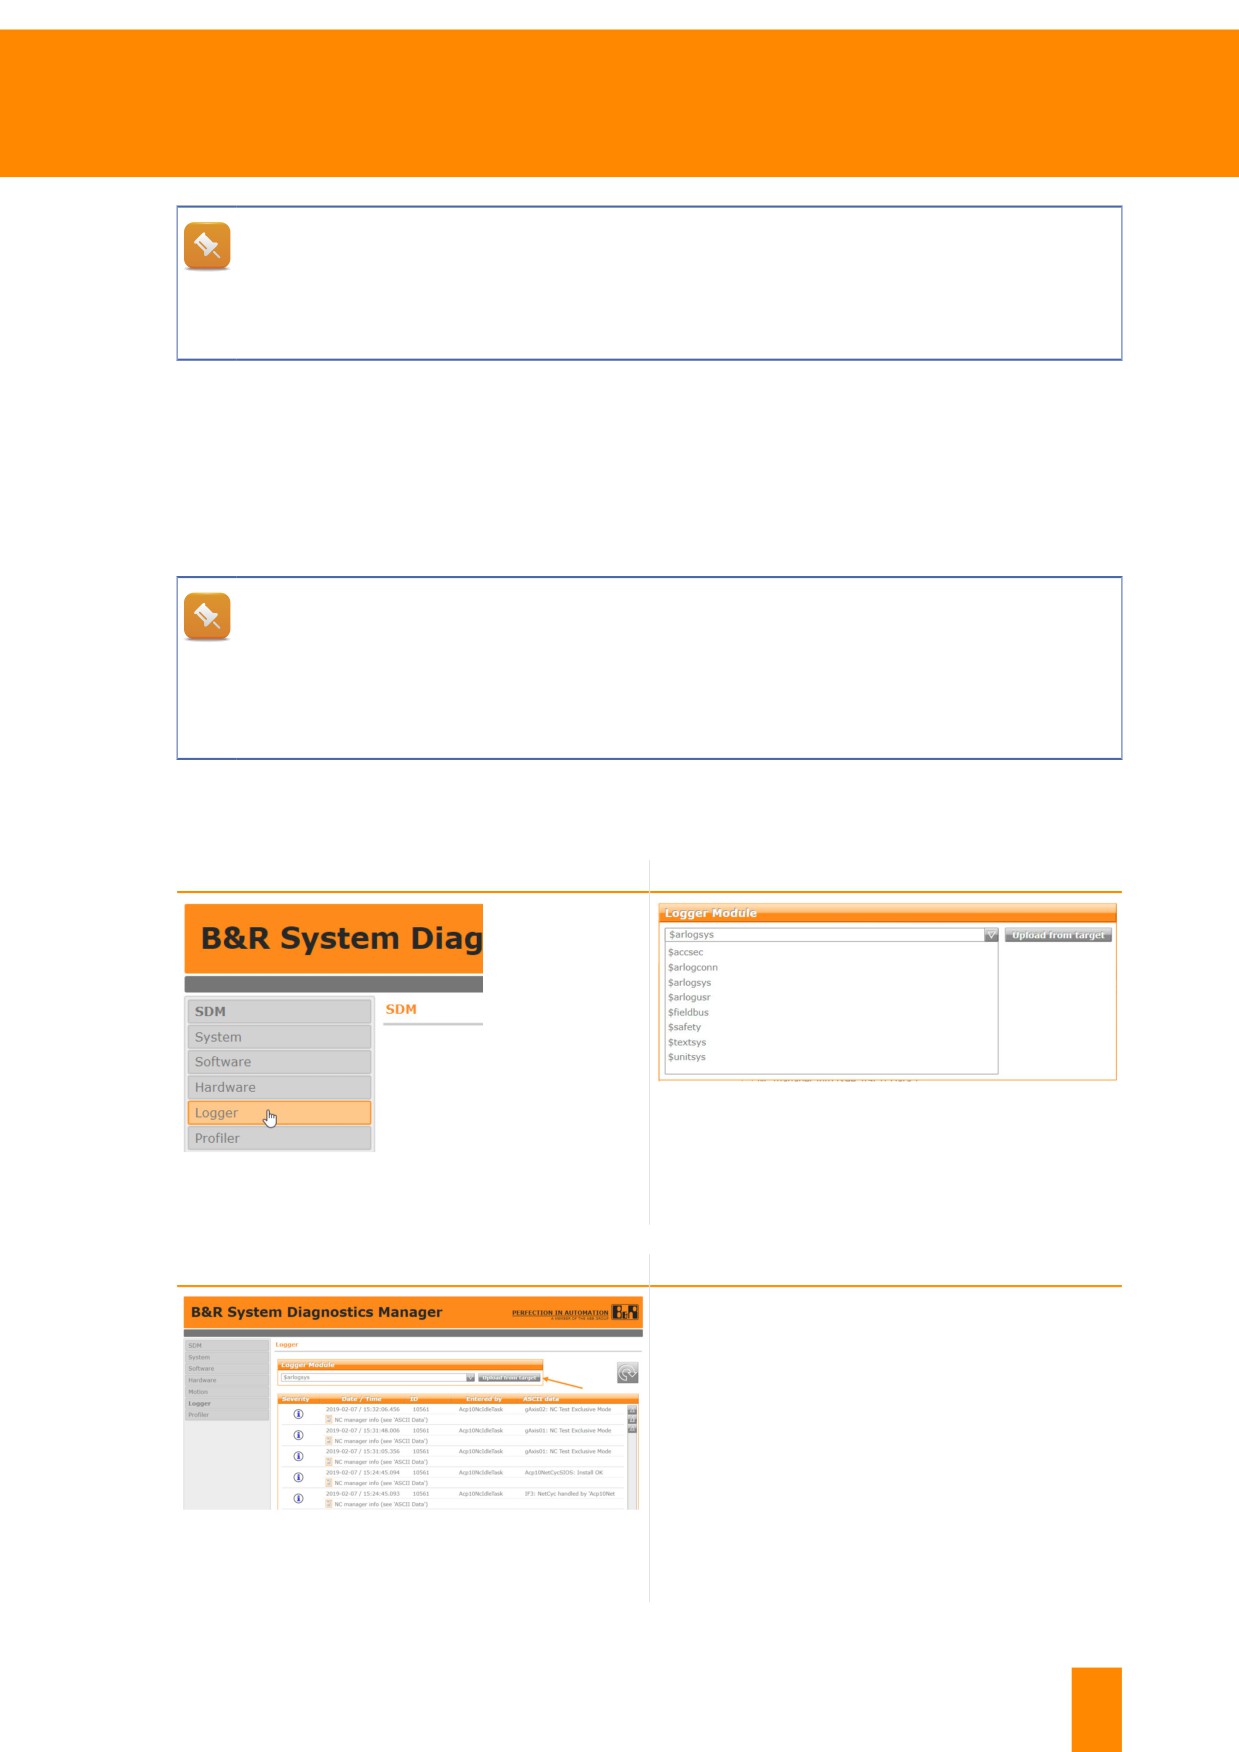
Saving Logger files
Start by establishing a connection to the SDM.
Step 1
Step 2
Figure 49: Selection of the desired Logger file
Figure 48: Select the category "Logger"
Step 3
Finished
Depending on the web browser settings, the file
will either be directly downloaded directly into the
Downloads folder or a window will appear for se-
lecting the location to save the file.
Figure 50: The Logger file is uploaded by pressing button
"Upload from target"
TM920 - Diagnostics and service
45
Diagnostics using the System Diagnostics Manager
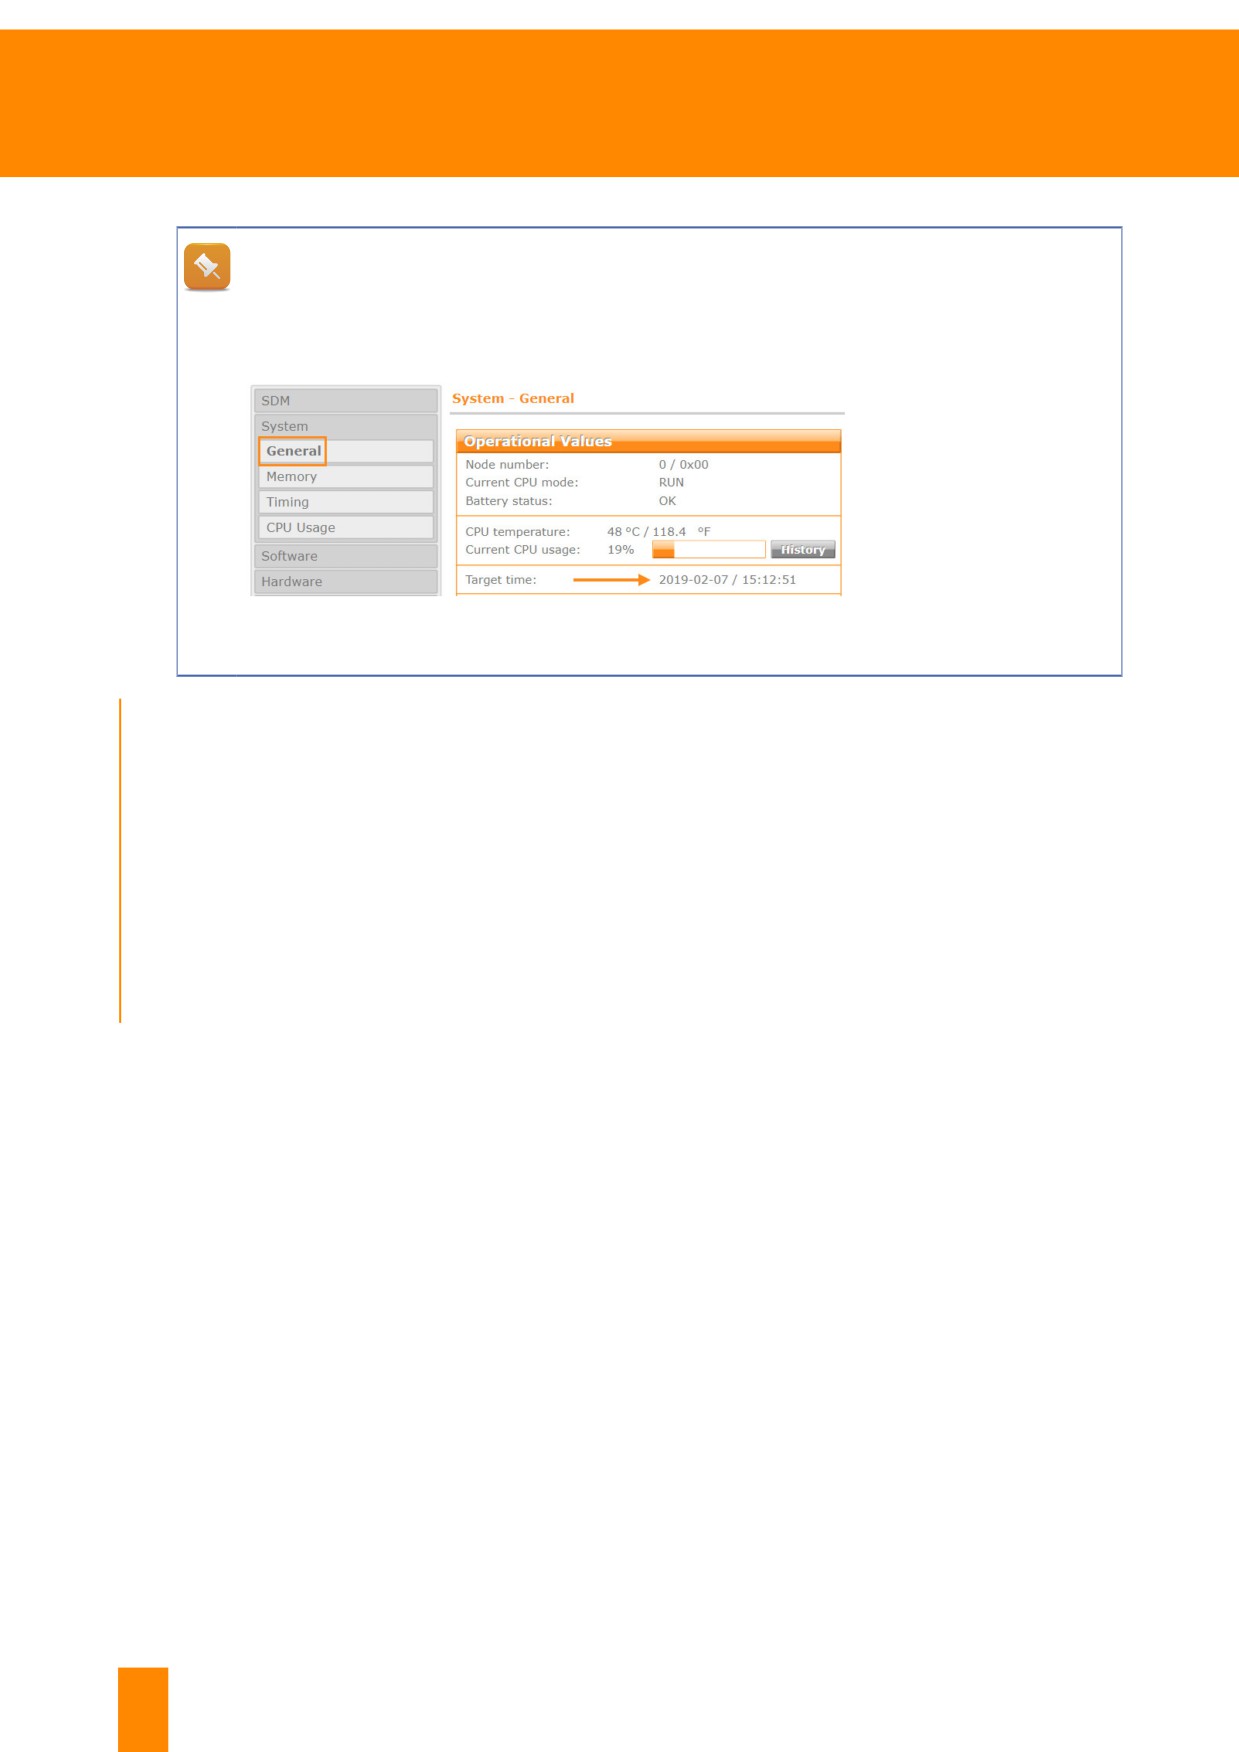
At what times were Logger entries created?
When interpreting Logger events, the current time on the control CPU is of particular impor-
tance. Before evaluating Logger entries, a potential deviation from the system time should be
considered and noted. The system time is shown in SDM under category "System".
Figure 51: The current system time is displayed in category "System / General"
Exercise: Back up Logger file
This exercise will focus on displaying and saving the system log "$arlogsys". Take a moment to interpret
the entries before saving. Also be sure to check and to make a note of the time of the controller.
1) Establish a connection to SDM
2) Open Logger
3) Take a moment to check the Logger files (time and entries) and evaluate their contents
4) Save $arlogsys
46
TM920 - Diagnostics and service
Diagnostics using the System Diagnostics Manager
6.4 Generating and saving a system dump
The system dump contains important information for hardware and software diagnostics on B&R sys-
tems. This includes Logger files, profiler files, the I/O status and hardware configuration. Start by estab-
lishing a connection to SDM.
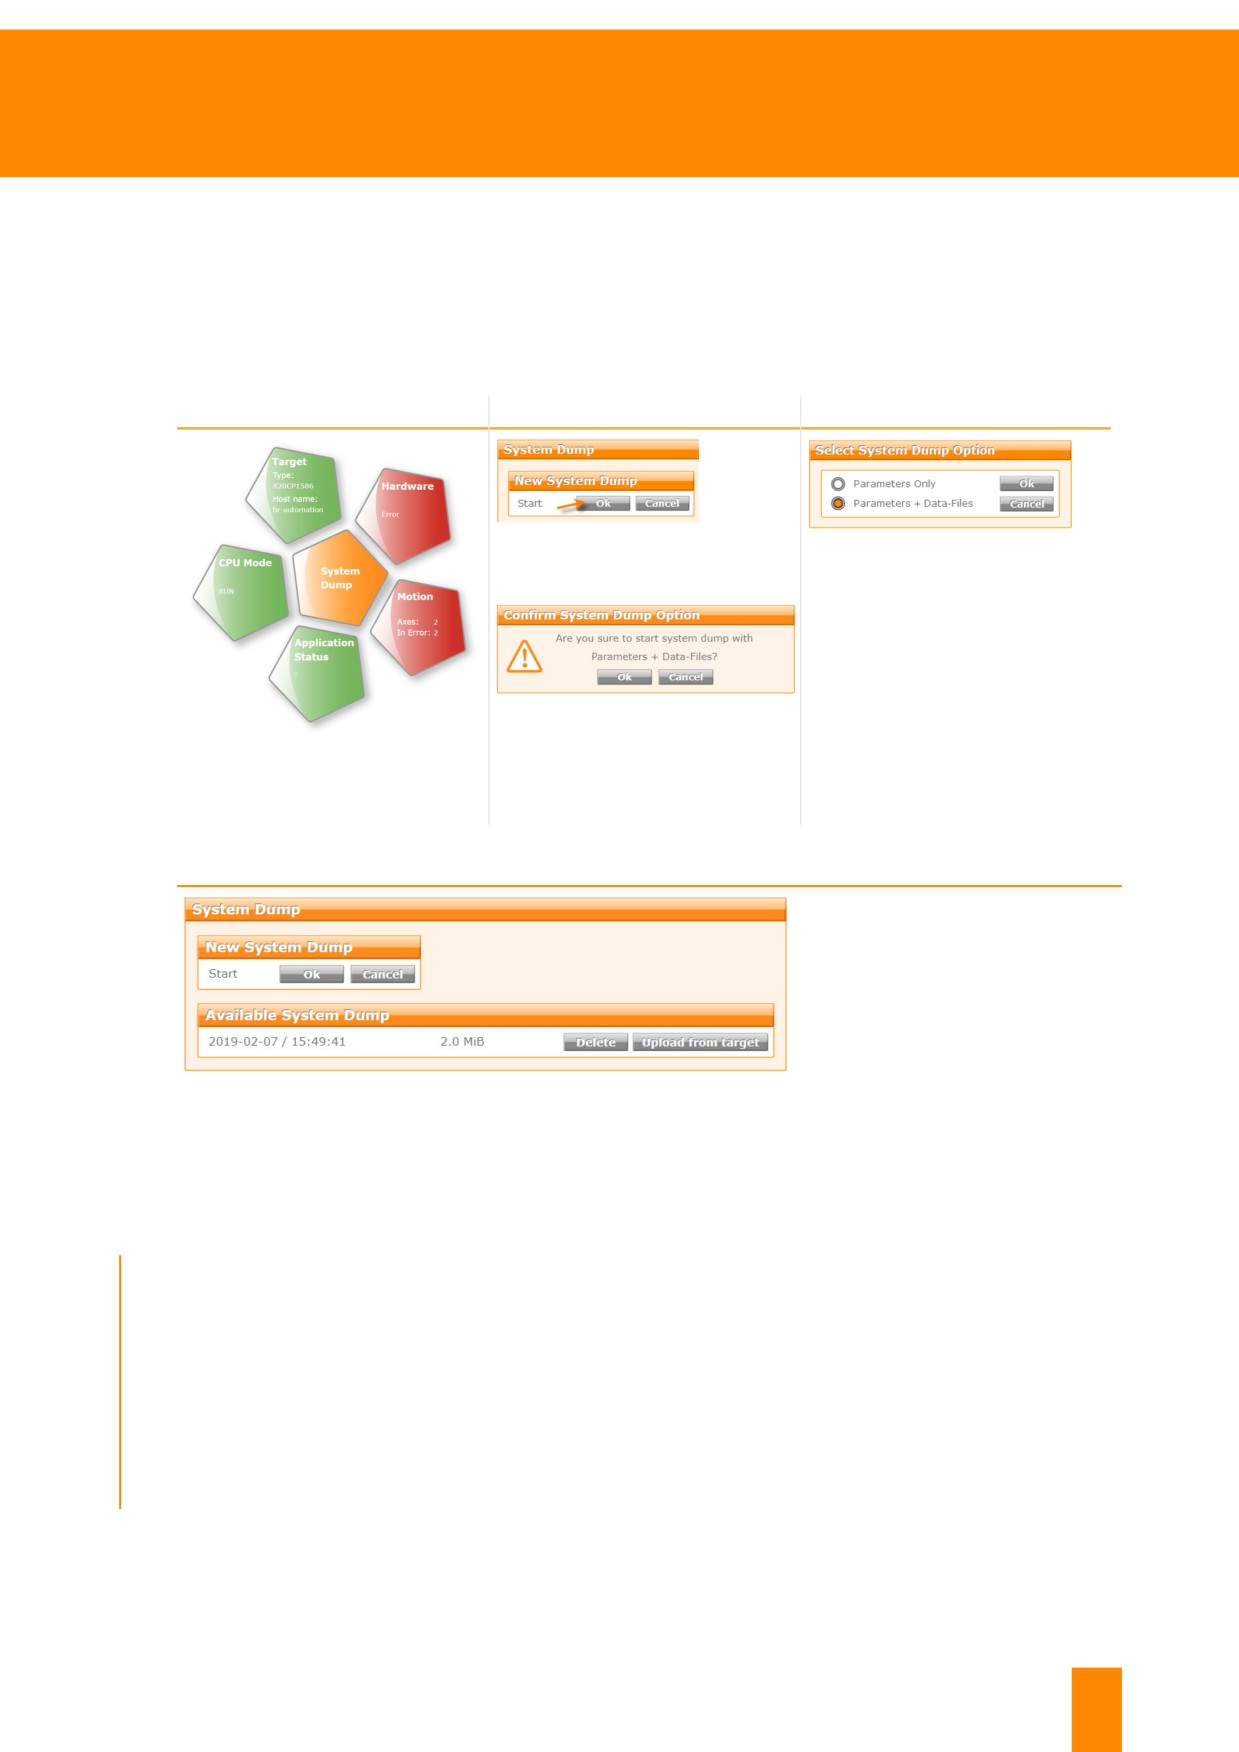
The following instructions show how to generate a system dump.
Step 1
Step 2
Step 3
Figure 53: Start a new system dump
Figure 55: Select option "Parameters
and data files"15
Figure 54: Confirm with OK
Figure 52: Press the "System Dump"
button
Step 4
Figure 56: Upload system dump
The system dump data contains important information about the machine controller. The machine man-
ufacturer or B&R can use this data for further analysis.
Exercise: Triggering and saving a system dump
A full system dump including all Logger files and parameter files must be generated and saved.
1) Establish a connection to SDM
2) Start a new system dump
3) Save system dump
15 This option saves all of the control system Logger files in ZIP format and adds them to the system dump.
TM920 - Diagnostics and service
47
Diagnostics using the System Diagnostics Manager
6.5 Information in the hardware tree
System Diagnostics Manager displays and saves Logger files. In order to further evaluate the Logger
data, some system knowledge and additional information delivered by SDM are required. The information
is shown in SDM as a hardware tree.
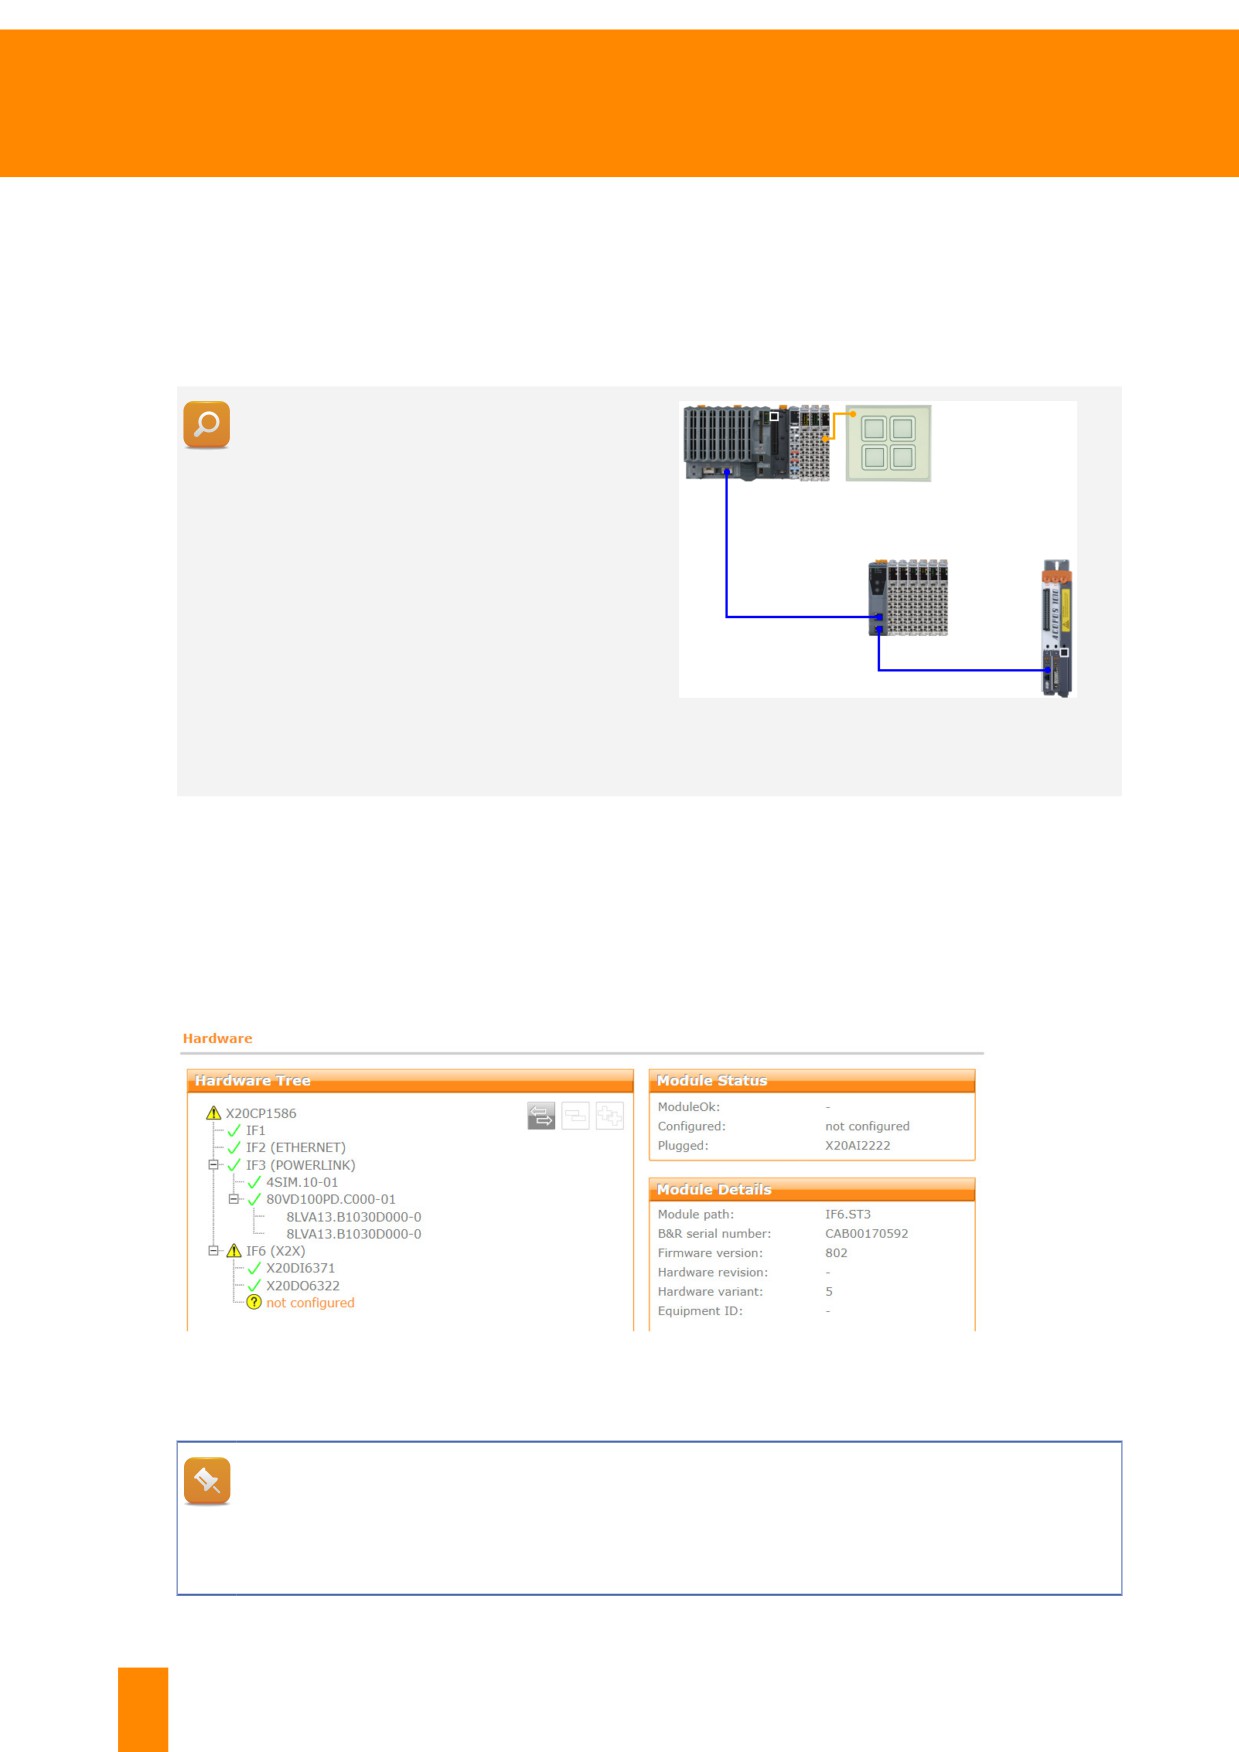
An X20 controller controls a machine. Some
X20 I/O modules are directly connected to the
X2X interface of the CPU. The last module on
the X2X Link network is an illuminated ring
key field.
An X20 bus controller is connected via the
POWERLINK connection in blue. This has
node number 1. Some X20 I/O modules are
connected to the integrated X2X interface of
the X20 bus controller.
The POWERLINK connection continues from
an X20 bus controller to an ACOPOS servo
drive. This has node number 2.
Figure 57: Sample configuration with an X2X and
POWERLINK connection
Hardware tree in the SDM
The enabled and configured hardware modules are shown in SDM "Hardware" category. They are dis-
played in a tree structure, so it is possible, starting from the controller CPU, to navigate to the I/O module
or drive via the individual fieldbuses.
The image shows that another X20 module was detected on the X2X interface, which is not part of the
hardware configuration.
Figure 58: Depiction of the current hardware configuration in the SDM
What do the yellow "!" and the red "X" mean?
In the event of a faulty configuration or missing hardware, the interface where a problem is
occurring will be highlighted by an exclamation point with a yellow background. The entry that
caused the problem is marked with an "X" shaded in red.
48
TM920 - Diagnostics and service
Diagnostics using the System Diagnostics Manager
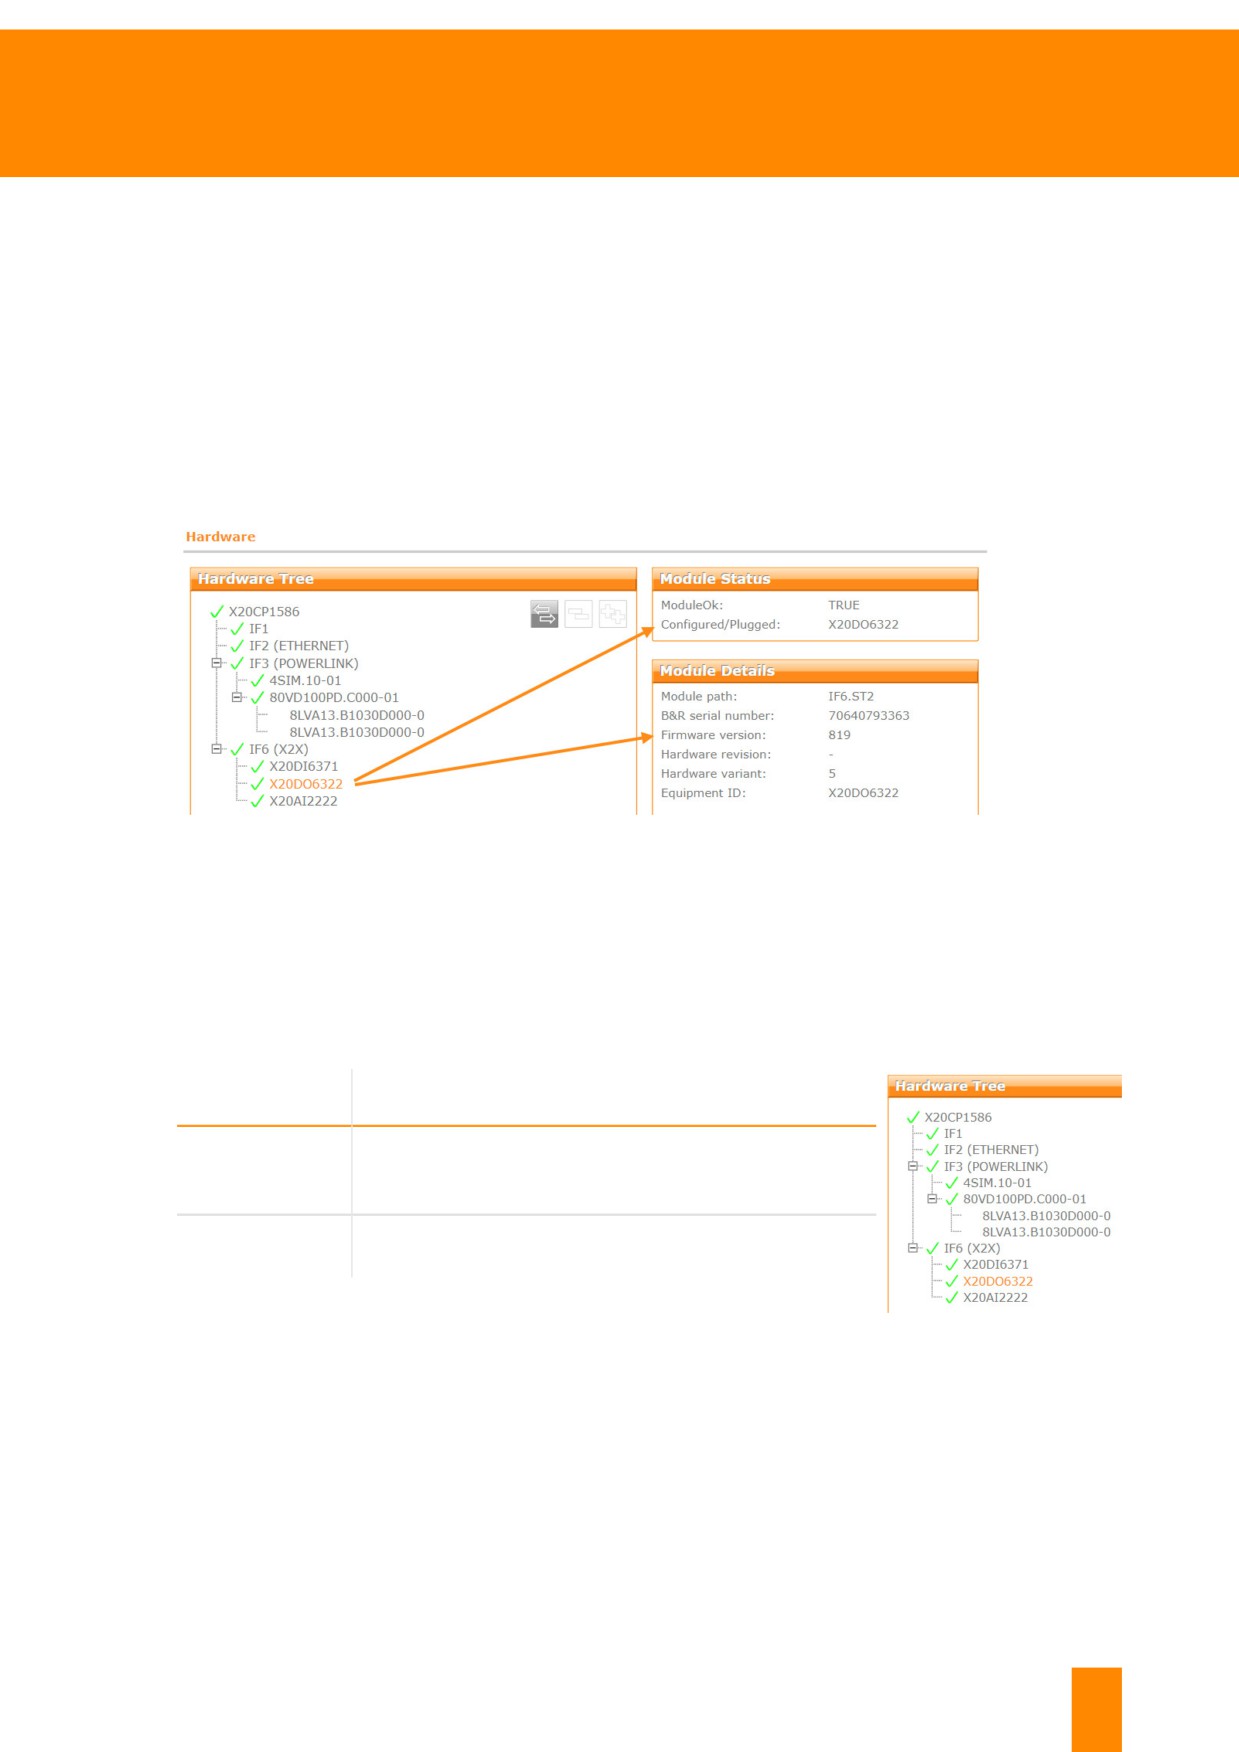
Module status and module details in the SDM
When a module is selected in the hardware tree, the module status and details about the module are
shown on the right half of the screen. The X20DO6322 module is marked in the image. The module status
shows "ModulOk" = TRUE. This means that the hardware module has been recognized and configured
correctly. This module works correctly and delivers valid input data.
The module path and the B&R serial number are shown in the module details. If the serial number is
known, the corresponding user's manual can easily be downloaded from the B&R website.
Further information:
•
4 "Obtaining information about the B&R system" on page 20
Figure 59: The module status and module details of the X20DO6322 module are shown
Module path
The module path in the module details clearly describes the place where a module is located. This
provides information about the used fieldbus, the node number, the used interface and the slot of the
individual module. The module path describes the position of the module in the hierarchy of the control
system. If module path "IF6.ST2" is shown, for example, it must be read as follows:
Element of the
Description of the element
module path
IF6
X2X interface of the X20CP1586 X20 controller. The
interface name is documented in the data sheet of the
X20 controller.
ST216
The X20DO6322 module is inserted in slot 2 on the
X2X interface of the X20 bus controller.
Table 5: Module path decoding
Figure 60: X20AT4222 in the
SDM hardware tree
16 The abbreviation "ST" stands for slot and describes the position of a module slot in the respective hierar-
chy.
TM920 - Diagnostics and service
49
Diagnostics using the System Diagnostics Manager
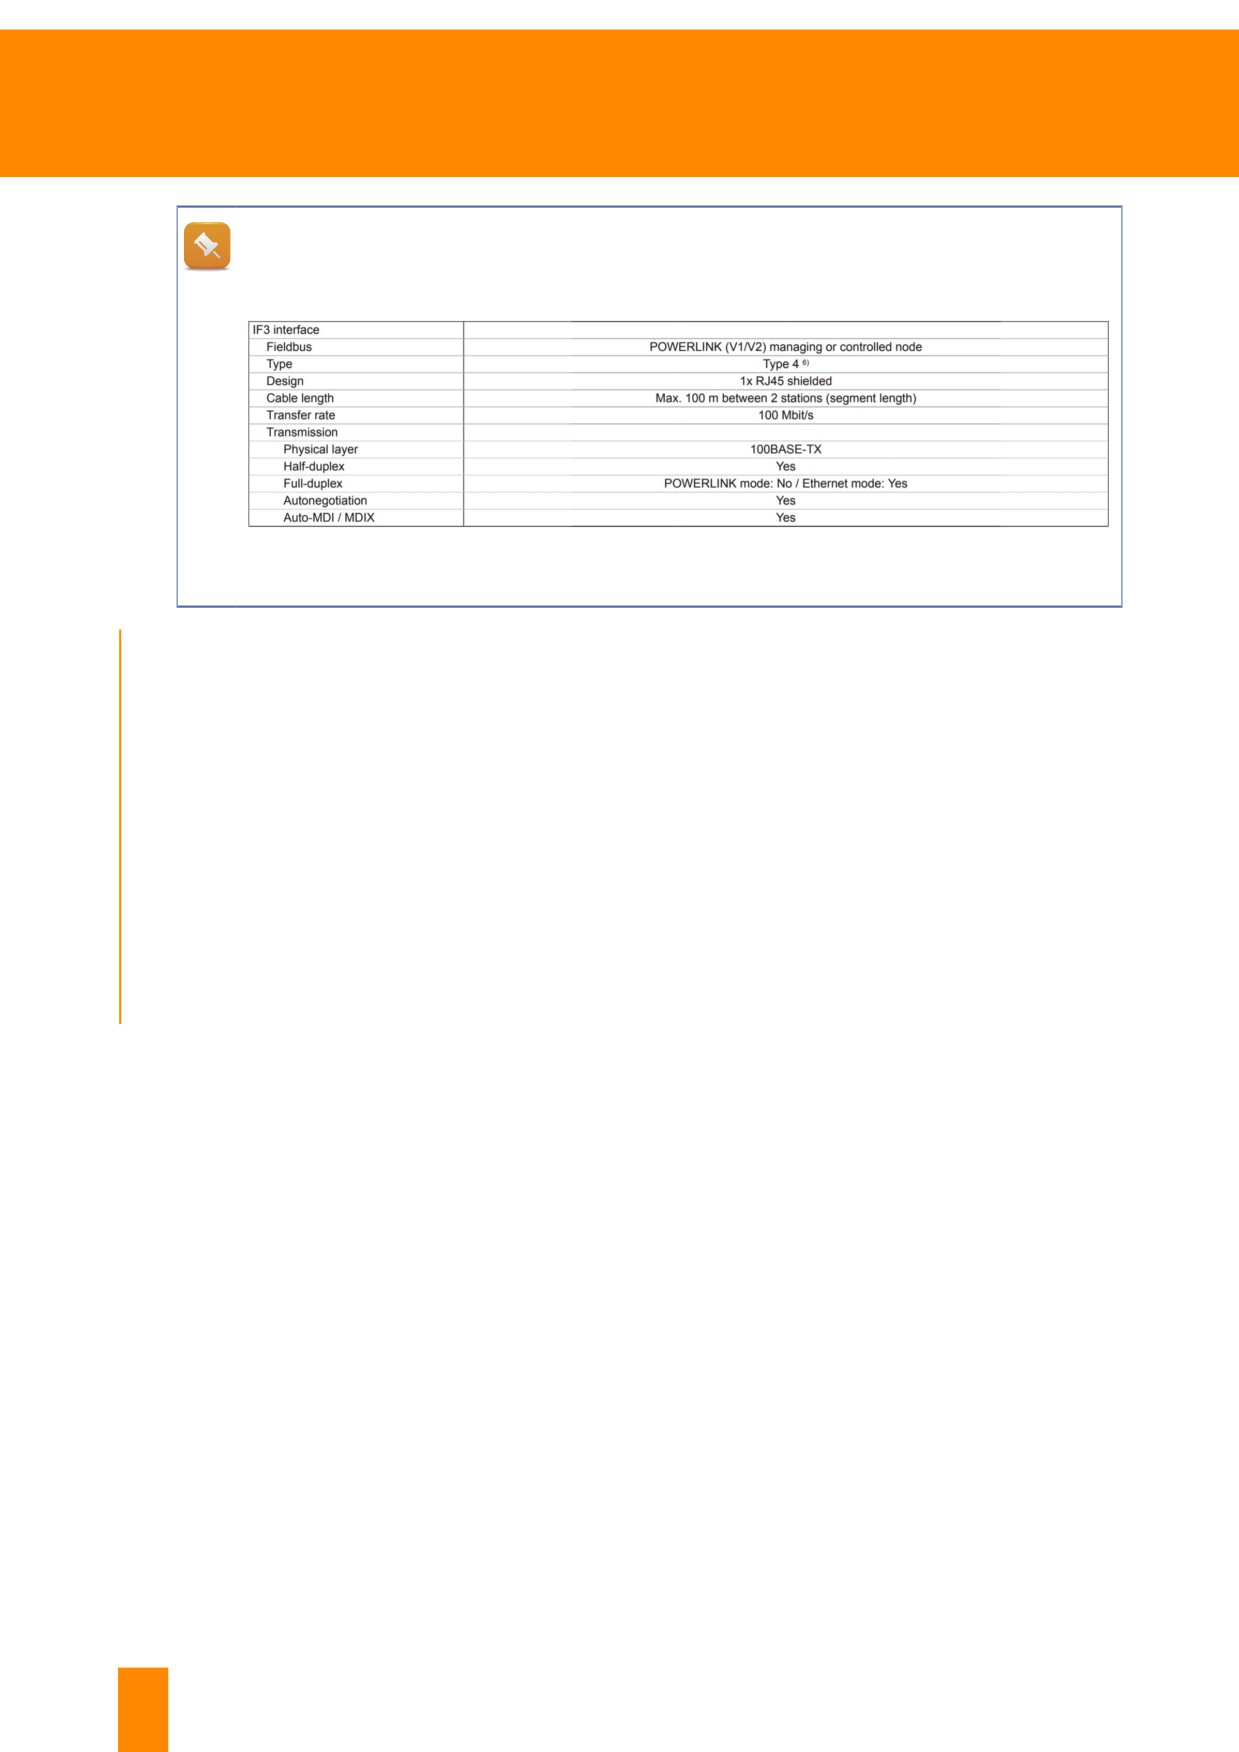
The descriptions of the interfaces (IF1, IF2, IF3, IF6, etc.) can be found in the data sheet of
the respective device. Here, there is also information about the transfer rate, cable length and
data transfer of the interface.
Figure 61: Excerpt of description "IF3" POWERLINK interface from "Data sheet X20(c)CPx58x"
Exercise: Remove bus connection or I/O module and analyze Logger entry
Cancel the connection to the X20 bus controller during operation or remove an I/O during runtime. The
controller is restarted in service mode and the execution of the controller application is canceled. Read
the Logger file and analyze the entries.
1) Disconnect the connection to the bus station
2) Wait for boot up in service mode
3) Establish a connection to SDM
4) Open the logger file
5) Interpreting the Logger file using the hardware tree in SDM
50
TM920 - Diagnostics and service
Diagnostics using the System Diagnostics Manager
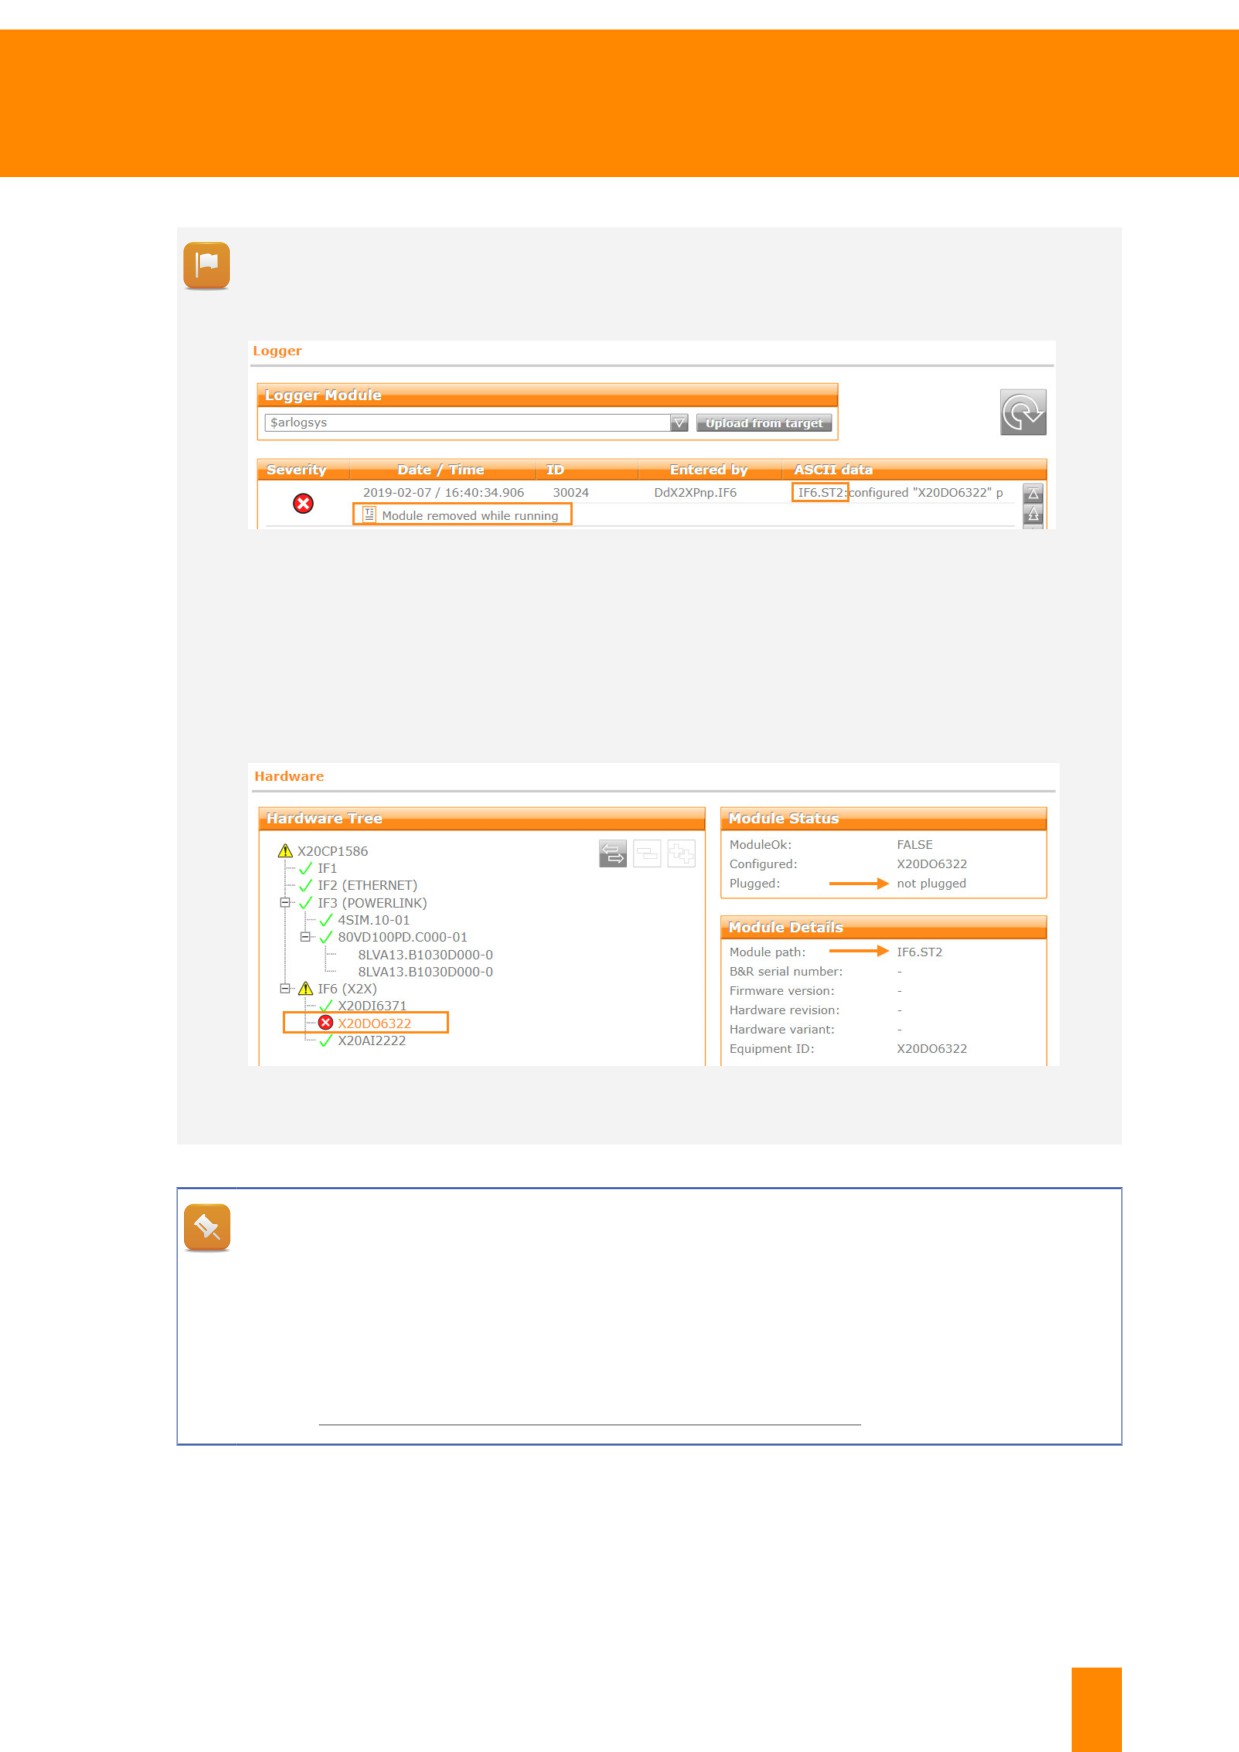
The controller was automatically started in service mode by disconnecting from a bus station.
Text "Module removed while running" additional information "IF3.ST1" are shown in the Logger
entry.
Figure 62: Logger entry in SDM - "Module removed while running"
A change can also be recognized in the hardware tree. The remote X20 module is marked
red. The information "Not plugged" is listed in the module status and in the details for the cor-
responding position in hardware tree "IF6.ST2".
If, for example, an entire X20 bus controller was removed, all I/O modules in the background
would also be marked red.
Figure 63: Hardware tree in the SDM - IF3.ST1 is not inserted
How do I recognize a POWERLINK problem in SDM?
A problem can be identified on the POWERLINK fieldbus by displaying the Logger and the
hardware tree in combination. However, it cannot yet be identified if the failure of the network
participant was caused by EMC problems, a contact problem or a hardware problem. In this
case, the status points of the fieldbus interfaces and bus controllers give additional information.
Further information:
•
6.6 "Diagnostics via I/O and status data points" on page 52
TM920 - Diagnostics and service
51
Diagnostics using the System Diagnostics Manager
6.6 Diagnostics via I/O and status data points
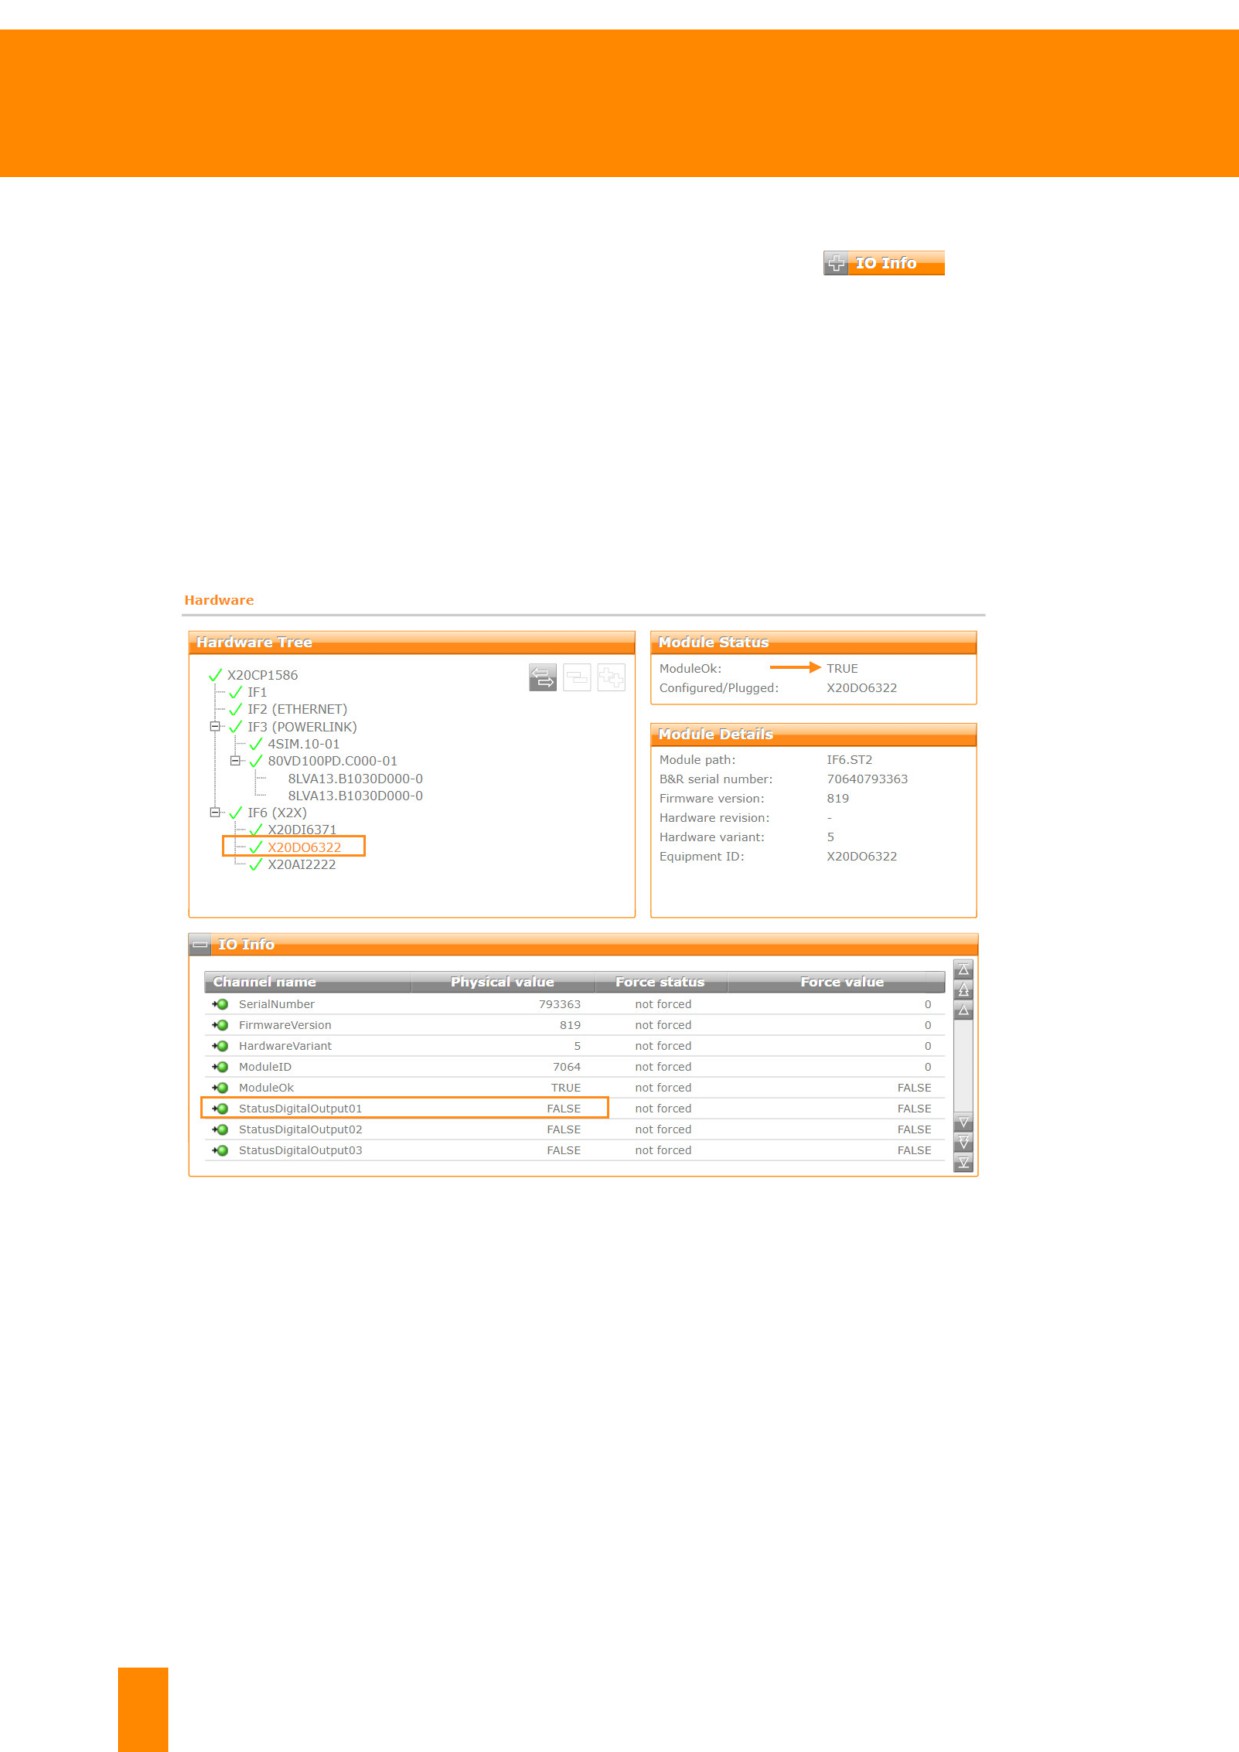
Via button "IO Info", which is located below the hardware tree in
SDM, the data of the I/O modules are displayed. B&R modules have
status data points that provide information about the module status
Figure 64: Enable to the I/O information
or fieldbus communication. By clicking on the button, all information
is displayed.
Status inputs of I/O modules
Besides input values of the I/O channels, further information about the validity of the measured values,
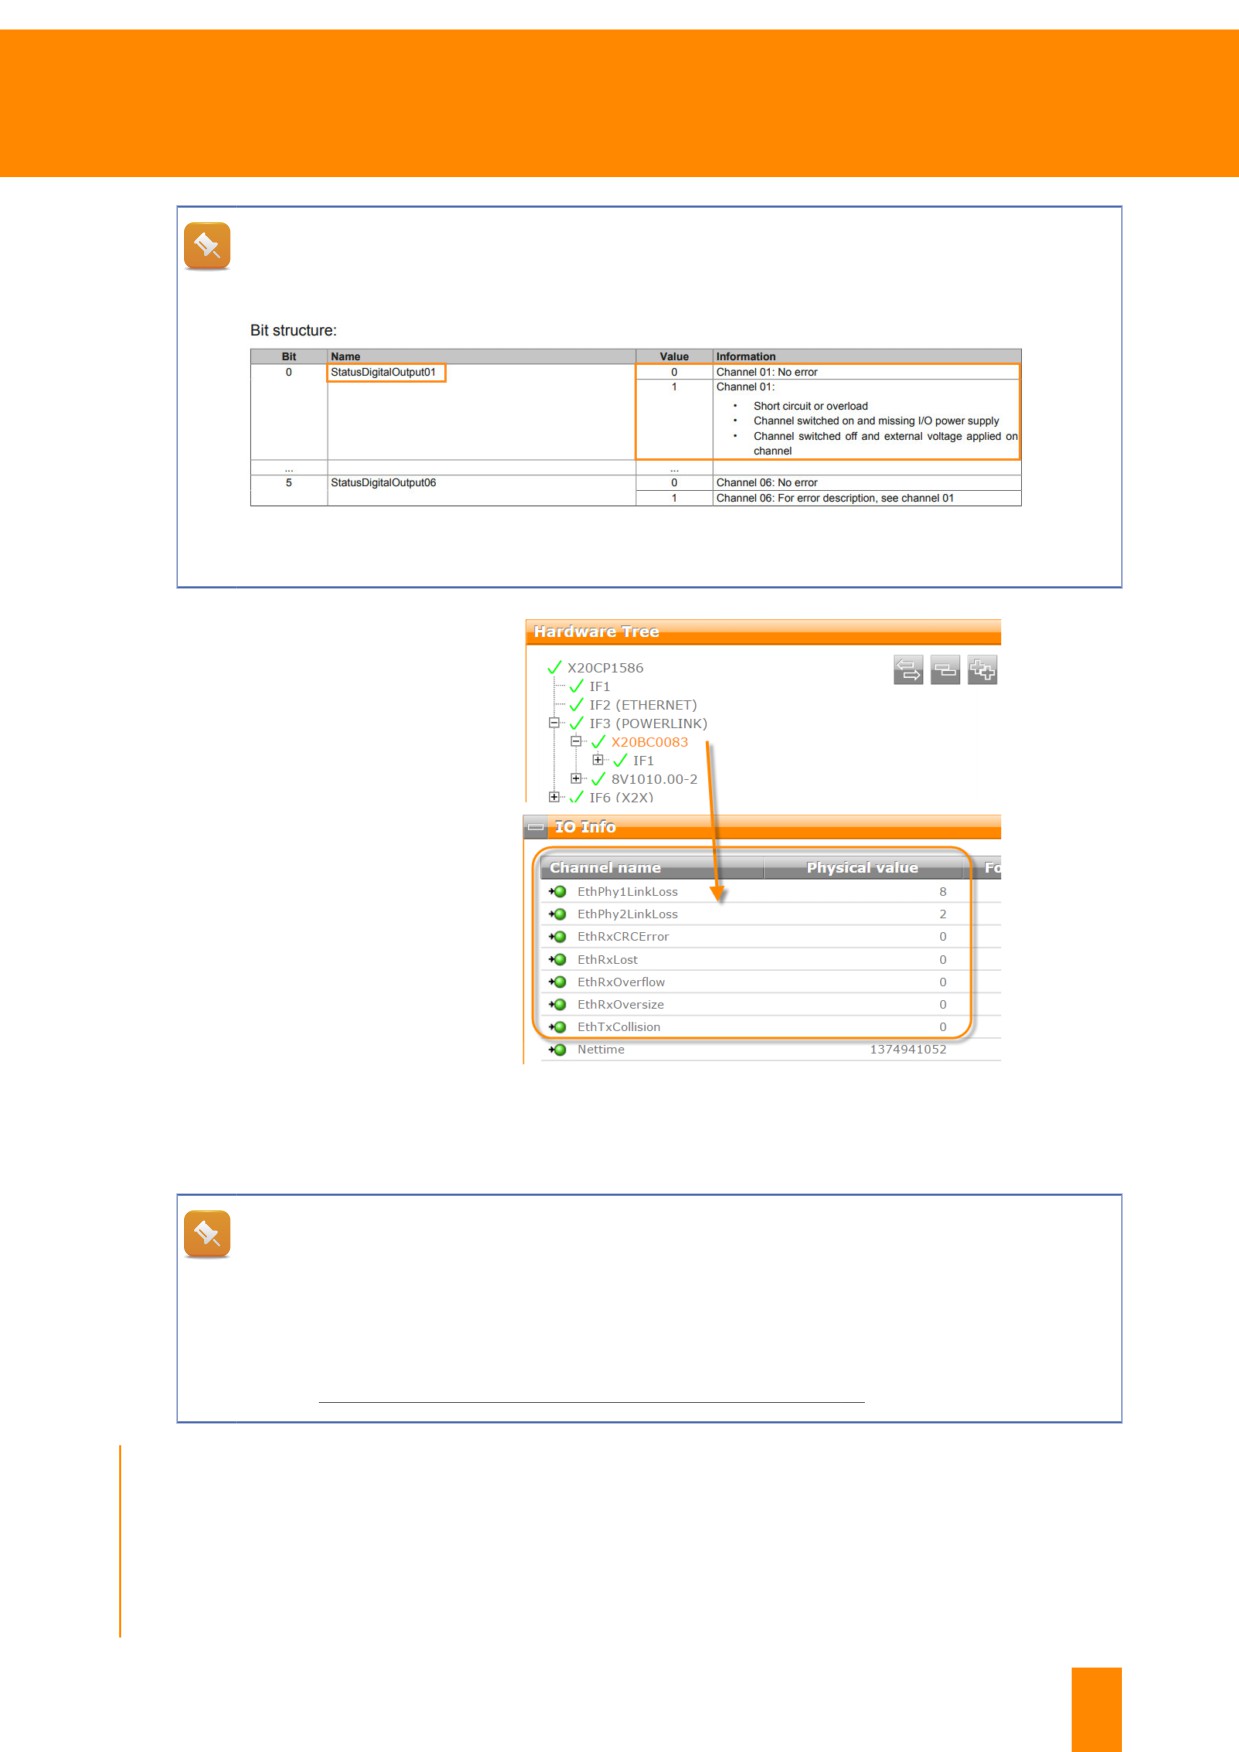
wire breaks, short circuits or overcurrent is added to the I/O information. This is shown for each module
marked in the hardware tree. This image shows an X20DO6322 digital output module. Input "StatusDig-
italOutput01" shows value FALSE.
Figure 65: I/O information and status data of an X20DO6322 output module
52
TM920 - Diagnostics and service
Diagnostics using the System Diagnostics Manager
All data channels are completely described in "Data sheet X20(c)DO6322" in chapter "Status
of the digital outputs". Input "StatusInput01" is described in this image. There is a meaningful
channel status for each I/O channel.
Figure 66: Description of "StatusDitigalOutput01" in "Data sheet X20(c)DO6322"
Status inputs of fieldbus de-
vices and interfaces
Each interface and each fieldbus
station has its own diagnostic da-
ta points. Using this data, it is
possible to record the quality of
the communication and communi-
cation disturbances when the ma-
chine is still running.
The image shows the diagnos-
tic data points of the X20BC0083
POWERLINK bus controller. The
X2X interface and the POWER-
LINK interface of the controller it-
self also offer such diagnostic data
points.
Figure 67: Diagnostic data points of X20BC0083 e.g. EthPhys1LinkLoss shows
the amount of connection disruptions to the 1st Ethernet port of the bus controller.
During operation, these diagnostic data points may only increase every two hours maximum;
otherwise, the network cabling should be checked.
When the system is booted, it's possible that some of these error counters are incremented
until startup is complete.
Further information:
•
10.4 "Notes regarding grounding and shielding" on page 87
Exercise: Diagnosis of the fieldbus connection using diagnostic data points
The X20BC0083 POWERLINK bus controller as well as all other fieldbus interfaces and devices have
diagnostic data points. The goal is to become familiar with the reaction of the complete system in the event
of connection interruption in the POWERLINK network and to read the diagnostic information related to
this.
TM920 - Diagnostics and service
53
Diagnostics using the System Diagnostics Manager
1) Disconnect the connection between the X20 controller and Powerlink bus controller X20BC0083.
2) Wait for the system to restart
3) Open the System Diagnostics Manager.
4) Read Logger entry
5) Open hardware tree in the SDM and enable I/O status
6) Read the error counter for the POWERLINK interfaces of X20BC0083.
7) Establish POWERLINK connection
8) Wait for reaction in SDM and at the I/O modules.
Connecting and disconnecting the POWERLINK cable over and over causes the error counters
to increment. The system restart that was triggered by the interruption of the connection can be
diagnosed using the Logger. Any potential disturbances in communication or wiring problems
can be determined on the running machine via the statuts data points.
6.7 Information about the application status in WebXs
If mapp Technology components and the WebX library were used while creating the application, these
components can be displayed via the mapp diagnostic page "WebXs". The components deliver compre-
hensive status information that is helpful when communicating directly with the machine manufacturer.
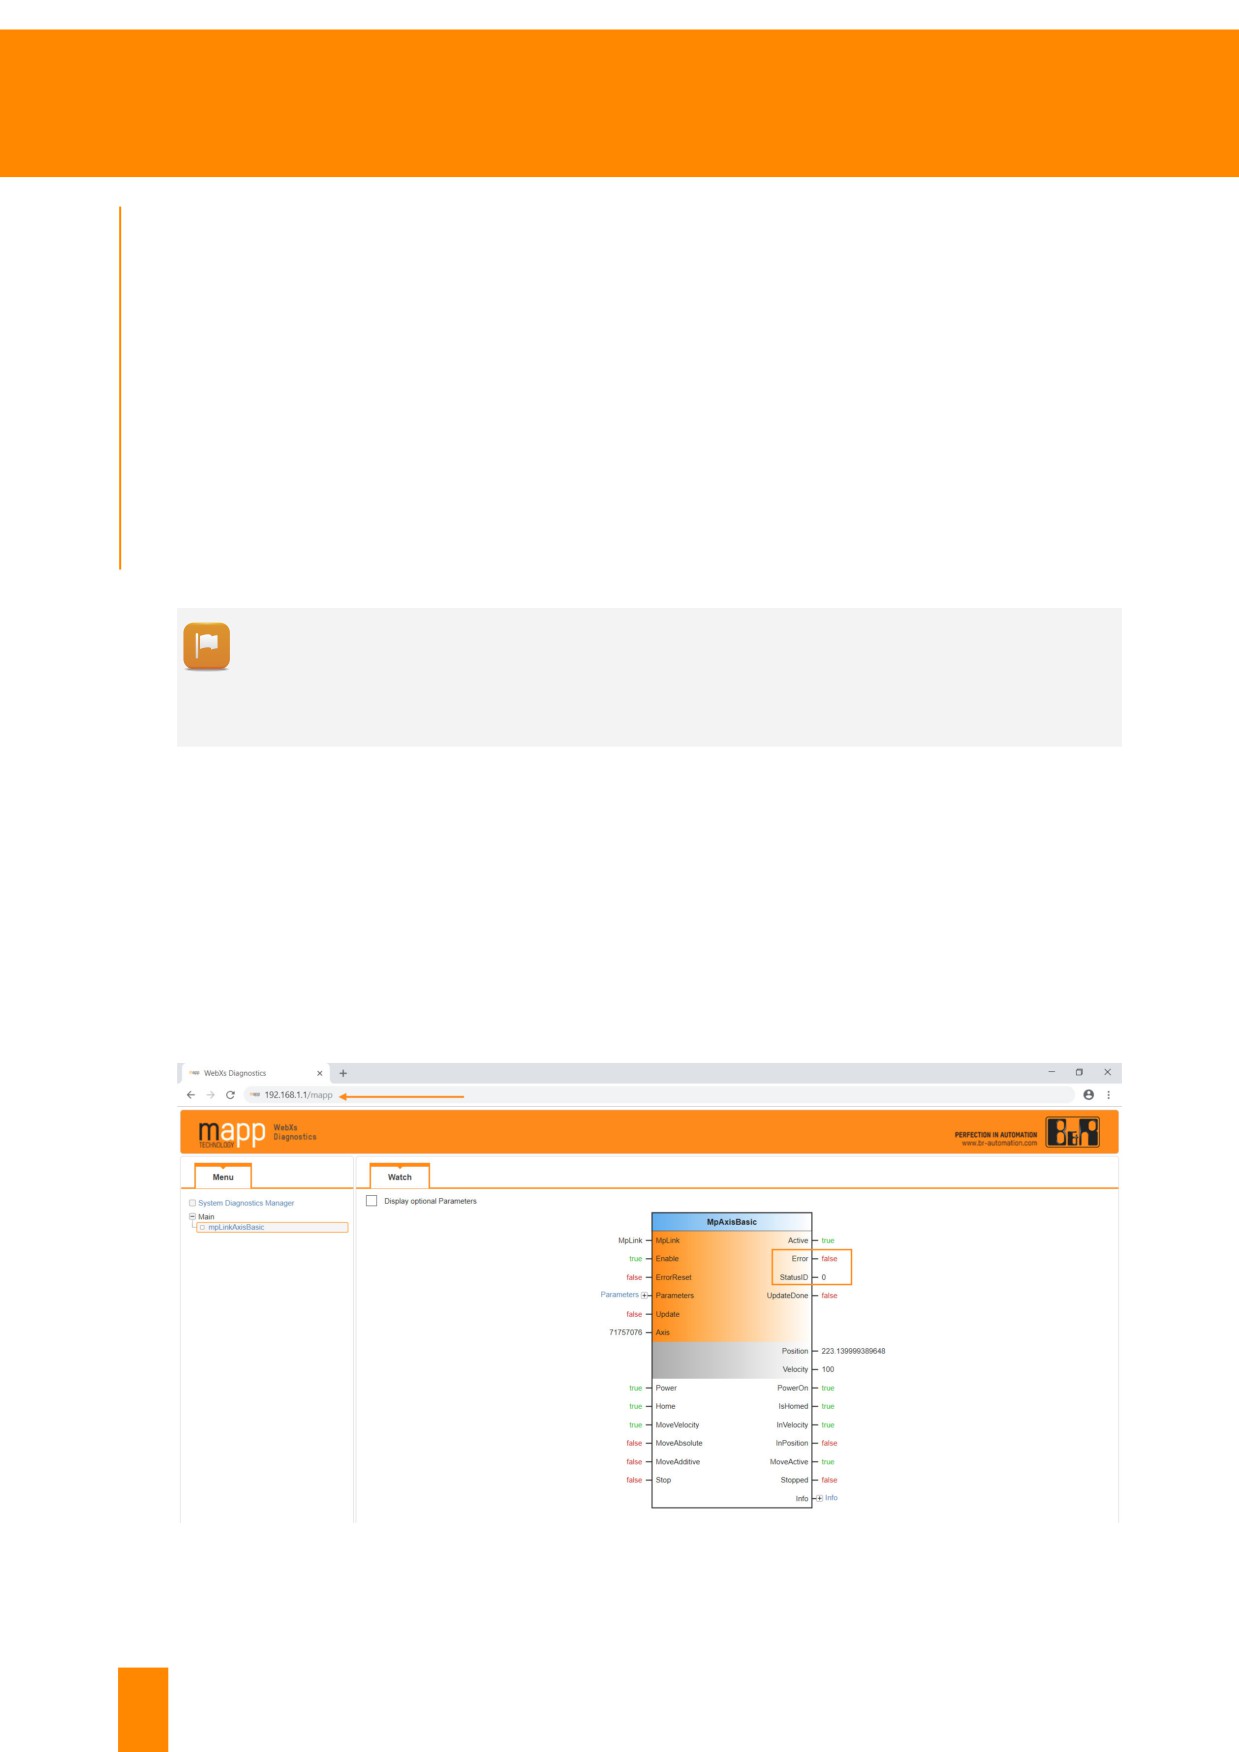
The connection to WebXs is established by entering"IP address/mapp" in the address bar of the brows-
er17 On the left of the image, a mapp component is being selected. The input parameters and status
information of the selected mapp component are shown in the center of the image. The example below
shows component MpAxisBasic that is used to control a drive axis.
Figure 68: mapp Technology WebXs: Input parameters and status information of MpAxisBasic
17 B&R recommends to use Google Chrome as browser.
54
TM920 - Diagnostics and service
Diagnostics using the System Diagnostics Manager
What happens if function block output "Error" has value TRUE?
If output "Error" has value TRUE and if the statusID is not equal to 0, then an entry is generated
in Logger file "$mapp". The Logger file can be shown and saved using System Diagnostics
Manager.
TM920 - Diagnostics and service
55
Troubleshooting
7 Troubleshooting
Once the problem has been identified and all the necessary infor-
mation has been obtained, the problem can be solved.
If the problem can be solved by replacing a module, it is important to
deal with backing up the process data and parameter data of the ma-
chine control. The network topology must be examined beforehand.
If the problem was caused by material wear, the affected mainte-
nance part can be easily replaced.
Is there anything to consider before replacing or servicing the product?
It is recommended to download the component data sheet and user's manual from the B&R
website. These documents contain important information on handling. If the documentation is
not followed, irreparable damage may occur.
Further information:
•
4 "Obtaining information about the B&R system" on page 20
7.1 Service parts
The B&R system contains only a small amount of service parts. All service parts are externally accessible
and easy to replace. These parts must be replaced from time to time in order to ensure long-lasting
operation.
All required accessories and maintenance parts are linked to the serial number. All maintenance parts
and their maintenance intervals are listed in the user's manual . The regional regulations regarding the
replacement of service parts during operation of the machine must be observed.
Service parts include:
• Fans for PCs, drives and CPUs
• Filter pads for fan kits
• Backup batteries for all CPUs
• Backup batteries for Power Panels
• Backup batteries for PC BIOS
• Backup batteries for EnDat 2.2 encoder interfaces
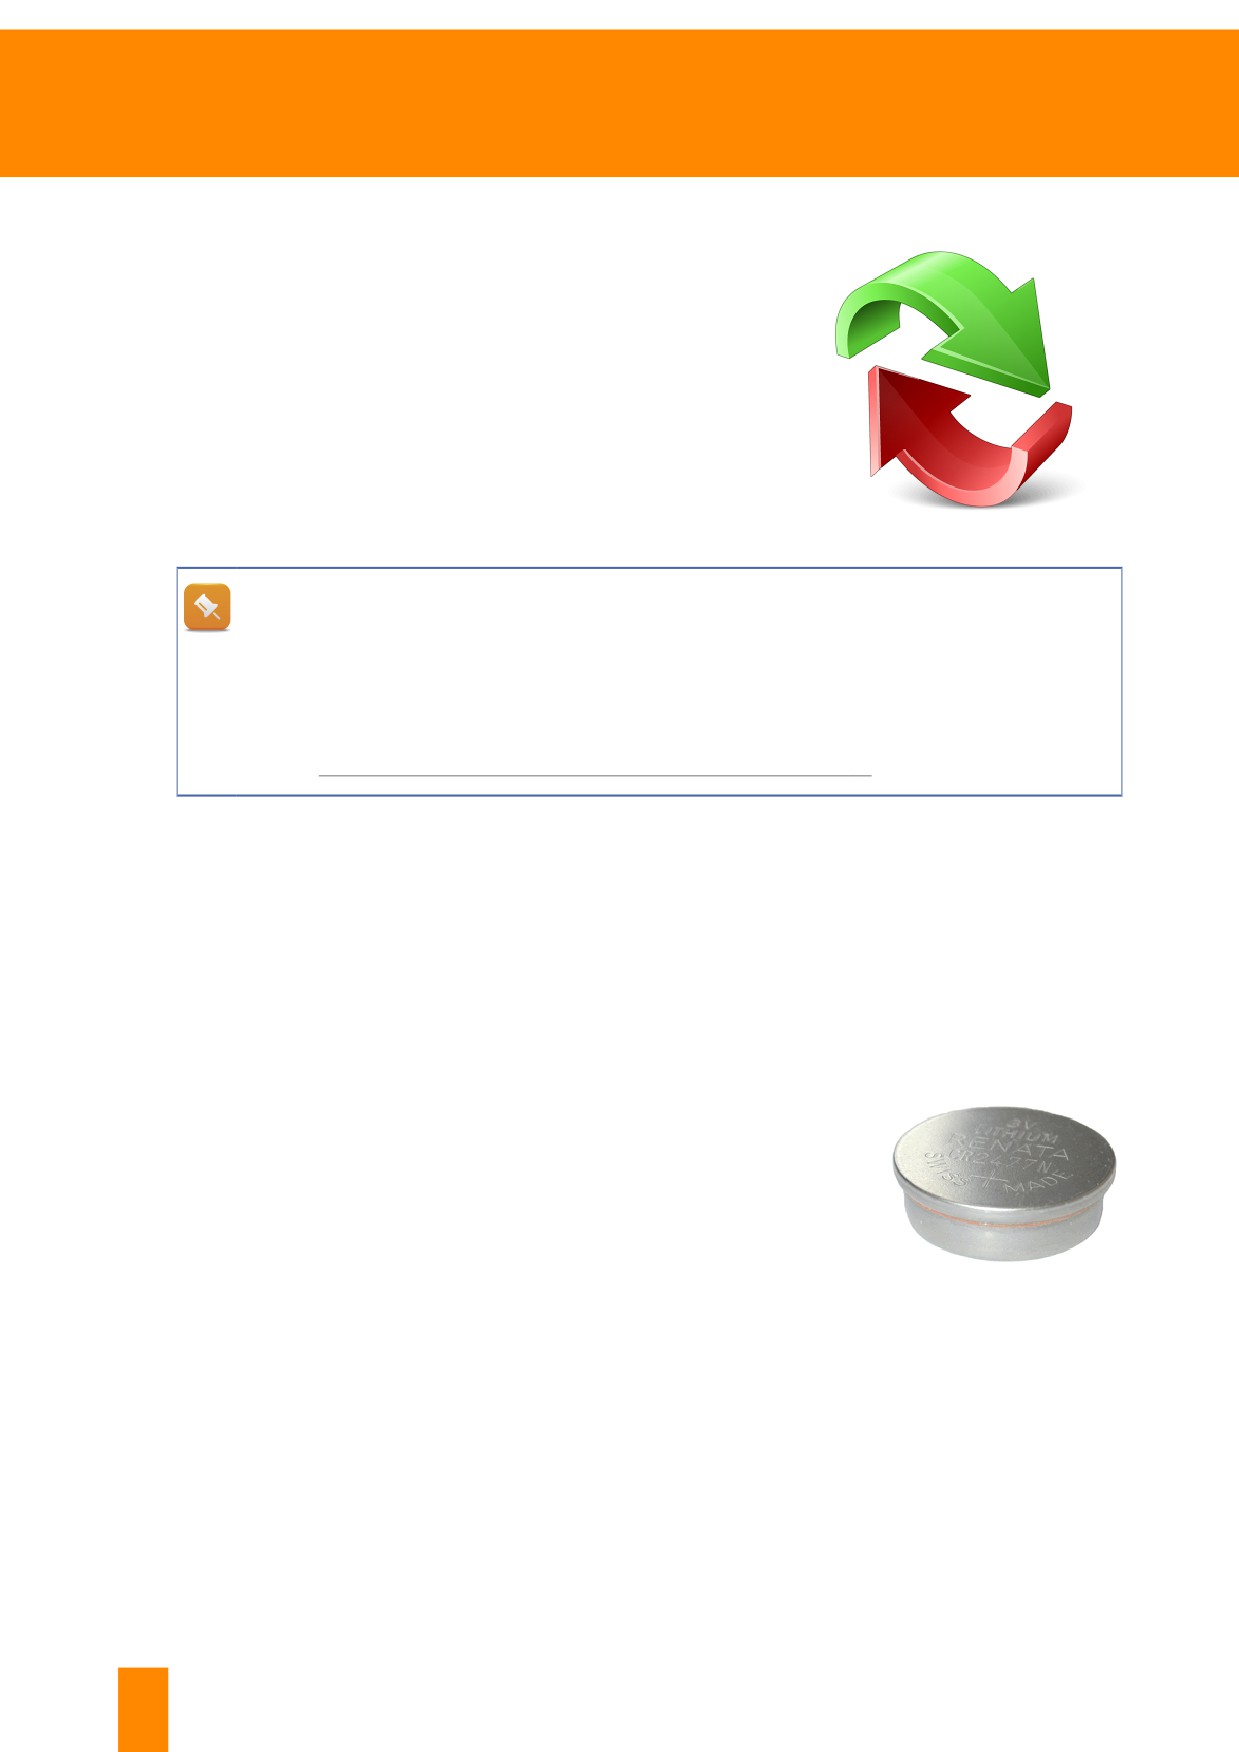
Figure 69: Lithium battery,
suitable for most B&R
components18
18 1 piece 4A0006.00-000 or 4 pieces 0AC201.91
56
TM920 - Diagnostics and service

Troubleshooting
When replacing batteries, be sure to follow the procedure specified in the user's manual and
the recommended service intervals. Failure to do so can result in a loss of data. According
to the user's manual, the controller bridges data buffering for a certain time so that the battery
can be changed.
The process variables can be listed and then saved in the Runtime Utility Center using com-
mand "Variable List". Step-by-step instructions, see 8.1.5 "Outputting data via online connec-
tion" on page 78. Find out from the machine manufacturer which data is stored in the bat-
tery-backed memory area.
The battery status can be read via LED status indicators, System Diagnostics Manager as well
as the Runtime Utility Center. Usually the battery status is shown in the alarm system of the
HMI application.
Further information
•
5.1.3 "LED status indicators on the control system" on page 34
•
6 "Diagnostics using the System Diagnostics Manager" on page 39
Exercise: Replacing the battery
Replace the backup battery in the control CPU.
Follow the instructions in the user's manual.
1) Check the battery status (SDM, LED status indicators)
2) Visit the B&R website, www.br-automation.com
3) Search for the X20 system user's manual. For help, see 4.4
"B&R website functions" on page 24
4) Download user's manual
5) Back up all process variables, see 8.1.5 "Outputting data via
online connection" on page 78
6) Read chapter "Changing the Lithium Battery"
7) Change the battery as described in the user's manual.
7.2 Replacing a module
The following section lists the most important information about module switching. Before replacing the
module, make sure that all relevant measures have been taken. Detailed instructions as well as danger
notifications and warnings are documented in the user's manual of the respective system.
Node numbers
The topology and functioning of the B&R system was designed so that all programs and configuration
data is saved on the CompactFlash or on the internal Flash memory of the machine controller.
This means that all of the necessary settings and parameters are loaded to the devices connected to
the machine when it is started. Each unique node number is used to identify the devices on the fieldbus.
TM920 - Diagnostics and service
57
Troubleshooting
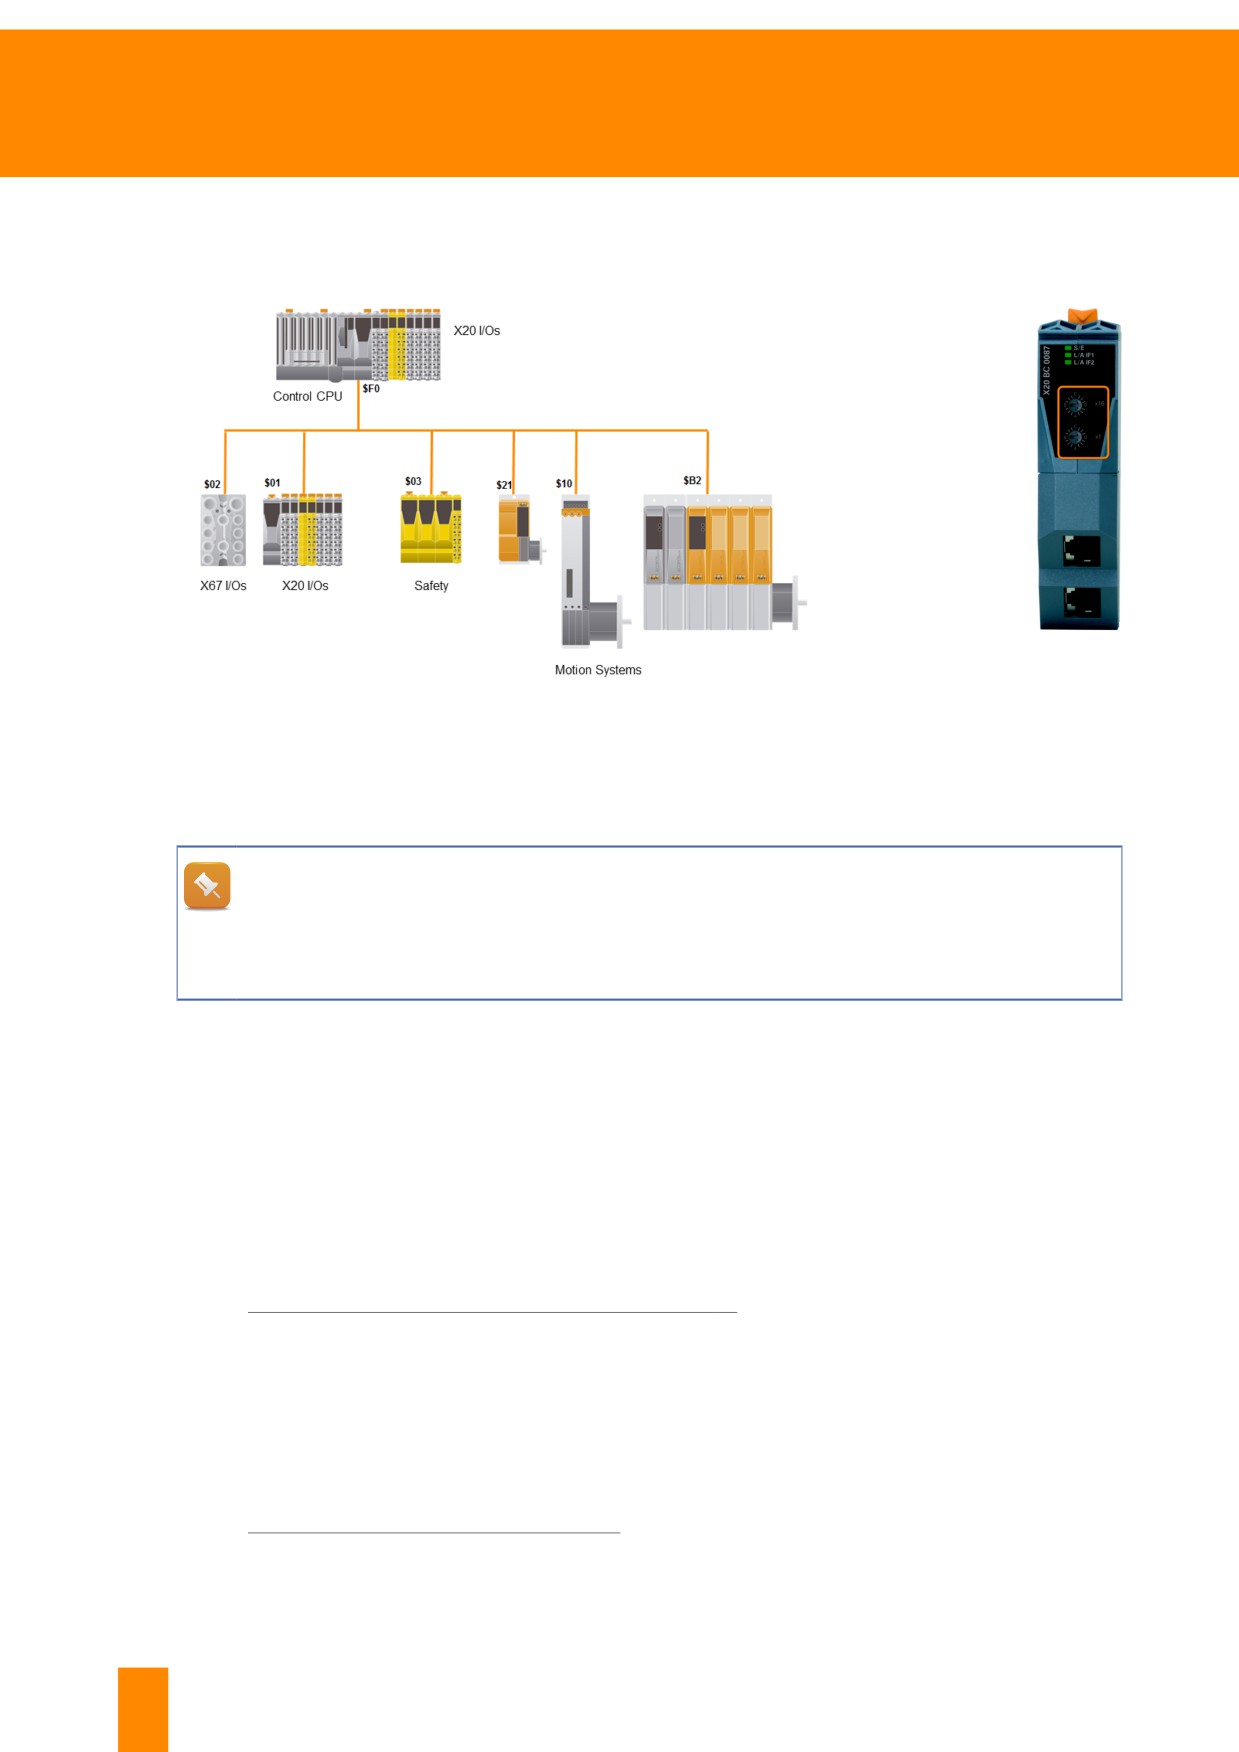
The node number is set right on the device using the selector switch19 and must be unique on the
respective fieldbus. The backplane modules on remote X20 I/O modules can also contain node number
switches.
Figure
71: Node
number
Figure 70: All stations are networked together via POWERLINK. Each station has a unique node number
switch
on bus
controller
X20BC0087
What should be kept in mind regarding the node number?
When replacing a device, make sure that the node number set for the new device is the same
as that of the old device. New devices delivered by B&R are set to node number $00. The node
number on the B&R system is set to hexadecimal form, e.g. $1B corresponds to decimal 27.
Module type
Before replacing the module, make sure that the right module type is being used. The original device
model number must match that of the replacement. This can be checked using the model number located
next to the serial number. The control CPU will not be able to configure or start an incorrect module
that is connected.
The serial number of modules that are difficult to access can be read using the hardware tree in the
System Diagnostics Manager.
Further information:
•
4.1 "Serial numbers and model numbers" on page 20
Backing up and restoring
All fieldbuses, I/O modules and drives are configured and started by the controller's CPU. If you replace
CPU of the controller yourself, you should be aware that all data that's saved on the controller will go
missing. Therefore it's necessary, if possible, to back up important data in advance.
Further information
•
8 "Backing up and restoring" on page 70
19 Devices without a node number switch are automatically addressed and configured with an ascending node
number.
58
TM920 - Diagnostics and service
Troubleshooting
Exercise: Creating a topology diagram
Having a topology diagram of the machine controller to hand can be very helpful when communicating
with other colleagues or with B&R Support. In the vast majority of cases, the topology is derived directly
from the machine's electrical diagrams.
In this exercise, we will be creating a topology diagram of the practice setup used. This is done by outlining
and noting all bus connections and the node numbers of the bus stations. The material numbers of the
individual modules can also be entered in the topology.
7.2.1 I/O, fieldbus devices, interfaces
In the control system, I/O modules serve to connect sensors and actuators. Different devices are con-
nected with the controller via interface and fieldbus modules.
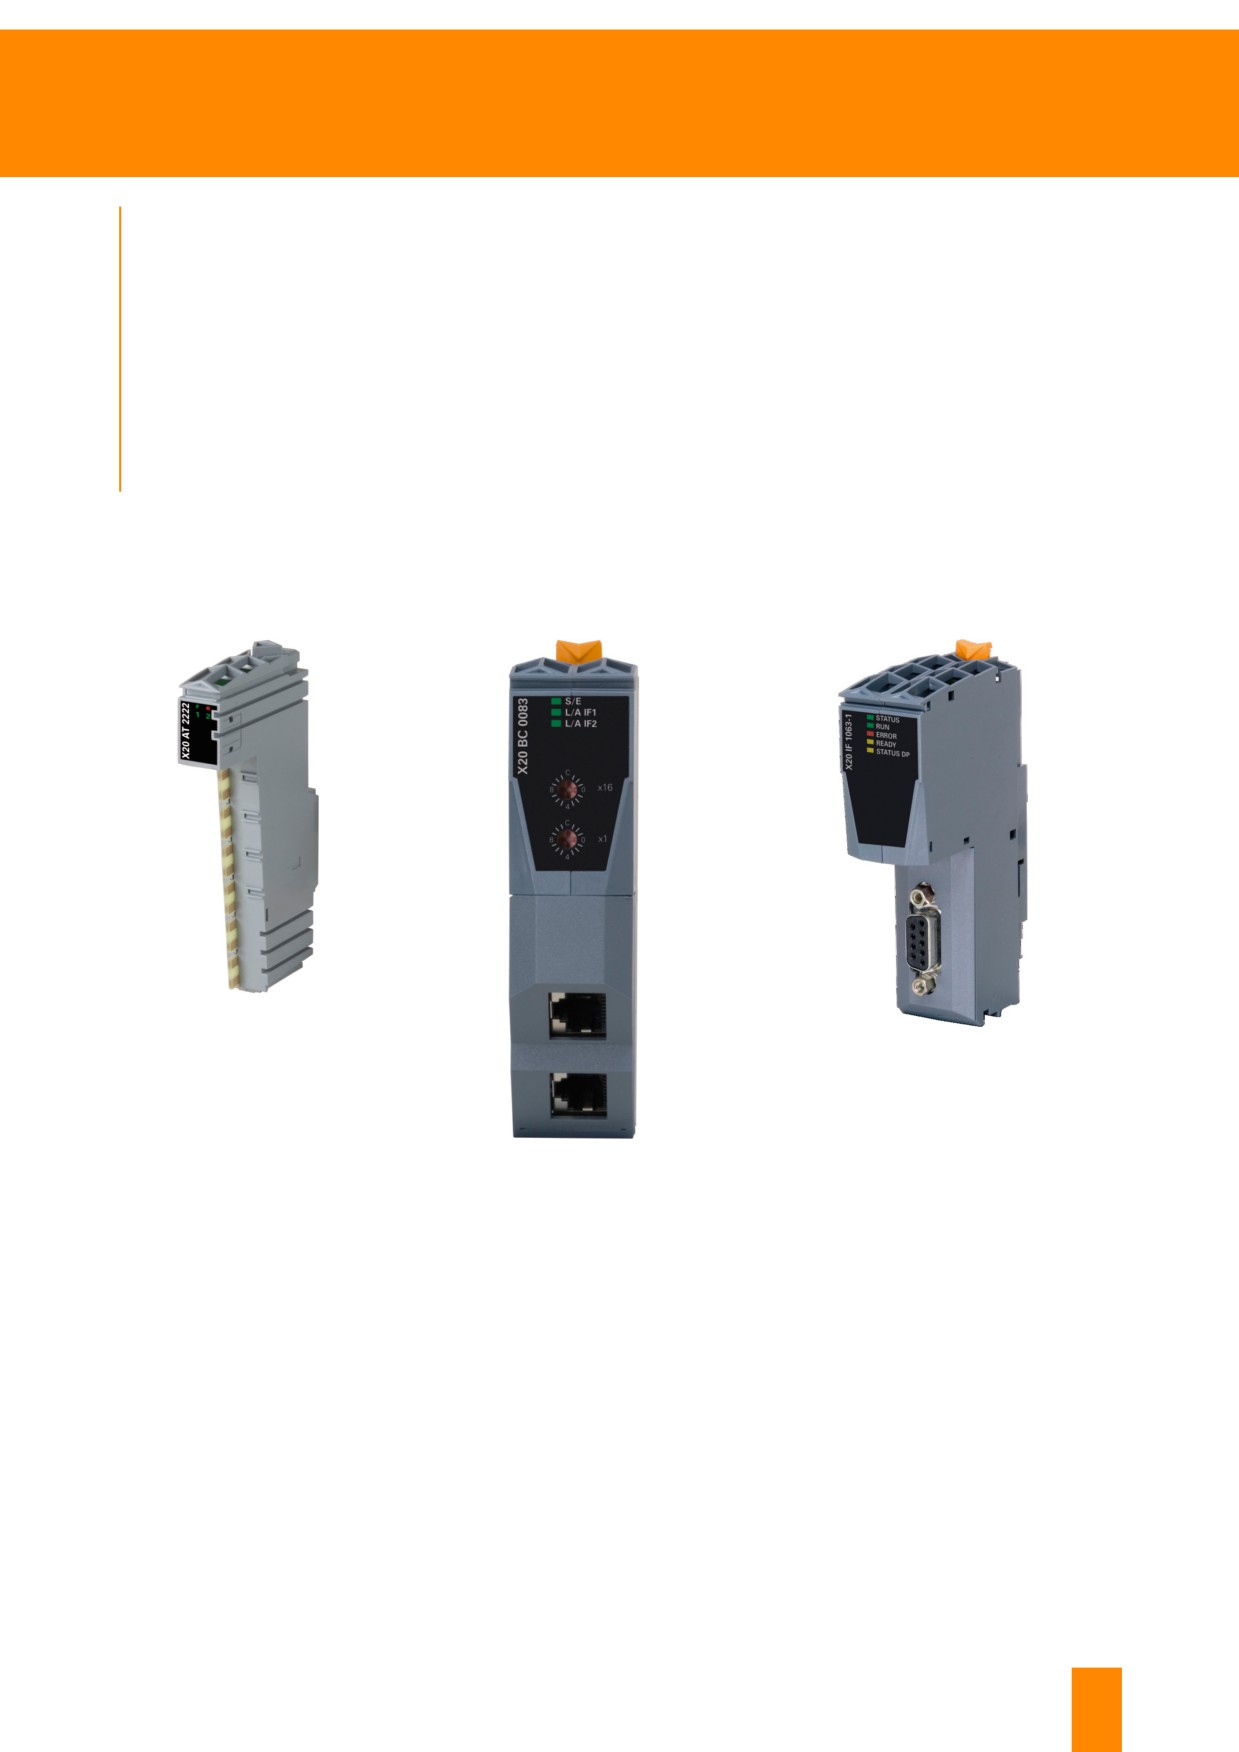
Figure 72:
X20AT2222
Figure 74: X20IF1063-1
- Temperature
- PROFIBUS interface
measurement
module
module
Figure 73:
X20BC0083 -
POWERLINK bus
controller
When replacing I/O modules, fieldbus devices and interfaces, make sure that the new module is the
same type.
Also be sure to check the node number switches20 on the module. If the LED status indicators on the
module indicate "RUN" in accordance with the user's manual or data sheet, then the module replacement
has been completed successfully.
20 Bus controllers, interface modules, X20 backplane modules and X67 modules mostly contain node number
switches. All other modules are addressed automatically.
TM920 - Diagnostics and service
59
Troubleshooting
Recommended procedure for module replacement:
• Check model number of replacement part
• Switch off supply voltage21
• Set the node number switch correctly
• Replace module
• Switch supply voltage back on again
• Wait for startup → Check LED status indicators
How long does the module replacement take?
After replacing I/O modules, fieldbus devices or interfaces, it can take a few minutes for the
control system to start running again. The reason is that the operating software and the con-
figuration must be transferred from the control CPU to the new module. This occurs only once
and is signaled by the LED status indicators on the module.
When is a module permitted to be exchanged?
Refer to the respective user's manual to determine whether a module can be replaced during
operation with supply voltage turned on.
7.2.2 Control CPU
Many control CPUs contain a CompactFlash card22. This is where the control application and all config-
uration files for the machine are stored.
The following information also applies to HMI devices (Power Panels) and industrial PCs (Au-
tomation PC) that are used to perform control tasks.
Recommended procedure for replacing the control CPU:
• Check model number of replacement part.
• If possible, back up all process variables.
• Turn off supply voltage.
• Set node number switch properly on the replacement device.
• If there is a CompactFlash card, remove it and insert it in the new CPU.
• Remove Technology Guard from the USB port and insert in the new CPU.
• Switch supply voltage back on.
• Wait for startup →Check LED status indicators.
21 X20 modules can also be replaced during operation. First make sure that this is also allowed on the re-
spective machine.
22 In a few types, the application memory is built directly into the CPU and cannot be replaced externally.
60
TM920 - Diagnostics and service
Troubleshooting
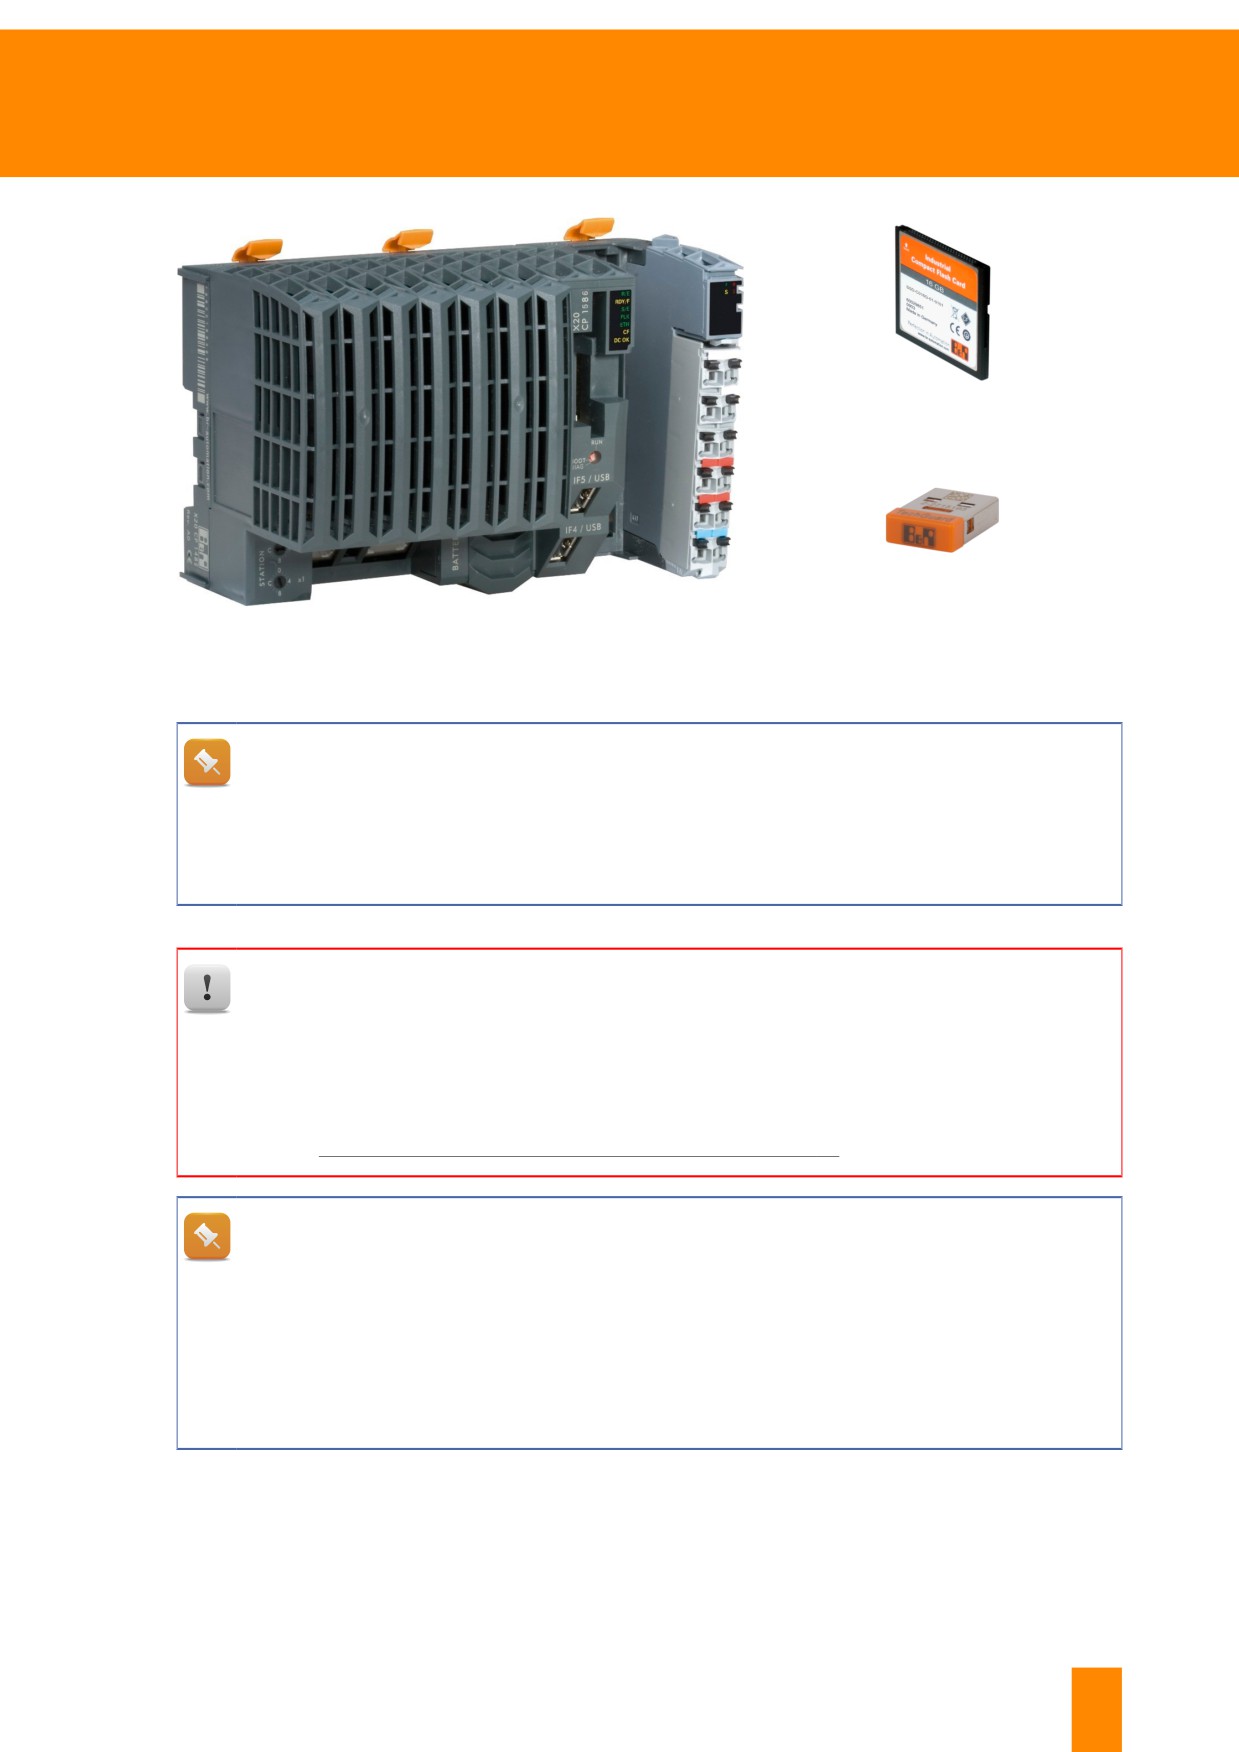
Figure 76:
CompactFlash
Figure 77:
Technology
Guard
Figure 75: X20CP1586 - Control CPU
Can the old CPU be exchanged with a new, different CPU?
The model number of the replacement CPU must match that of the original CPU. Different
CPUs use different processors. The operating system installed on the CompactFlash card must
match the original CPU type. The controller will therefore not start properly if a different CPU is
used23. This is signaled via the LED status indicators on the CPU.
CompactFlash cards are only permitted to be removed or inserted when the power is off.
When using a control CPU with an integrated application memory, the machine manufacturer
must provide either a replacement CPU with the application program preinstalled or the data
needed to generating a remote install structure.
Further information:
•
8.1.3 "Generate project installation package" on page 77
Does the data in the battery-backed memory get lost during CPU replacement?
Depending on the control program, some process data and parameters may be stored in the
control CPU's battery-backed memory. These data and parameters will be lost when the control
CPU is replaced and must therefore be backed up prior to replacement.
Only the machine controller's software project can indicate whether or not relevant process
data and parameters are stored in the battery-backed memory on the control CPU. Only the
machine manufacturer can provide this information.
23 In this case, the machine manufacturer would have to change the hardware configuration of the control
application and create a new CompactFlash card.
TM920 - Diagnostics and service
61
Troubleshooting
7.2.3 HMI devices, industrial PCs
Power Panels with and without touch screens
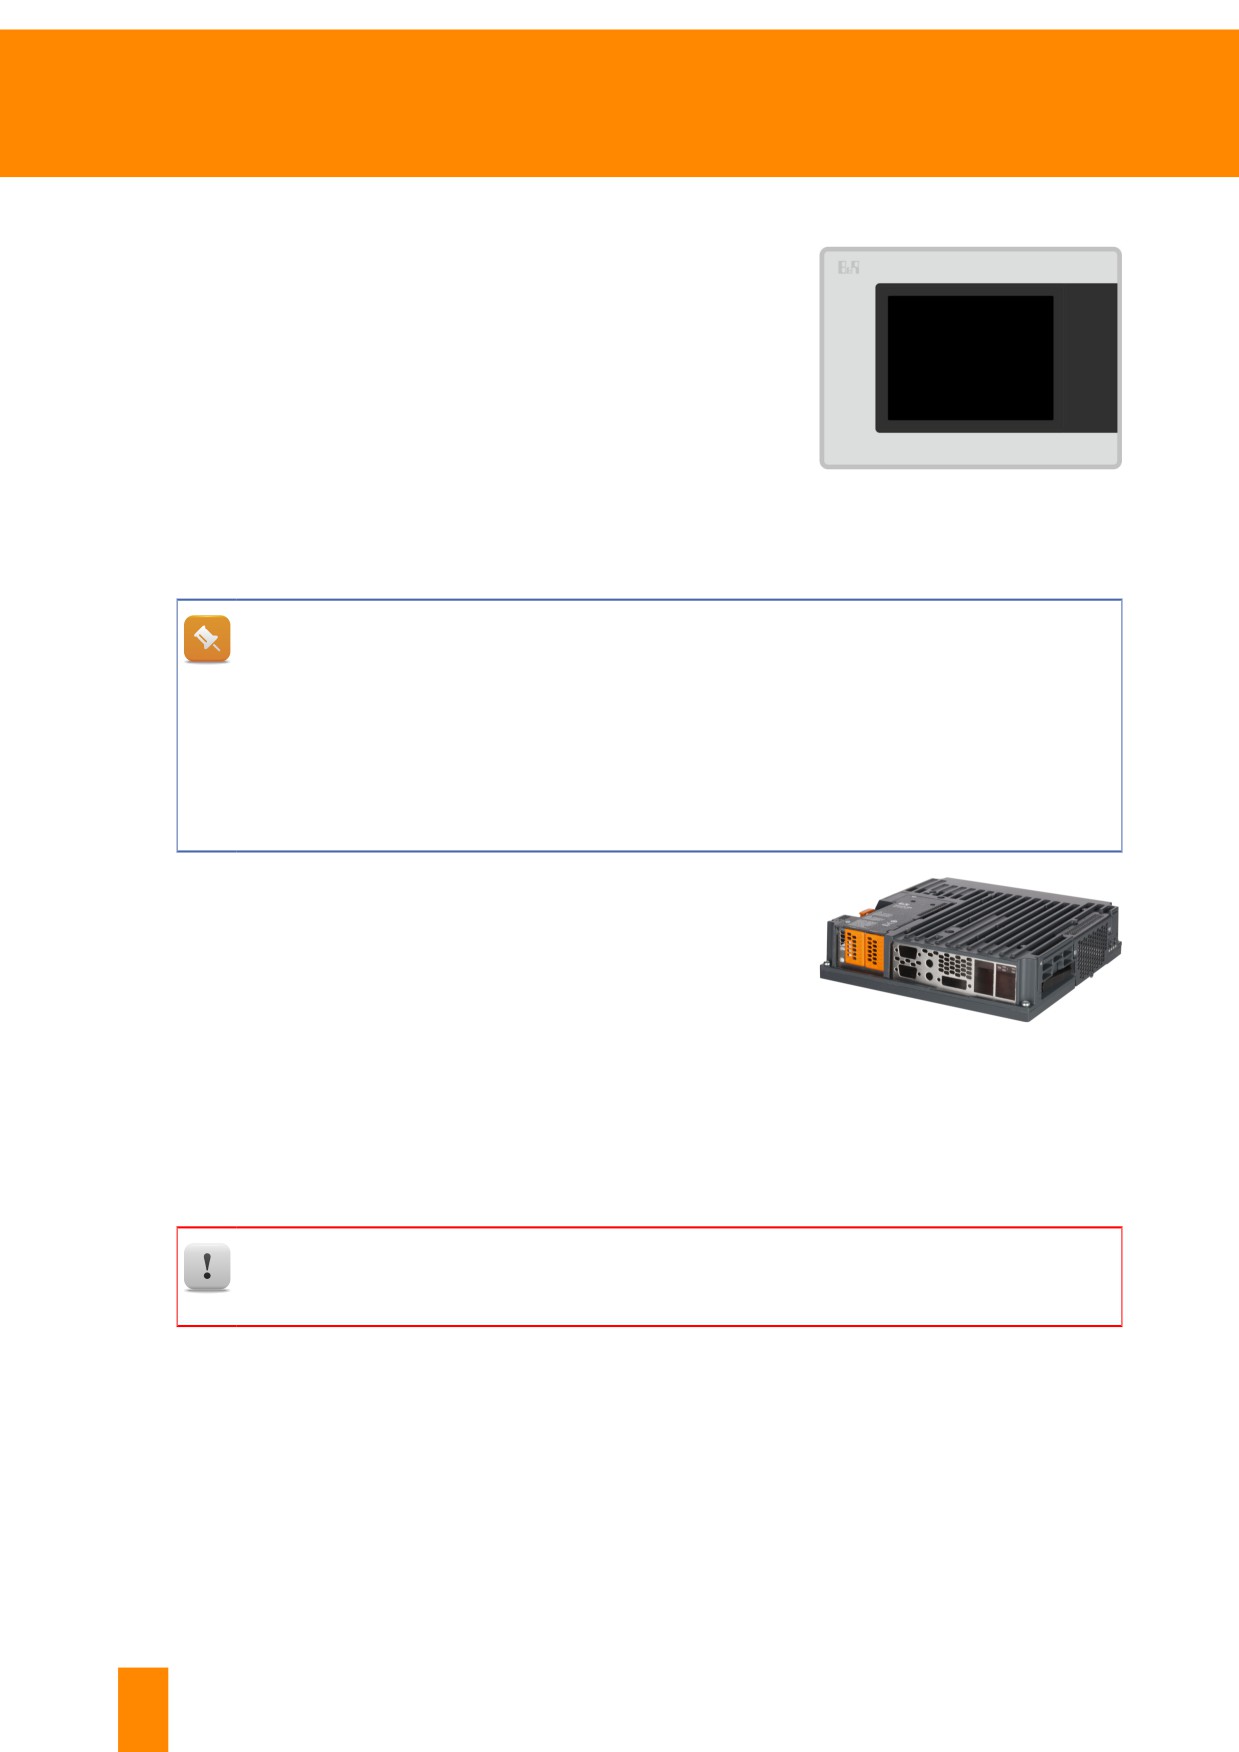
A Power Panel is essentially a controller with integrated display.
The same rules as for a control CPU apply for dealing with these
devices. Interface cards can be integrated into the device.
Figure 78: Power Panel
5PP520.0573-01
Does the new touch screen have to be calibrated after replacing the module?
Many B&R touch screen devices are equipped with a touch controller that supports hardware
calibration. This means that these devices are delivered pre-calibrated. Recalibration is gener-
ally not required after replacement. For detailed information about touch screen calibration see
section "Touch screen" in the respective user's manual.
The procedure for recalibrating a touch screen is usually a function of the machine's HMI ap-
plication and can be found in the user's manual of the machine.
Automation PC (APC), Panel PC (PPC)
An industrial PC works according to the same principles as a con-
ventional PC. The operating system and application programs are
stored on a hard drive or CompactFlash card. The mass storage de-
vices used in B&R's industrial PCs can be accessed and replaced
easily from the front without having to open up the device. An Au-
tomation Panel is usually used to display the user interface.
Figure 79: Panel PC 910 system unit
On a Panel PC, the monitor and PC are integrated into one device. On the newer generation of Panel
PCs, the PC unit is mounted on an Automation Panel. This allows users to replace the PC or display
unit independently of one another.
Hard drives, solid state disks (SSD), CompactFlash and CFast cards are only permitted to be
removed when the power is switched off.
62
TM920 - Diagnostics and service