содержание .. 7 8 9 10 ..
НАК „НАФТОГАЗ УКРАЇНИ“. Річний звіт англійською (2017 рік) - 9
OUR PERFORMANCE
ANNUAL REPORT 2017
133
132
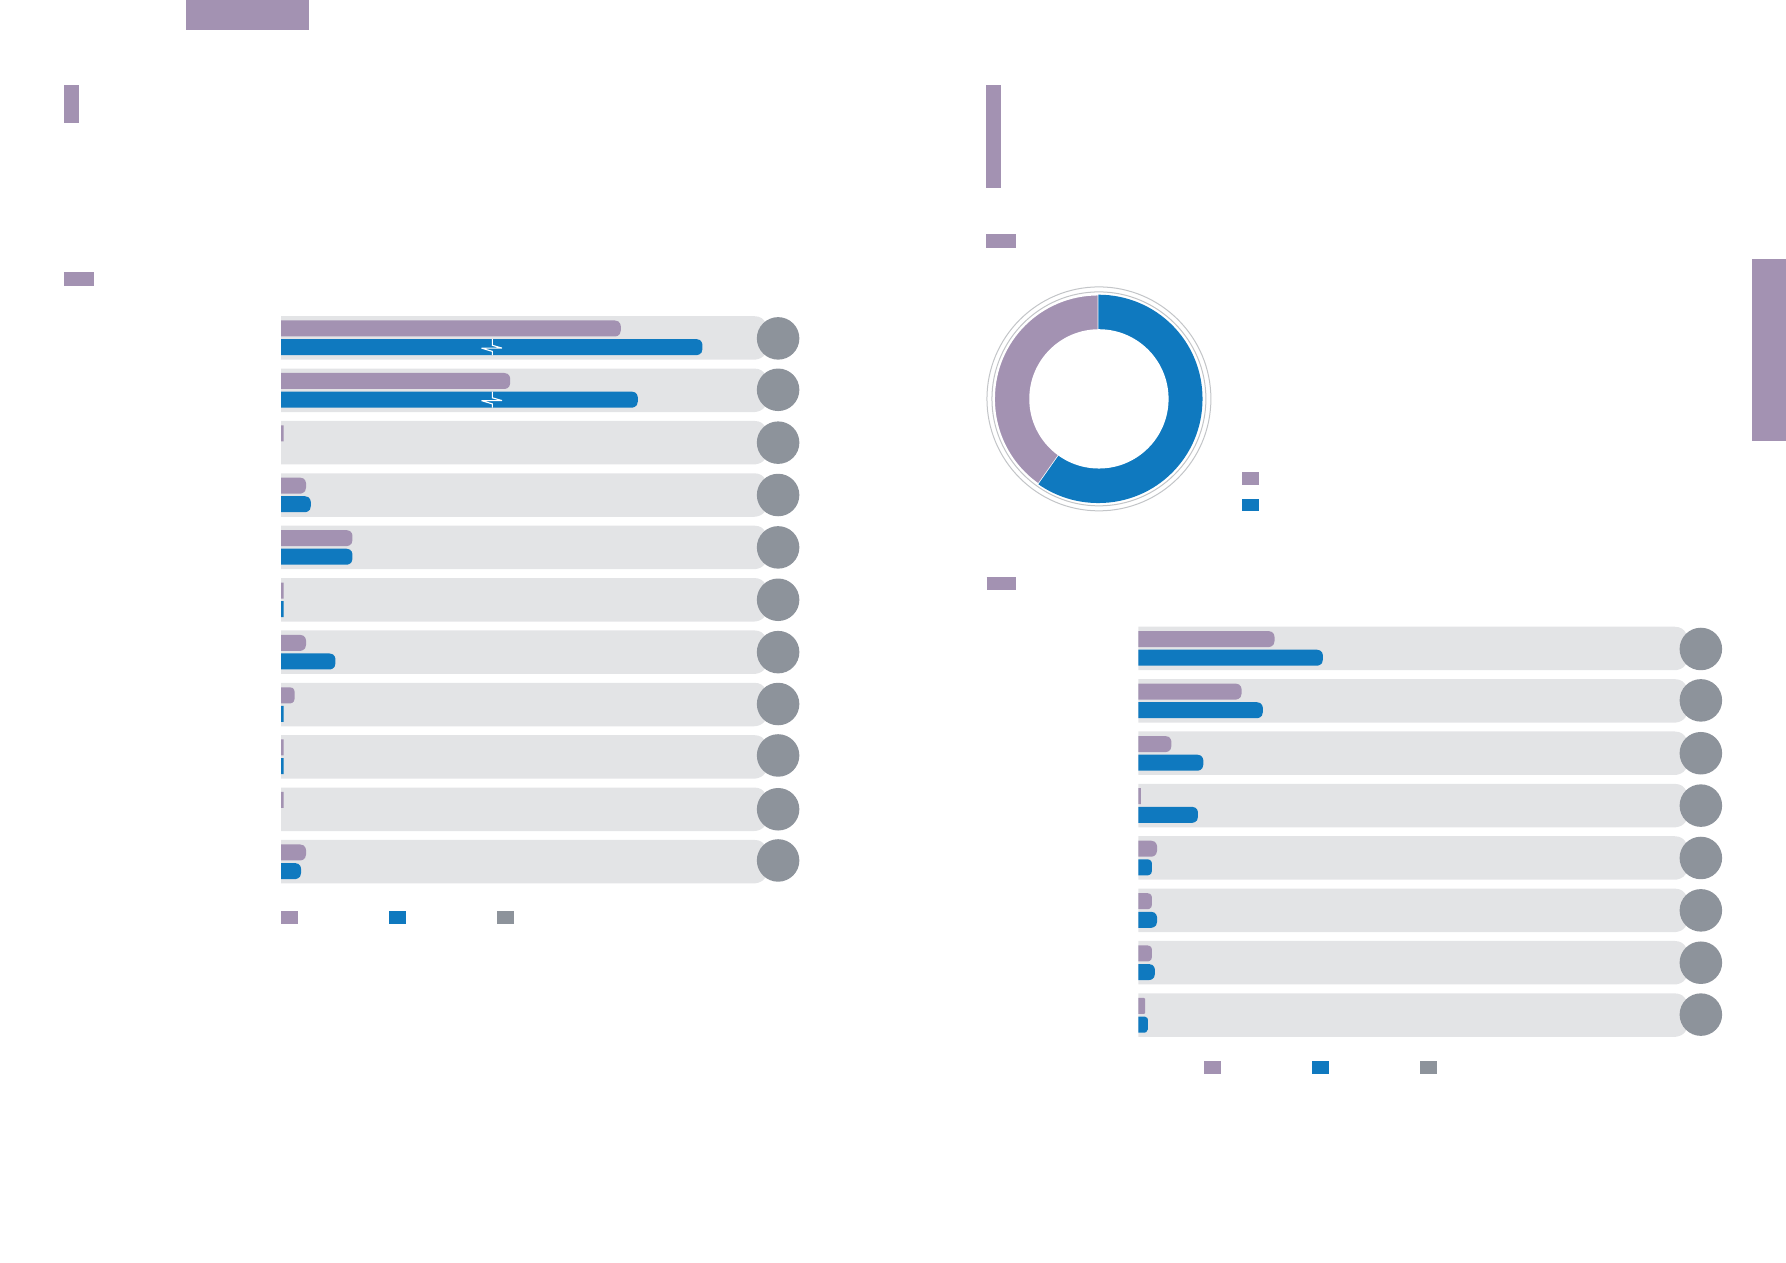
CAPITAL INVESTMENTS
The total amount of capital investments of Naftogaz group increased in 2017 compared
to 2016 by 79%, or by UAH 7.5 billion.
9.5
0.6
0.04
17.0
0.7
0.04
5.4
1.7
0.1
12.5
0.6
1.7
0.05
0.1
0.3
1.3
0.1
0.6
0.0
0.1
0.1
0.5
Capital investments
Oil and gas
condensate sales
Gas storage
Gas production and
sales under PSO
Petroleum products sales
Gas
transit
Oil domestic transmission
Sales of natural gas at
nonregulated prices
Oil transit
Gas domestic transmission
Other
2016
2017
2017/2016
–14%
–58%
–9%
–58%
116%
16%
2%
15%
–56%
130%
79%
Capital investments by business, UAH billion
The group's priority for capital
investment is still the extraction
of natural gas, which is further
directed to the sale and supply
of natural gas to consumers
under PSO. 74% of the total
investment is allocated for this
business in 2017 (compared
to 57% in 2016). The amount
of investment has more than
doubled in 2017 compared
with 2016 due to the continued
expansion of exploration and
operational drilling capacities of
Ukrgazvydobuvannya. The total
cost of these works in 2017 is
more by UAH 2 billion, or 53%
compared with 2016.
In addition, significant
investments of the group
relate to petroleum product
sales, where investments
grew by 116% mainly
due to an increase in the
Ukrgazvydobuvannya capital
investments program. The
amount of capital investments
in Gas transit, which represents
about 10% of the total
investments, remained almost
unchanged in 2017 compared
to 2016.
PAYMENT OF TAXES
TO THE BUDGET
In 2017 Naftogaz remained
the largest taxpayer in Ukraine.
For example, during this
year Naftogaz group paid
UAH 109.9 billion of taxes to the
budget, which is 49% more than
in 2016.
In addition, in 2017 Naftogaz,
being a separate legal entity,
paid UAH 13.3 billion to the
state budget as a dividend
calculated based on its
performance in 2016.
74�0
109�9
2016
2017
49%
2017/2016
Total amount of taxes paid by group enterprises, UAH billion
30.4
1.0
41.4
13.3
23.3
4.4
27.7
2.7
3.2
7.7
1.1
3.7
3.3
14.1
2.3
4.3
VAT
Dividends
Subsoil royalty
charge for gas
Subsoil royalty charge
for gas condensate
Subsoil royalty charge
for oil
Income tax
Other
Social charges
2016 2017
2017/2016
–26�5%
102�0%
36�4%
30�7%
1198�7%
82�2%
18�9%
35�9%
Payment of taxes by type, UAH billion