SINUMERIK 840D sl. Service - Configuring Commissioning. Manual (2011-2020) - page 52
Programming commands
7.3 Functions
Programming
Syntax:
REG[x]
Description:
Defines a register
Parameters:
x
Register index with x = 0...19;
Type: REAL or STRING = VARIANT
Registers with x ≥ 20 have already been assigned by Siemens.
Description of register value
The assignment of values to registers is configured in a method.
Note
If a new dialog is generated from an existing dialog by means of the LM function, register
content is automatically transferred to the new dialog at the same time and is available for
further calculations in the second dialog.
Programming
Syntax:
Identifier.val = Register value
or
Identifier = Register value
Description:
Parameters:
Identifier
Name of the register
Register value
Value of register
Example
UNLOAD
REG[0] = VAR1
; Assign value of variable 1 to register 0
END_UNLOAD
UNLOAD
REG[9].VAL = 84
; Assign value 84 to register 9
END_UNLOAD
; These registers can then be assigned to local variables
again in a method in the next dialog.
LOAD
VAR2 = REG[0]
END_LOAD
SINUMERIK Integrate Run MyScreens
182
Programming Manual, 10/2020, A5E40869575B AD
Programming commands
7.3 Functions
Description of register status
The Status property can be used to scan a register for valid content.
One possible use for the register scan function is to ensure that a value is written to a register
only if the relevant dialog is a "master dialog".
Programming
Syntax:
Identifier.vld
Description:
The property can only be read.
Parameters:
Identifier
Name of the register
Return value:
The result of the scan can be:
FALSE =
invalid value
TRUE =
valid value
Example
IF REG[15].VLD == FALSE
; Scan validity of register value
REG[15] = 84
ENDIF
VAR1 = REG[9].VLD
; Assign the value of the REG[9] status request to Var1.
7.3.32
RETURN
Description
The RETURN function can be used to prematurely terminate execution of the current
subprogram and to return to the branch point of the last CALL command.
If no RETURN command is configured in the subprogram, the subprogram will run to the end
before returning to the branch point.
Programming
Syntax:
RETURN
Description:
Returns to the branch point
Parameters:
- None -
Example
//B(PROG1)
; Block start
SINUMERIK Integrate Run MyScreens
Programming Manual, 10/2020, A5E40869575B AD
183
Programming commands
7.3 Functions
SUB(UP2)
; Start of subprogram
IF VAR1.val=="Otto"
VAR1.val="Hans"
RETURN
; If the variable value = Otto, the value "Hans" is as-
signed to the variable, and the subprogram ends at this
point.
ENDIF
VAR1.val="Otto"
; If the variable value ≠ Otto, the value "Otto" is as-
signed to the variable.
END_SUB
; End of subprogram
//END
; Block end
7.3.33
Recompile
Description
In the programming support system, it is possible to recompile NC code that has been
generated with the GC function and to display the variable values in the input/output field of the
associated entry dialog again.
Programming
Variables from the NC code are transferred to the dialog. At the same time, the variable values
from the NC code are compared with the calculated variable values from the configuration file.
If the values do not coincide, an error message is written to the log book because values have
been changed during NC code generation.
If the NC code contains the same variable several times, it is evaluated at the point where it last
occurs during recompilation. A warning is also written to the log book.
Variables not utilized in NC code during code generation are stored as user comment. The term
"user comment" refers to all information required to recompile codes. User comment must not
be altered.
Note
The block consisting of NC code and user comment can be recompiled only if it starts at the
beginning of a line.
Examples:
The programm contains the following NC code:
DEF VAR1=(I//101)
OUTPUT(CODE1)
"X" VAR1 " Y200"
SINUMERIK Integrate Run MyScreens
184
Programming Manual, 10/2020, A5E40869575B AD
Programming commands
7.3 Functions
"X" VAR1 " Y0"
END_OUTPUT
The following code is then stored in the parts program:
;NCG#TestGC#\cus.dir\aeditor.com#CODE1#1#3#
X101 Y200
X101 Y0
;#END#
The Editor reads the following during recompilation:
X101 Y200
X222 Y0
; The value for X has been changed in the part program (X101 → X222)
The following value is displayed for VAR1 in the input dialog: VAR1 = 222
See also
Generate code (GC) (Page 167)
7.3.34
Recompile without user comment
Description
In the Programming Support, it is possible to recompile without user comments the NC code
that has been generated with the GC function and to display the variable values in the input/
output field of the associated entry dialog again.
Programming
The GC command can be executed in the following way in order to suppress comment lines that
are generated for standard code generation:
GC("CODE1",D_NAME,1)
SINUMERIK Integrate Run MyScreens
Programming Manual, 10/2020, A5E40869575B AD
185
Programming commands
7.3 Functions
Normally, the resulting code cannot be recompiled. The following steps are required in order to
be able to recompile the cycle calls generated in this way:
• Extend the file "easyscreen.ini"
The section [RECOMPILE_INFO_FILES] is introduced into the "easyscreen.ini" file. In this
section, all ini files are listed that contain descriptions for cycles recompiled without user
comment:
[RECOMPILE_INFO_FILES]
IniFile01 = cycles1.ini
IniFile02 = cycles2.ini
Several ini files can be specified, whose names can be freely selected.
• Creating an ini file for a cycle description
Save the ini file with the cycle descriptions under the following path:
[System user-directory]/cfg
[System oem-directory]/cfg
[System addon-directory]/cfg
A separate section is required for each cycle. The section name corresponds to the name of
the cycle:
[Cycle123]
Mname = TestGC
Dname = testgc.com
OUTPUT = Code1
Anzp = 3
Version = 0
Code_type = 1
Icon = cycle123.png
Desc_Text = This is describing text
Mname
Screen name
Dname
Name of the file in which the screen is defined
OUTPUT
Name of the relevant OUTPUT method
Anzp
Number of parameters of the screen to be recompiled (all with DEF-
created variables, also help variables)
Version
(optional) version specification for cycle
Icon
(optional) icon for display in the machining step program, format
*.png
Screen size for corresponding resolution:
640 x 480 mm → 16 x 16 pixels
800 x 600 mm → 20 x 20 pixels
1024 x 768 mm → 26 x 26 pixels
1280 x 1024 mm → 26 x 26 pixels
1280 x 768 mm → 26 x 26 pixels
Storage: [System user-directory]/ico/ico<resolution>
Notes:
• For resolutions of 1280, the folder for 1024 x 768 mm is used
(only suitable for machining step programs).
• The screen size is not just dependent on the resolution, but also
on the font size set in the editor.
SINUMERIK Integrate Run MyScreens
186
Programming Manual, 10/2020, A5E40869575B AD
Programming commands
7.3 Functions
Desc_Text
(optional) Explanation text for display in the machining step pro-
gram, max. length of string is 17 characters (only suitable for ma-
chining step programs)
Param_Text
(optional) Text for the parameter list
T=%1 D=%2
Note
Notes on Icon, Desc_Text and Param_Text:
1. The user icon is always displayed in the G code editor. The G code icon is always displayed in
the ShopMill/ShopTurn editor. This helps to better distinguish between ShopMill/ShopTurn
steps and NON-ShopMill/ShopTurn steps.
2. The Run MyScreens step is dependent on the editor setting "Display cycles as machining
step". This applies to both the G code and the JobShop editor.
This means that when "Display cycles as machining step" = "YES", the "Desc_Text" of the Run
MyScreens configuration is taken; when "NO", the cycle is displayed.
3. Desc_Text and Param_Text
- can be specified according to language via the $xxxxx notation.
- The parameters of the cycle call generated can be accessed via %1, %2, etc. This involves
the placeholder being replaced by the parameter that is specified after the '%' in the
parameter list generated.
Example
//M(TestGC/"Code generation:")
DEF VAR1 = (R//1)
DEF VAR2 = (R//2)
DEF D_NAME
LOAD
VAR1 = 123
VAR2 = -6
END_LOAD
OUTPUT(CODE1)
"Cycle123(" VAR1 "," VAR2 ")"
"M30"
END_OUTPUT
PRESS(VS1)
D_NAME = "\MPF.DIR\MESSEN.MPF"
GC("CODE1",D_NAME)
;Write NC code from the OUTPUT method to
file \MPF.DIR\MESSEN.MPF:
Cycle123(123, -6)
M30
END_PRESS
SINUMERIK Integrate Run MyScreens
Programming Manual, 10/2020, A5E40869575B AD
187
Programming commands
7.3 Functions
Supplementary conditions
• The "Recompile without user comment" functionality does not have the full range of
functions as "Recompile with user comment".
Typical cycle calls, such as MYCYCLE(PAR1, PAR2, PAR3, …), are supported during "Recompile
without user comment". However, there must not be a user comment in the line of the
function call. Optional parameters that are not transferred during the function call and are of
the string S type must however be at least specified with empty quotation marks, e.g. "".
Otherwise, "Run MyScreens" attempts to fill these parameters using commas so that the
"filled cycle call" can then be recompiled.
• Parameters of the string type must not have any commas or semicolons in the string to be
transferred.
• During "Recompile without user comment", all variables contained in the OUTPUT method
must always be within the brackets so that the "Fill in missing cycle parameters with commas"
functionality can take effect.
Example:
Permitted:
OUTPUT
"MYCYCLE(" MYPAR1 "," MYPAR2 "," MYPAR3 ")"
END_OUTPUT
Not permitted (variable MYCOMMENT is positioned after the closing bracket.):
OUTPUT
"MYCYCLE(" MYPAR1 "," MYPAR2 "," MYPAR3 ")" MYCOMMENT
END_OUTPUT
7.3.35
Search Forward, Search Backward (SF, SB)
Description
The SF, SB (Search Forward, Search Backward) function is used to search for a string from the
current cursor position in the NC program currently selected in the Editor and to output its value.
Programming
Syntax:
SF("String")
Designation:
Search Forward: Search forward from the current cursor position
Syntax:
SB("String")
Designation:
Search Backward: Search backward from the current cursor position
Parameters:
String
Text to be found
SINUMERIK Integrate Run MyScreens
188
Programming Manual, 10/2020, A5E40869575B AD
Programming commands
7.3 Functions
Rules governing text search
• A blank must be inserted before and after the search concept unit, consisting of search string
and its value, in the currently selected NC program.
• The system does not search for concepts within comment text or other strings.
• The value to be output must be a numerical expression. Expressions in the form of "X1=4+5"
are not recognized.
• The system recognizes hexadecimal constants in the form of X1='HFFFF', binary constants in
the form of X1='B10010' and exponential components in the form of X1='-.5EX-4'.
• The value of a string can be output if it contains the following between string and value:
- Nothing
- Blanks
- Equality sign
Example
The following notations are possible:
X100 Y200
; The variable Abc is assigned the value 200
Abc = SB("Y")
X100 Y 200
; The variable Abc is assigned the value 200
Abc = SB("Y")
X100 Y=200
; The variable Abc is assigned the value 200
Abc = SB("Y")
7.3.36
STRING functions
Overview
The following functions enable strings to be processed:
• Determine length of string
• Find a character in a string
• Extract substring from left
• Extract substring from right
• Extract substring from mid-string
• Replace substring
• Compare strings
• Insert a string in another string
• Remove a string from a string
SINUMERIK Integrate Run MyScreens
Programming Manual, 10/2020, A5E40869575B AD
189
Programming commands
7.3 Functions
• Remove spaces (from left or from the right)
• Insert values or strings with formatting identifiers
LEN function: Length of a string
Syntax:
LEN(string | varname)
Description:
Determines the number of characters in a string
Parameters:
string
Every valid string expression. NULL is output if string is
empty.
varname
Any valid declared variable name
Only one of the two parameters is allowed.
Example
DEF VAR01
DEF VAR02
LOAD
VAR01="HALLO"
VAR02=LEN(VAR01)
; Result = 5
END_LOAD
INSTR function: Search for character in string
Syntax:
INSTR(Start, String1, String2 [,Direction])
Description:
Searches for characters
Parameters:
Start
Starting position for searching for string1 in string2. En-
ter 0 to start searching at the beginning of string2.
String1
Character that is being searched for.
String2
Character string in which the search is being made.
Direction (optional)
Direction in which the search is being made.
0: From left to right (default setting)
1: From right to left
0 is returned if string1 does not occur in string2.
Example
DEF VAR01
DEF VAR02
LOAD
SINUMERIK Integrate Run MyScreens
190
Programming Manual, 10/2020, A5E40869575B AD
Programming commands
7.3 Functions
VAR01="HALLO/WELT"
VAR02=INST(1,"/",VAR01)
; Result = 6
END_LOAD
LEFT Function: String from left
Syntax:
LEFT(string, length)
Description:
LEFT returns a string containing the specified number of characters starting from
the left-hand side of a string.
Parameters:
string
Character string or variable with the character string to be pro-
cessed
length
Number of characters that are to be read out
Example
DEF VAR01
DEF VAR02
LOAD
VAR01="HALLO/WELT"
VAR02=LEFT(VAR01,5)
; Result = "HELLO"
END_LOAD
RIGHT function: String from right
Syntax:
RIGHT(string, length)
Description:
RIGHT returns a string containing the specified number of characters starting from
the right-hand side of a string.
Parameters:
string
Character string or variable with the character string to be pro-
cessed
length
Number of characters that are to be read out
Example
DEF VAR01
DEF VAR02
LOAD
VAR01="HALLO/WELT"
VAR02=LEFT(VAR01,4)
; Result = "WORLD"
END_LOAD
SINUMERIK Integrate Run MyScreens
Programming Manual, 10/2020, A5E40869575B AD
191
Programming commands
7.3 Functions
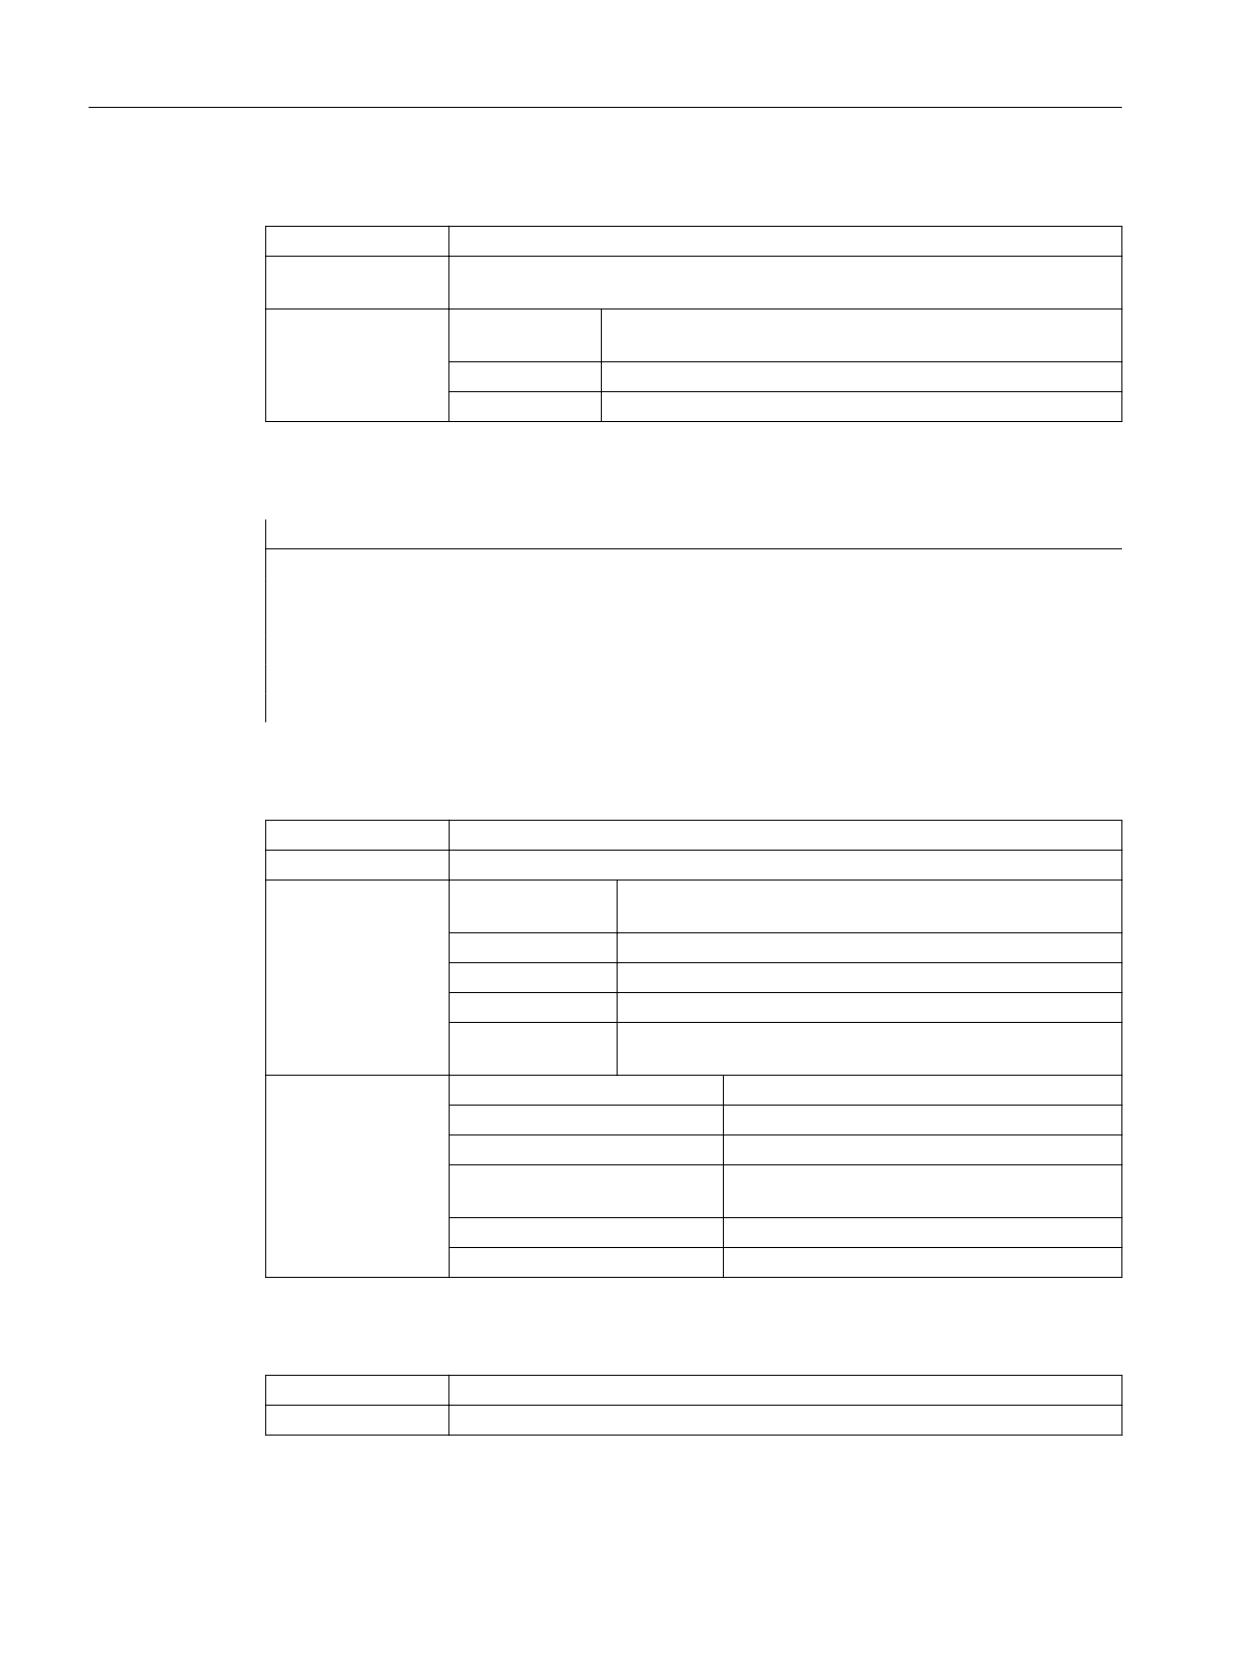
MIDS function: String from mid-string
Syntax:
MIDS(string, start [, length])
Description:
MIDS returns a string containing the specified number of characters starting at the
specified position in the string.
Parameters:
string
Character string or variable with the character string to be pro-
cessed
start
Start from where characters are to be read in the string
length
Number of characters that are to be read out
Example
DEF VAR01
DEF VAR02
LOAD
VAR01="HALLO/WELT"
VAR02=LEFT(VAR01,4,4)
; Result = "LO/W"
END_LOAD
REPLACE Function: Replacing characters
Syntax:
REPLACE( string, FindString, ReplaceString [, start [, count ] ] )
Description:
REPLACE replaces a character/string in a string with another character/string.
Parameters:
string
String in which FindString is to be replaced with Replace-
String.
FindString
String to be replaced
ReplaceString
Replacement string (is used instead of the FindString)
start
Starting position for search and replace operations
count
Number of characters that are to be searched from the start-
ing position after FindString
Return value:
string = Empty string
Copy of string
FindString = Empty string
Copy of string
ReplaceString = Empty string
Copy of string, in which all occurrences of Find-
String are deleted
start > Len(String)
Empty string
count = 0
Copy of string
STRCMP function: Compare strings
Syntax:
STRCMP(string1, string2 [, CaseInsensitive])
Description:
STRCMP compares a character string with another character string.
SINUMERIK Integrate Run MyScreens
192
Programming Manual, 10/2020, A5E40869575B AD
Programming commands
7.3 Functions
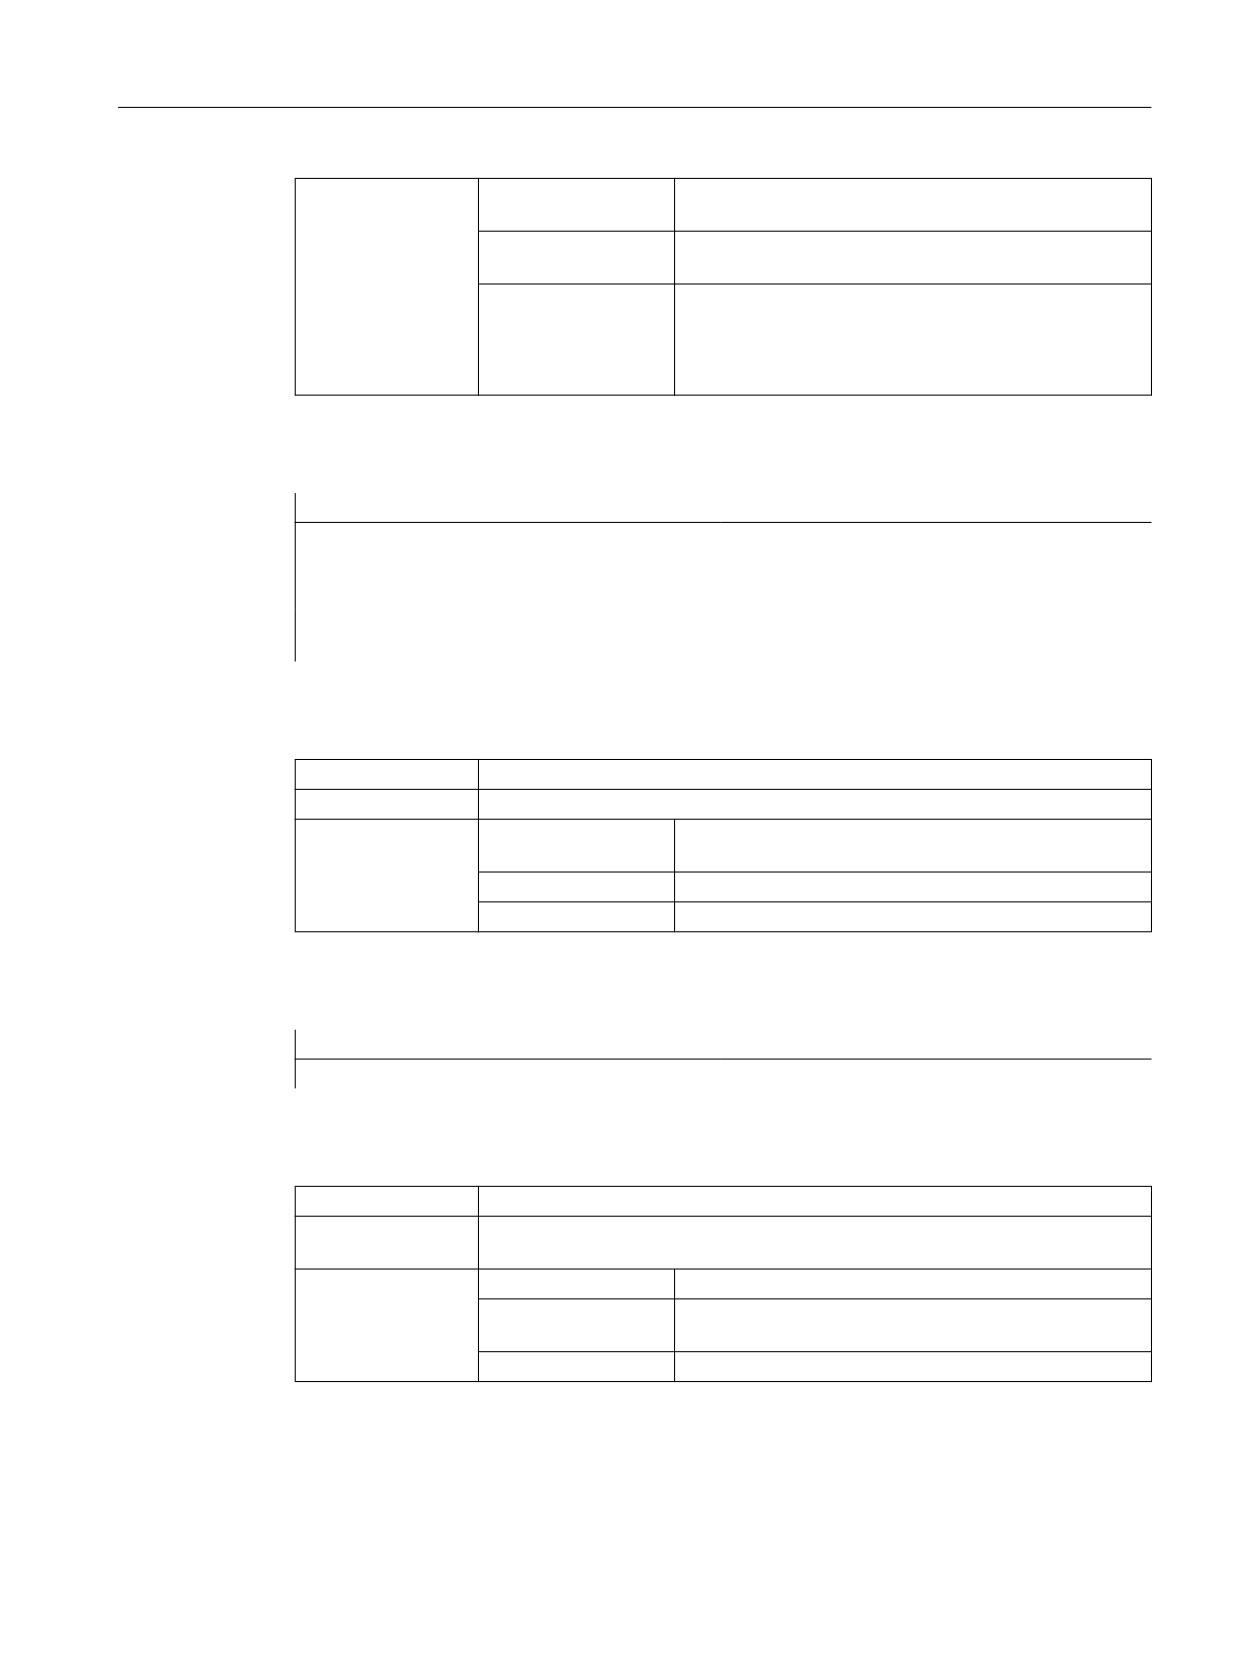
Parameters:
string1
Character string that is to be compared with a second
character string
string2
Character string that is to be compared with the first
character string
CaseInsensitive
Comparison with/without consideration of upper/lower
case:
Not specified or FALSE = upper/lower case is considered
TRUE = upper/lower case is not considered
Example
REG[0]=STRCMP("Hugo", "HUGO")
; Result = 32
; (<> 0, strings are not identical)
REG[0]=STRCMP("Hugo", "HUGO", TRUE)
; Result = 0
; (== 0, stings are identical)
STRINSERT function: Insert string
Syntax:
STRINSERT(string1, string2 , insert position)
Description:
STRINSERT inserts a character string at a specific position in a character string.
Parameters:
string1
Character string in which a character string is to be inser-
ted
string2
Character string that is to be inserted
insert position
Position at which the character string is to be inserted
Example
REG[0]=STRINSERT("Hello!", " world", 5)
; Result = "Hello world!")
STRREMOVE function: Remove string
Syntax:
STRREMOVE(string1, remove position , count)
Description:
STRREMOVE removes a specific number of characters at a specific position within
a character string.
Parameters:
string1
Character string from which characters are to be removed
remove position
Position at which characters are to be removed from the
character string
count
Number of characters to be removed
SINUMERIK Integrate Run MyScreens
Programming Manual, 10/2020, A5E40869575B AD
193
Programming commands
7.3 Functions
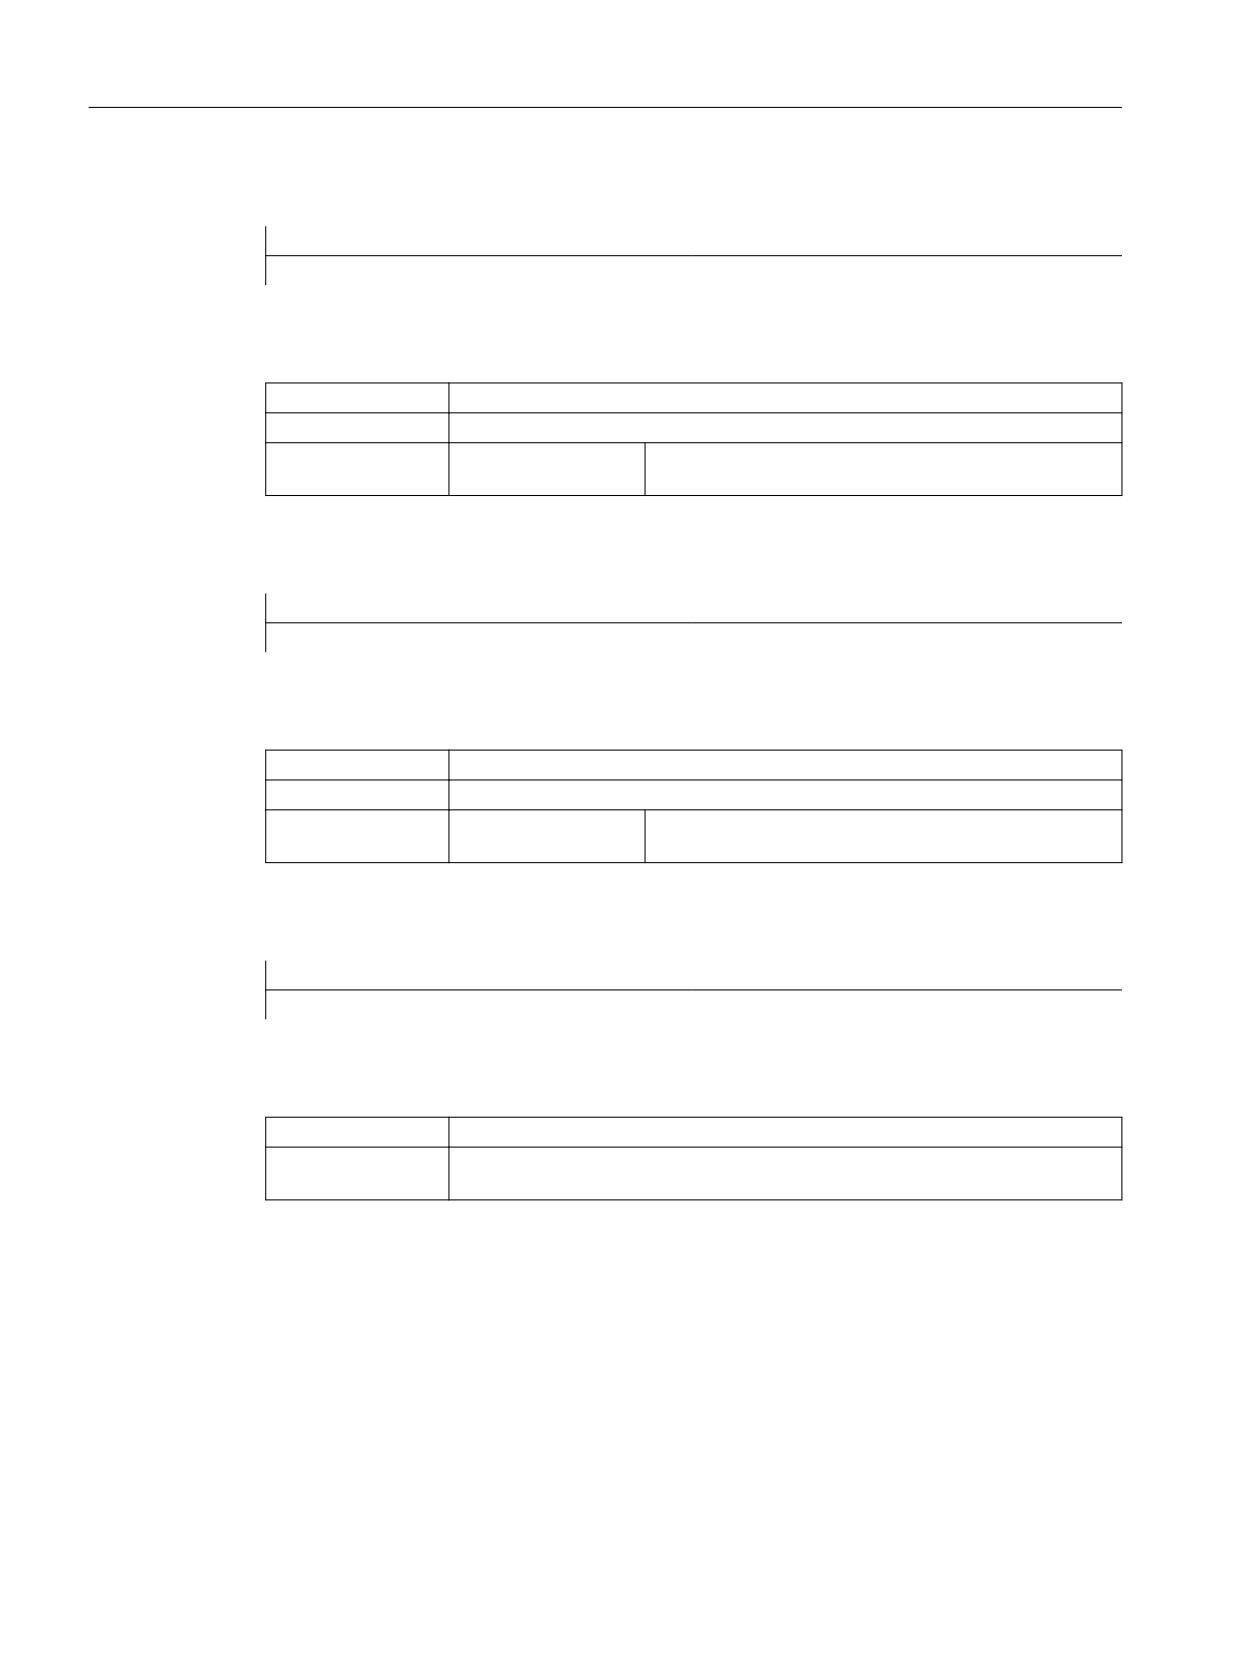
Example
REG[0]=STRREMOVE("Hello world!", 5, 6)
; Result = "Hello!")
TRIMLEFT function: Remove blanks from the left of the string
Syntax:
TRIMLEFT(string1)
Description:
TRIMLEFT removes blanks on the left from a character string.
Parameters:
string1
Character string from which blanks are to be removed
from the left of the character string
Example
REG[0]=TRIMLEFT("
Hello!")
; Result = "Hello!")
TRIMRIGHT function: Remove blanks from the right of the string
Syntax:
TRIMRIGHT(string1)
Description:
TRIMLEFT removes blanks on the right from a character string.
Parameters:
string1
Character string from which blanks are to be removed
from the right of the character string
Example
REG[0]=TRIMRIGHT("Hello!
")
; Result = "Hello!")
FORMAT function: Insert values or string with formatting identifier
Syntax:
FORMAT(Text with formatting identifier [, Value1] ... [, Value28] )
Description:
Through the use of formatting identifiers, the FORMAT function enables up to 28
values or strings to be inserted at specified positions in a specific text.
SINUMERIK Integrate Run MyScreens
194
Programming Manual, 10/2020, A5E40869575B AD
Programming commands
7.3 Functions
Formatting identifi-
Syntax
%[Flags] [Width] [.decimal places] type
ers:
Flags
Optional character for defining output formatting:
• Right-justified or left-justified ("-") for left-justified
• Add leading zeros ("0")
• default: Fill in with blanks if the value to be output has
fewer positions than specified with [Width].
Width
The argument defines the minimum output width for a non-
negative number. If the value has fewer positions than speci-
fied by the argument, the missing spaces are filled with
blanks.
Decimal places
With floating-point numbers, the optional parameter defines
the number of decimal places.
Type
The type character defines which data formats are transfer-
red to the print statement.
These characters need to be specified.
• d: Integer value
• f: Floating-point number
• s: String
• o: Octal
• x: Hexadecimal
• b: Binary
Example
DEF VAR1
DEF VAR2
LOAD
VAR1 = 123
VAR2 = FORMAT("Hello %08b %.2f %s!", VAR1 + 1, 987.654321, "world")
; Result = "Hello 01111100 987.65 world!"
END_LOAD
See also
Use of strings (Page 112)
7.3.37
WHILE/UNTIL loops
Description
A loop can be implemented with the DO LOOP commands. Depending on the configuration, it
is run through as long as a condition is satisfied (WHILE) or until a condition occurs (UNTIL).
SINUMERIK Integrate Run MyScreens
Programming Manual, 10/2020, A5E40869575B AD
195
Programming commands
7.3 Functions
As loops can impair the system performance, depending on the configuration, they should be
used carefully and without time-intensive actions in the loops.
It is recommended that a register (REG[]) be used as run variable, because normal display
variables (particularly those with system or user variables connection) also impair the system
performance due to the frequent updates or write operations.
The runtime of "Run MyScreens" methods can be determined with the DEBUG function (see
Section DEBUG (Page 158)). Problems caused by loops (high CPU load, reduced response
capability) may be identified in this way.
Note
As each FOR loop can be replaced by a WHILE loop, the syntax to formulate a FOR loop is not
supported in EasyScreen.
Programming
DO
<instructions>
LOOP_WHILE <Condition to continue the loop>
DO
<instructions>
LOOP_UNTIL <Condition to terminate the loop>
DO_WHILE <Condition to continue the loop>
<instructions>
LOOP
DO_UNTIL <Condition to terminate the loop>
<instructions>
LOOP
Example
REG[0] = 5
DO
DEBUG("OUTER: " << REG[0])
REG[0] = REG[0] + 1
REG[1] = -5
DO
DEBUG("INNER: " << REG[1])
SINUMERIK Integrate Run MyScreens
196
Programming Manual, 10/2020, A5E40869575B AD
Programming commands
7.3 Functions
REG[1] = REG[1] + 1
LOOP_WHILE REG[1] < 0
LOOP_WHILE REG[0] < 10
REG[0] = 5
DO
DEBUG("OUTER: " << REG[0])
REG[0] = REG[0] + 1
REG[1] = -5
DO
DEBUG("INNER: " << REG[1])
REG[1] = REG[1] + 1
LOOP_UNTIL 0 <= REG[1]
LOOP_WHILE 10 > REG[0]
REG[0] = 5
DO_WHILE 10 > REG[0]
DEBUG("OUTER: " << REG[0])
REG[0] = REG[0] + 1
REG[1] = -5
DO_UNTIL 0 <= REG[1]
DEBUG("INNER: " << REG[1])
REG[1] = REG[1] + 1
LOOP
LOOP
REG[0] = 5
DO_WHILE 10 > REG[0]
DEBUG("OUTER: " << REG[0])
REG[0] = REG[0] + 1
REG[1] = -5
DO
DEBUG("INNER: " << REG[1])
SINUMERIK Integrate Run MyScreens
Programming Manual, 10/2020, A5E40869575B AD
197
Programming commands
7.3 Functions
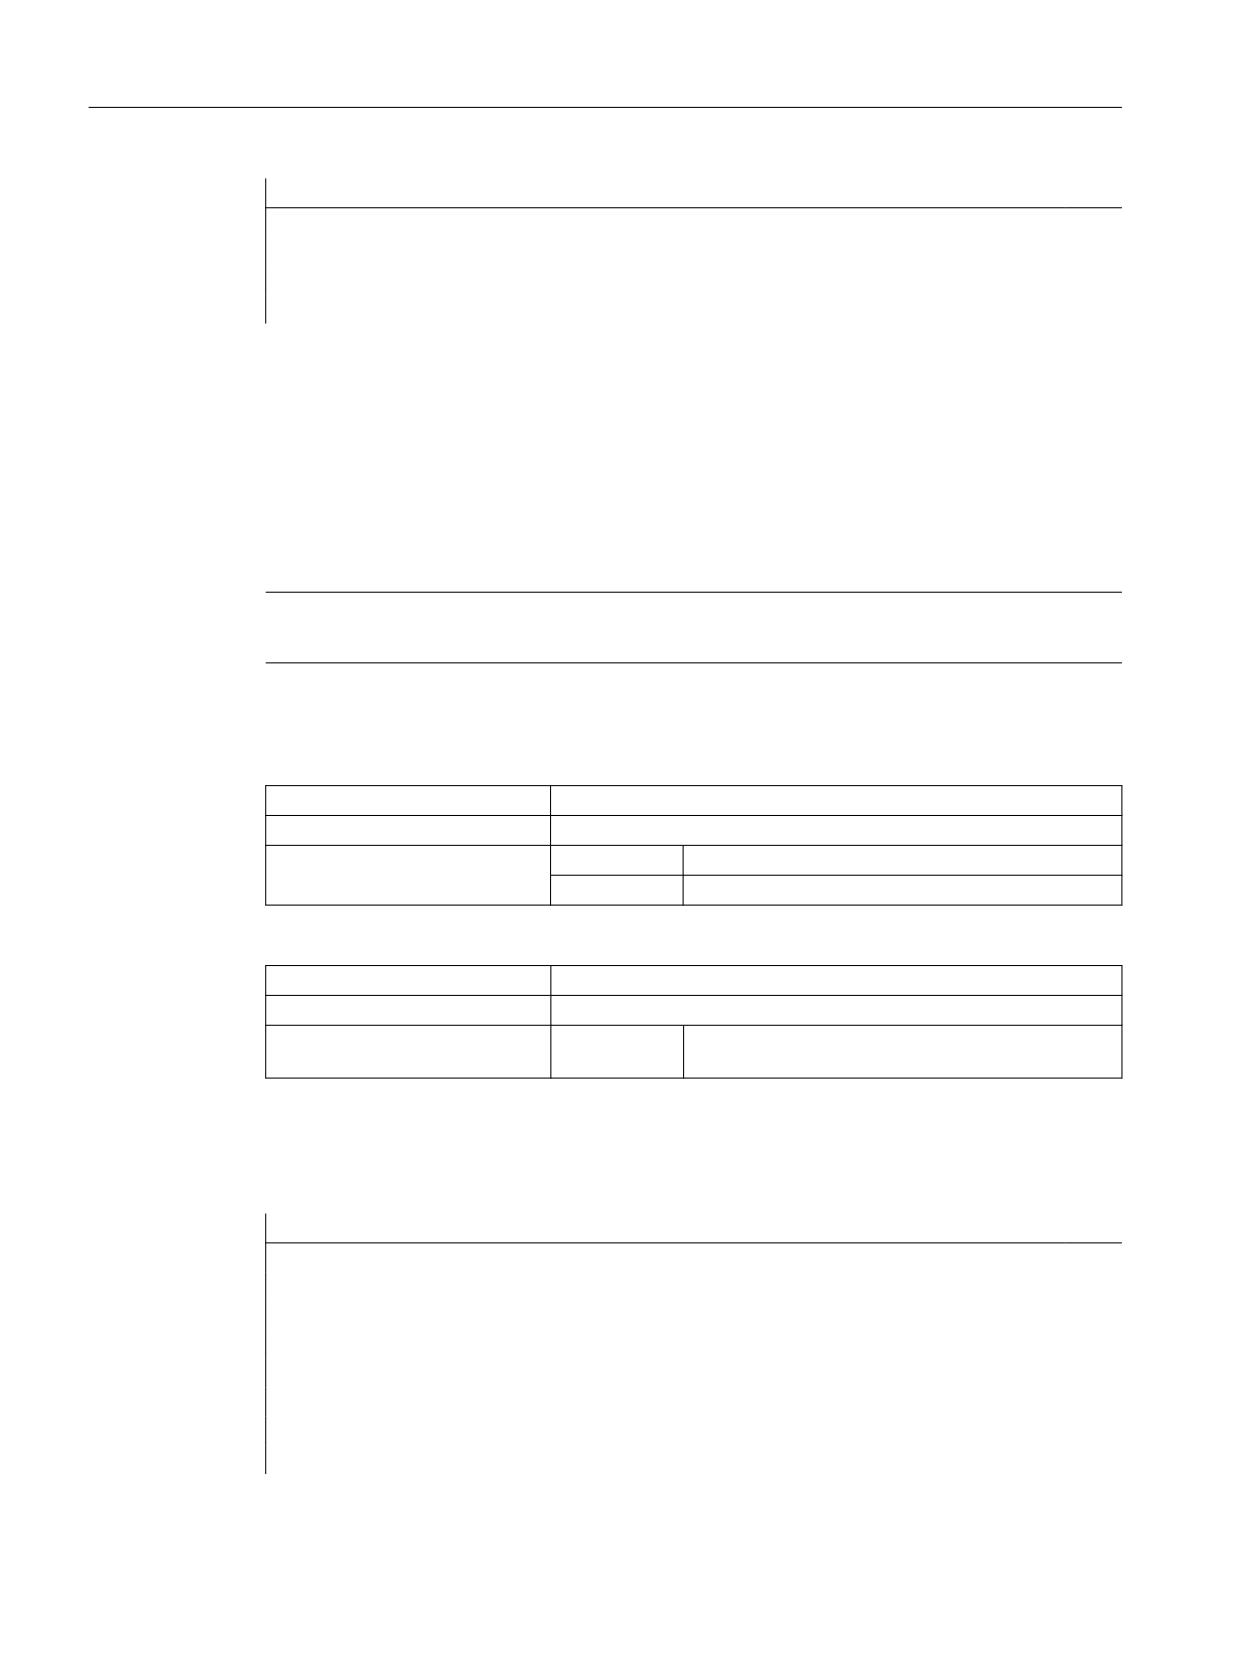
REG[1] = REG[1] + 1
LOOP_UNTIL 0 <= REG[1]
LOOP
7.3.38
Cyclic execution of scripts: START_TIMER, STOP_TIMER
Description
SUB methods can be called cyclically with the aid of timers. The START_TIMER() and
STOP_TIMER() functions are available for this purpose.
Note
Only one timer can be configured for each SUB method.
Programming
Syntax:
START_TIMER("SUB-Name", Interval)
Description:
Starts cyclic processing of a SUB method
Parameters:
SUB name:
Name of the SUB method to be called cyclically
Interval:
Interval in milliseconds
Syntax:
STOP_TIMER("SUB name", Interval)
Description:
Stops cyclic processing of a SUB method
Parameters:
SUB name:
Name of the SUB method whose timer is to be stop-
ped.
Example
//M(TimerSample/"My timer")
DEF MyVariable=(I//0/,"Number of cyclic calls:"/WR1)
VS1=("Start%ntimer")
VS2=("Stop%ntimer")
SUB(MyTimerSub)
MyVariable = MyVariable + 1
END_SUB
SINUMERIK Integrate Run MyScreens
198
Programming Manual, 10/2020, A5E40869575B AD
Programming commands
7.3 Functions
//M(TimerSample/"My timer")
PRESS(VS1)
;Calls SUB "MyTimerSub" every 1000 milliseconds
START_TIMER("MyTimerSub", 1000)
END_PRESS
PRESS(VS2)
STOP_TIMER("MyTimerSub")
END_PRESS
If START_TIMER is called again for a timer already assigned to a SUB method, then the new
interval is taken over if it is different. Otherwise, the second call is ignored.
The smallest interval for the system is100 milliseconds.
If STOP_TIMER is called for a SUB method for which no timer is currently running, the call is
ignored.
SINUMERIK Integrate Run MyScreens
Programming Manual, 10/2020, A5E40869575B AD
199
Programming commands
7.3 Functions
SINUMERIK Integrate Run MyScreens
200
Programming Manual, 10/2020, A5E40869575B AD
Graphic and logic elements
8
8.1
Line, dividing line, rectangle, circle and ellipse
Description
Lines, dividing lines, rectangles and ellipses/circles are configured in the LOAD method:
• Transparent rectangles are created by setting the fill color to the system backg36round color.
• With the ELLIPSE element, a circle is created by setting the height and the width to the same
value.
• Horizontal and vertical dividing lines always have the exact window width or window height.
No scrollbars are produced by dividing lines.
If you previously used the RECT element to display dividing lines, e.g.
RECT(305,0,1,370,0,0,1), this is detected by the Programming Support and automatically
converted to V_SEPARATOR(305,1,"#87a5cd", 1). This applies to both vertical and horizontal
dividing lines.
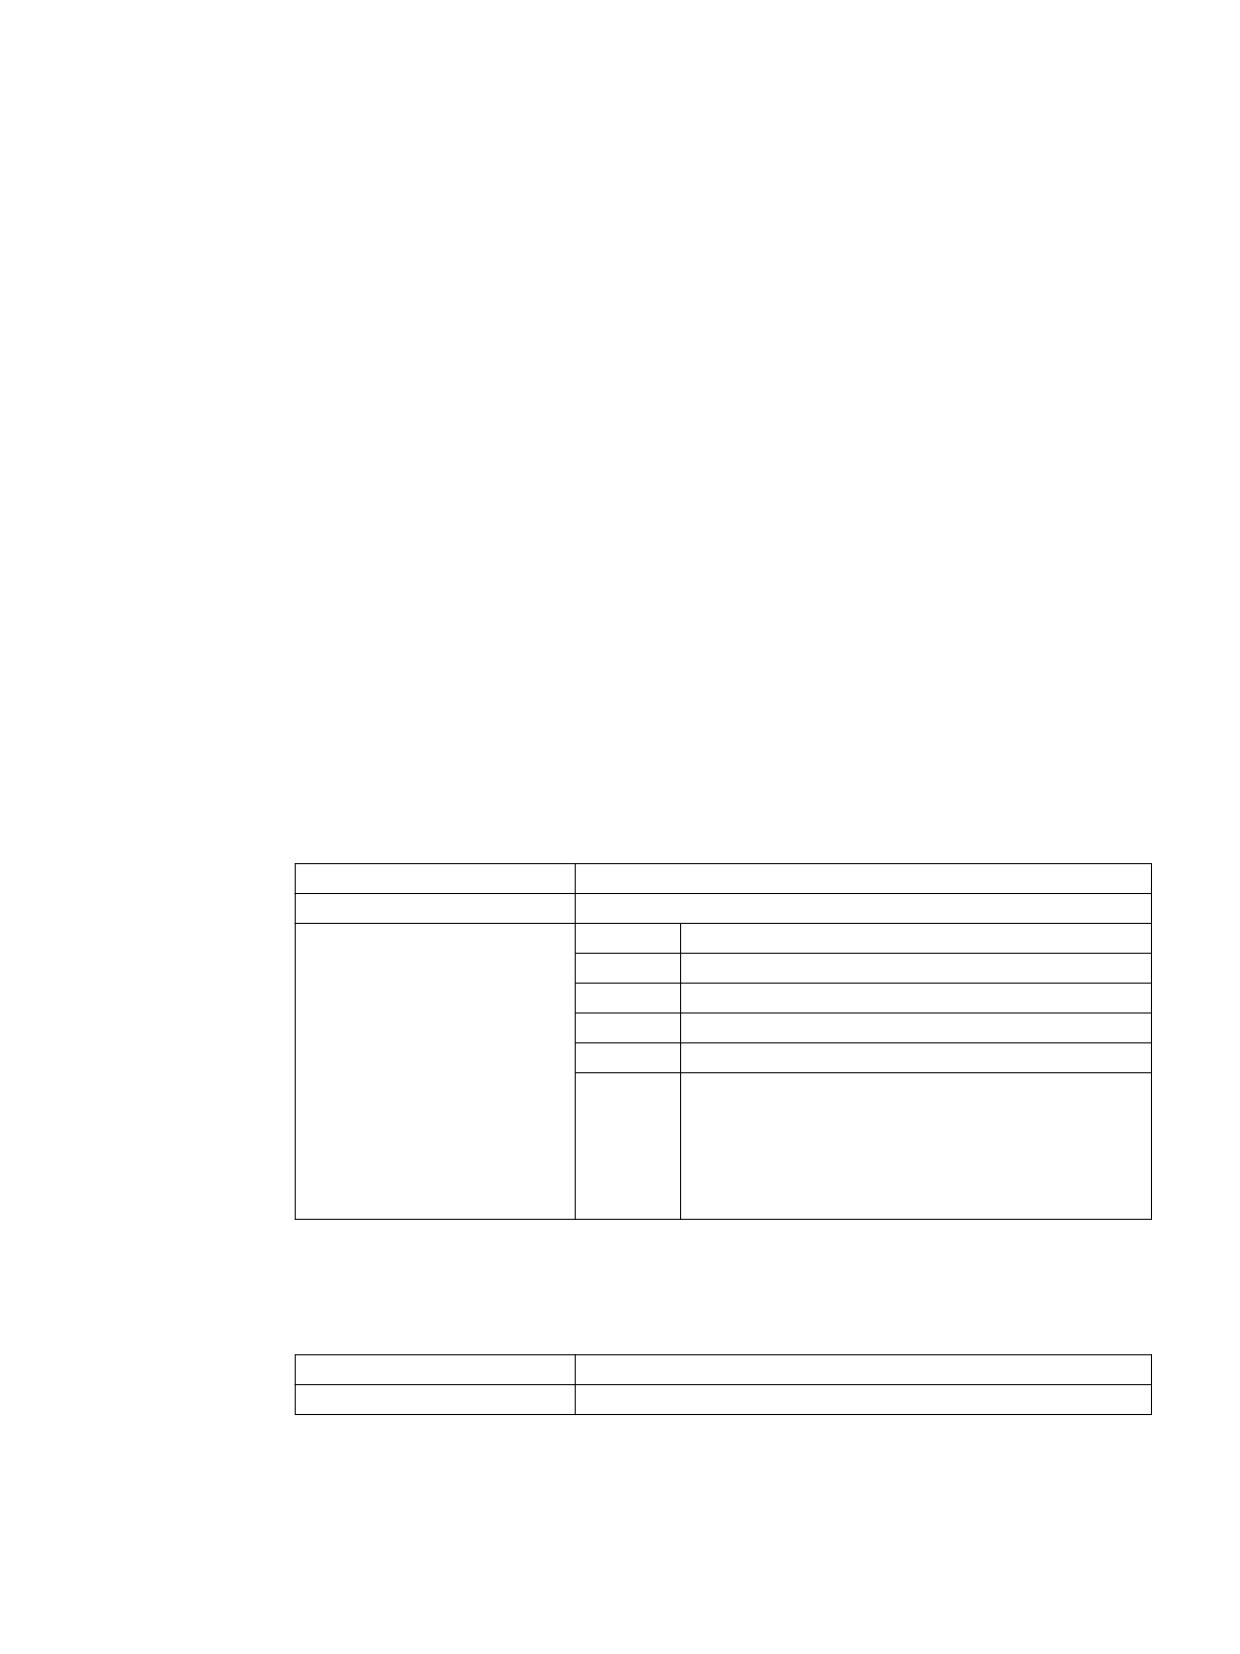
LINE element
Programming:
Syntax:
LINE (x1,y1,x2,y2,f,s)
Description:
Defines a line
Parameter:
x1
Start point x-coordinate
y1
Start point y-coordinate
x2
End point x-coordinate
y2
End point y-coordinate
f
Color of the line
s
Line style:
1 = solid
2 = dashed
3 = dotted
4 = dashed and dotted
RECT element
Programming:
Syntax:
RECT (x,y,w,h,f1,f2,s)
Description:
Defines a rectangle
SINUMERIK Integrate Run MyScreens
Programming Manual, 10/2020, A5E40869575B AD
201
Graphic and logic elements
8.1 Line, dividing line, rectangle, circle and ellipse
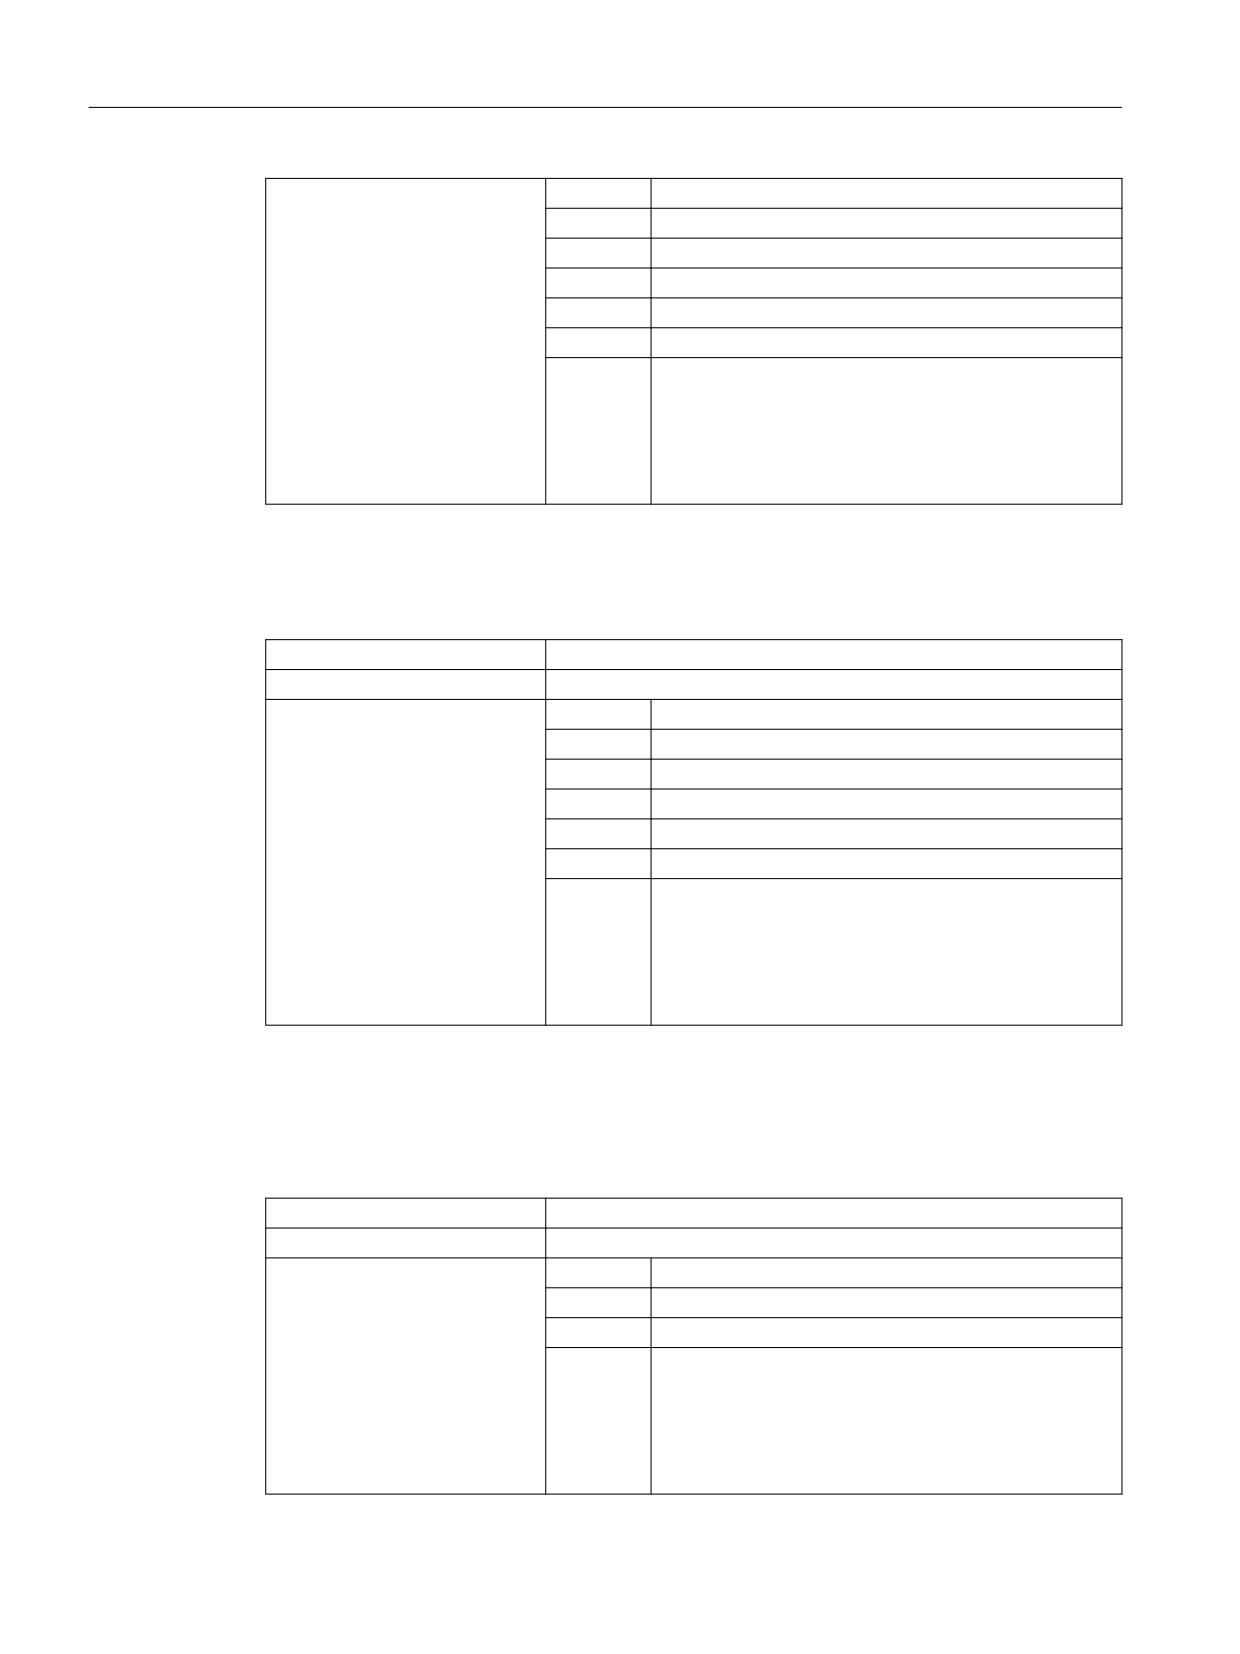
Parameter:
x
x-coordinate, top left
y
y-coordinate, top left
w
Width
h
Height
f1
Color of the border
f2
Fill color
s
Border style:
1 = solid
2 = dashed
3 = dotted
4 = dashed and dotted
ELLIPSE element
Programming:
Syntax:
ELLIPSE(x,y,w,h,f1,f2,s)
Description:
Defines an ellipse or circle
Parameter:
x
x-coordinate, top left
y
y-coordinate, top left
w
Width
h
Height
f1
Color of the border
f2
Fill color
s
Border style:
1 = solid
2 = dashed
3 = dotted
4 = dashed and dotted
A circle is created when the values for height and width are the same.
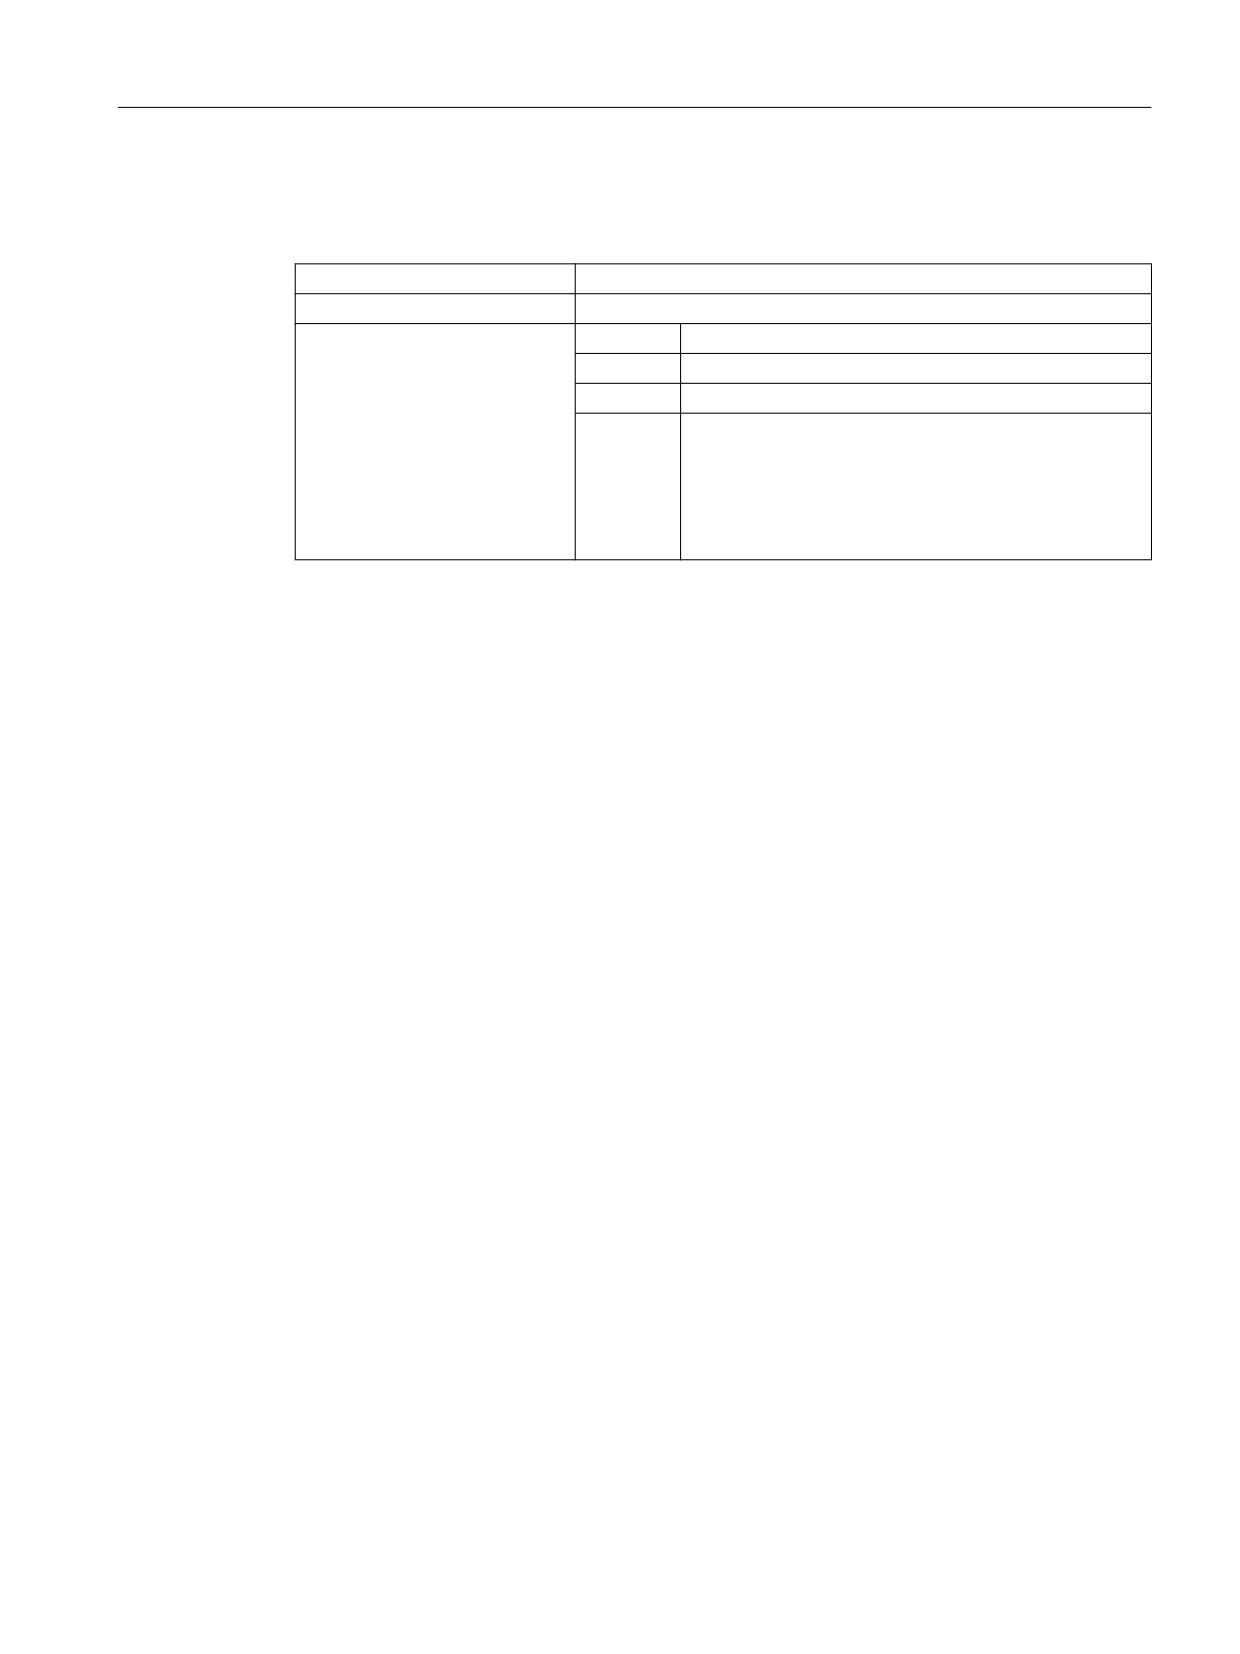
V_SEPARATOR element
Programming:
Syntax:
V_SEPARATOR (x,w,color,pen)
Description:
Defines a vertical dividing line
Parameter:
x
x position
w
Line weight
color
Color
pen
Line style:
1 = solid
2 = dashed
3 = dotted
4 = dashed and dotted
SINUMERIK Integrate Run MyScreens
202
Programming Manual, 10/2020, A5E40869575B AD
Graphic and logic elements
8.1 Line, dividing line, rectangle, circle and ellipse
H_SEPARATOR element
Programming:
Syntax:
H_SEPARATOR (y,h,color,pen)
Description:
Defines a horizontal dividing line
Parameter:
y
y position
h
Line weight
color
Color
pen
Line style:
1 = solid
2 = dashed
3 = dotted
4 = dashed and dotted
See also
LOAD (Page 136)
See also
CLEAR_BACKGROUND (Page 150)
SINUMERIK Integrate Run MyScreens
Programming Manual, 10/2020, A5E40869575B AD
203
Graphic and logic elements
8.2 Defining an array
8.2
Defining an array
Definition
An array can be used to organize data of the same data type stored in the memory in such a way
that it is possible to access the data via an index.
Description
Arrays can be one- or two-dimensional. A one-dimensional array is treated like a two-
dimensional array with just one line or column.
Arrays have start identifier //A and end identifier //END. The number of lines and columns is
optional. An array is structured in the following way:
Programming
Syntax:
//A(Identifier)
(a/b...)
(c/d...)
//END
Description:
Defines array
Parameters:
Identifier
Name of array
a, b, c, d
Values of array
Values of the STRING type must be enclosed in double quota-
tion marks.
Example
//A(Thread)
; Size/lead/core diameter
(0.3 / 0.075 / 0.202)
(0.4 / 0.1
/ 0.270)
(0.5 / 0.125 / 0.338)
(0.6 / 0.15
/ 0.406)
(0.8 / 0.2
/ 0.540)
(1.0 / 0.25
/ 0.676)
(1.2 / 0.25
/ 0.676)
(1.4 / 0.3
/ 1.010)
(1.7 / 0.35
/ 1.246)
//END
SINUMERIK Integrate Run MyScreens
204
Programming Manual, 10/2020, A5E40869575B AD
Graphic and logic elements
8.2 Defining an array
8.2.1
Accessing the value of an array element
Description
The value of an array access operation can be transferred with property Value (identifier.val).
The line index (line number of the array) and the column index (column number of the array)
each begin at 0. If a line index or column index is outside the array, the value 0 or a blank string
is output and the ERR variable is set to TRUE. Variable ERR is also set to TRUE if a search concept
cannot be found.
Programming
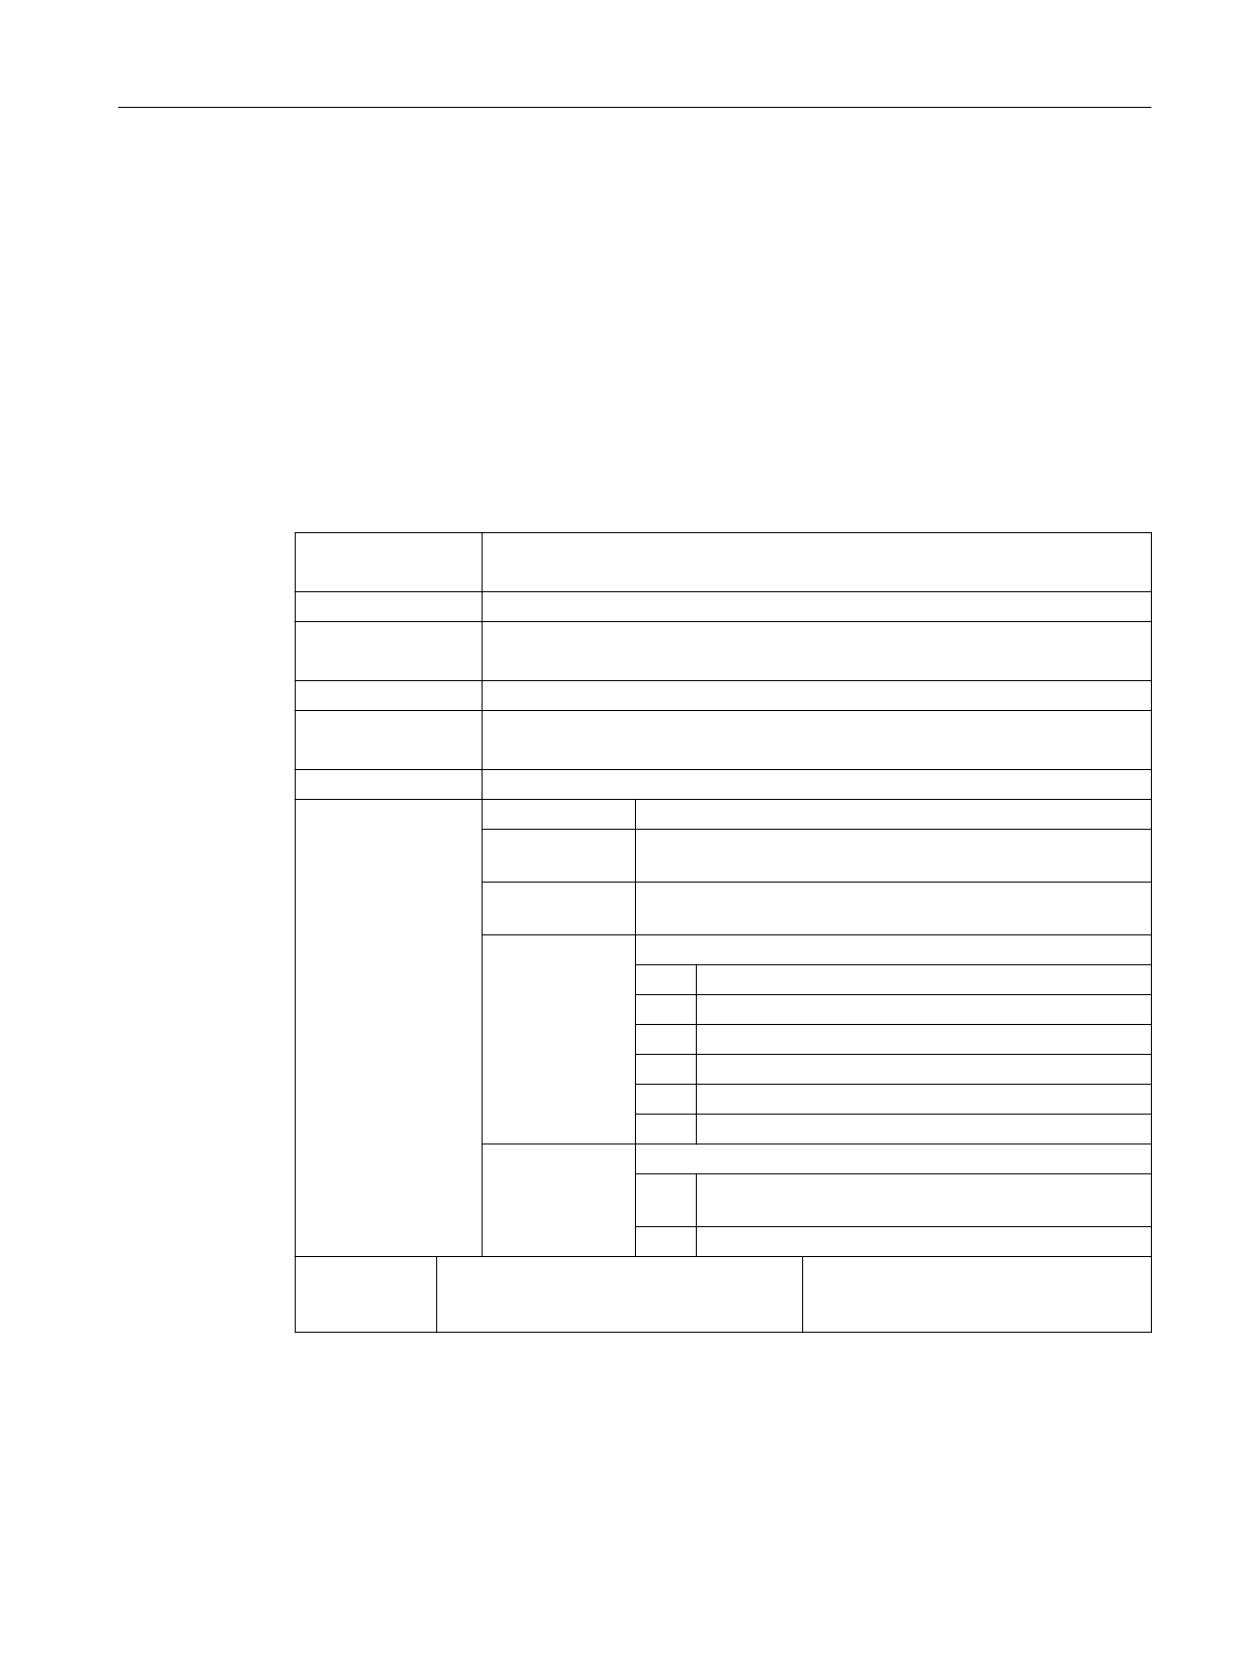
Syntax:
Identifier [Z,[M[,C]]].val or
Identifier [Z,[M[,C]]]
Description:
Access to one-dimensional array with only one column
Syntax:
Identifier [S,[M[,C]]].val] or
Identifier [S,[M[,C]]] or
Description:
Access to one-dimensional array with only one line
Syntax:
Identifier [Z,S,[M[,C]]].val or
Identifier [Z,S,[M[,C]]]
Description:
Access to two-dimensional array
Parameters:
Identifier:
Name of array
Z:
Line value (line index or search concept)
S:
Column value (column index or search concept)
M:
Access mode
0
Direct
1
Searches the line, column directly
2
Searches the column, line directly
3
Searches
4
Searches line index
5
Searches column index
C:
Compare mode
0
Search concept must be located in the range of values
of the line or column.
1
Search concept must be located exactly.
Example:
VAR1 = MET_G[REG[3],1,0].VAL
;Assign Var1 a value from
array MET_G
SINUMERIK Integrate Run MyScreens
Programming Manual, 10/2020, A5E40869575B AD
205
Graphic and logic elements
8.2 Defining an array
Access mode
• "Direct" access mode
With "Direct" access mode (M = 0), the array is accessed with the line index in Z and the
column index in S. Compare mode C is not evaluated.
• "Search" access mode
In the case of access mode M = 1, 2 or 3, the search always commences in line 0 or column
0.
Mode M
Line value Z
Column value S
Output value
0
Line index
Column index
Value from line Z and column
S
1
Search concept:
Column index of column
Value from line found and
from which value is read
column S
Search in column 0
2
Line index of line from
Search concept:
Value from line Z and column
found
which return value is read Search in line 0
3
Search concept:
Search concept:
Value from line and column
found
Search in column 0
Search in line 0
4
Search concept:
Column index of search col-
Line index
umn
Search in column S
5
Line index of search line.
Search concept:
Column index
Search in line Z
Compare mode
When compare mode C = 0 is used, the content of the search line or search column must be
sorted in ascending order. If the search concept is smaller than the first element or greater than
the last, the value 0 or a blank string is output and the error variable ERR is set to TRUE.
When compare mode C = 1 is used, the search concept must be present in the search line or
search column. If the search concept cannot be found, the value 0 or a blank string is output and
the error variable ERR is set to TRUE.
8.2.2
Example Access to an array element
Prerequisite
Two arrays are defined below. These are the basis for the following examples:
//A(Thread)
(0.3 / 0.075 / 0.202)
(0.4 / 0.1
/ 0.270)
(0.5 / 0.125 / 0.338)
(0.6 / 0.15
/ 0.406)
(0.8 / 0.2
/ 0.540)
SINUMERIK Integrate Run MyScreens
206
Programming Manual, 10/2020, A5E40869575B AD
Graphic and logic elements
8.2 Defining an array
(1.0 / 0.25
/ 0.676)
(1.2 / 0.25
/ 0.676)
(1.4 / 0.3
/ 1.010)
(1.7 / 0.35
/ 1.246)
//END
//A(Array2)
("DES" /
"PTCH" /
"CDM" )
(0.3 /
0.075 /
0.202 )
(0.4 /
0.1 /
0.270 )
(0.5 /
0.125 /
0.338 )
(0.6 /
0.15 /
0.406 )
(0.8 /
0.2 /
0.540 )
(1.0 /
0.25 /
0.676 )
(1.2 /
0.25 /
0.676 )
(1.4 /
0.3 /
1.010 )
(1.7 /
0.35 /
1.246 )
//END
Examples
• Access mode example 1:
The search concept is in Z. This key is always sought in column 0. The value from column S
is output with the line index of the concept found.
VAR1 = Thread[0.5,1,1]
;VAR1 has the value 0.125
Explanation:
Search for value 0.5 in column 0 of "Thread" array and output the value found in column 1 of
the same line.
• Access mode example 2:
The search concept is in S. This concept is always searched for in line 0. The value from line
Z is output with the column index of the concept found:
VAR1 = ARRAY2[3,"PTCH",2]
;VAR1 has the value 0.125
Explanation:
Search for column containing "PTCH" in line 0 of array "Array2". Output the value from the
column found and the line with index 3.
• Access mode example 3:
A search concept is in each of Z and S. The line index is searched for in column 0 with the
concept in Z and the column index in line 0 with the concept in S. The value from the array
is output with the line index and column index found:
VAR1 = ARRAY2[0.6,"PTCH",3]
;VAR1 has the value 0.15
Explanation:
Search for the line with the content 0.6 in column 0 of array "Array2", search for the column
with the content "STG" in line 0 of Array2. Transfer the value from the line and column found
to VAR1.
SINUMERIK Integrate Run MyScreens
Programming Manual, 10/2020, A5E40869575B AD
207
Graphic and logic elements
8.2 Defining an array
• Access mode example 4:
The search concept is in Z. S contains the column index of the column in which concept is
being searched for. The line index of the concept found is output:
VAR1 = Thread[0.125,1,4]
;VAR1 has the value 2
Explanation:
Search for value 0.125 in column 1 of array "Thread" and transfer the line index of the value
found to VAR1.
• Access mode example 5:
Z contains the line index of line in which concept is being searched for. The search concept
is in S. The column index of the concept found is output:
VAR1 = Thread[4,0.2,5,1] ;VAR1 has the value 1
Explanation:
Search in line 4 of the "Thread" array for the value 0.2 and transfer the column index of the
value found to VAR1. Comparison mode 1 was selected because the values of line 4 are not
sorted in ascending order.
8.2.3
Scanning the status of an array element
Description
The Status property can be used to run a scan to find out whether an array access operation is
supplying a valid value.
Programming
Syntax:
Identifier [Z, S, [M[,C]]].vld
Description:
The property can only be read.
Parameters:
Identifier
Name of array
Return Value:
FALSE = invalid value
TRUE = valid value
Example
DEF MPIT = (R///"MPIT",,"MPIT",""/wr3)
DEF PIT
= (R///"PIT",,"PIT",""/wr3)
PRESS(VS1)
MPIT = 0.6
IF MET_G[MPIT,0,4,1].VLD == TRUE
PIT
= MET_G[MPIT,1,0].VAL
REG[4] = PIT
REG[1] = "OK"
ELSE
REG[1] = "ERROR"
SINUMERIK Integrate Run MyScreens
208
Programming Manual, 10/2020, A5E40869575B AD
Graphic and logic elements
8.2 Defining an array
ENDIF
END_PRESS
SINUMERIK Integrate Run MyScreens
Programming Manual, 10/2020, A5E40869575B AD
209
Graphic and logic elements
8.3 Table description (grid)
8.3
Table description (grid)
Definition
In contrast to the array, the values of a table (grid) are continually updated. It is a tabular display
of values that can come from the NC or PLC. The table is organized in columns and always has
variables of the same type in one column.
Assignment
The reference to a table description is performed in the variables definition:
• The variables definition determines the values to be displayed, and the definition of table
elements determines the appearance and arrangement on the screen window. The
properties of the input/output fields from the definition line of the variables are taken over in
the table.
• The visible area of the table is determined by the width and height of the input/output field.
Any lines or columns than cannot be seen can be displayed by scrolling horizontally and
vertically.
Table identifiers
Identifiers of a table containing NCK or PLC values of the same type, which can be addressed via
a channel block. The table identifier is differentiated from limits or toggle fields by the addition
of a % sign in front of it. The file containing the table description can be specified by adding a
comma after the identifier and then inserting the name of the file.
Identifier of a table for values of the same type, e.g. from the NCK or PLC. The table identifier is
specified at the position at which the limit values or the toggle field are configured. The table
identifier starts with a leading % character. This can be followed by a file name with a comma as
separator. It specifies the file in which the table description is defined. Per default, the table is
sought in the configuration file in which the screen is configured.
A table definition can also be loaded dynamically, e.g. in the LOAD method via the Load Grid (LG)
function.
System or user variable
This parameter remains empty for tables because the column definition lines contain detailed
information about the variables to be displayed. The table description can be provided
dynamically.
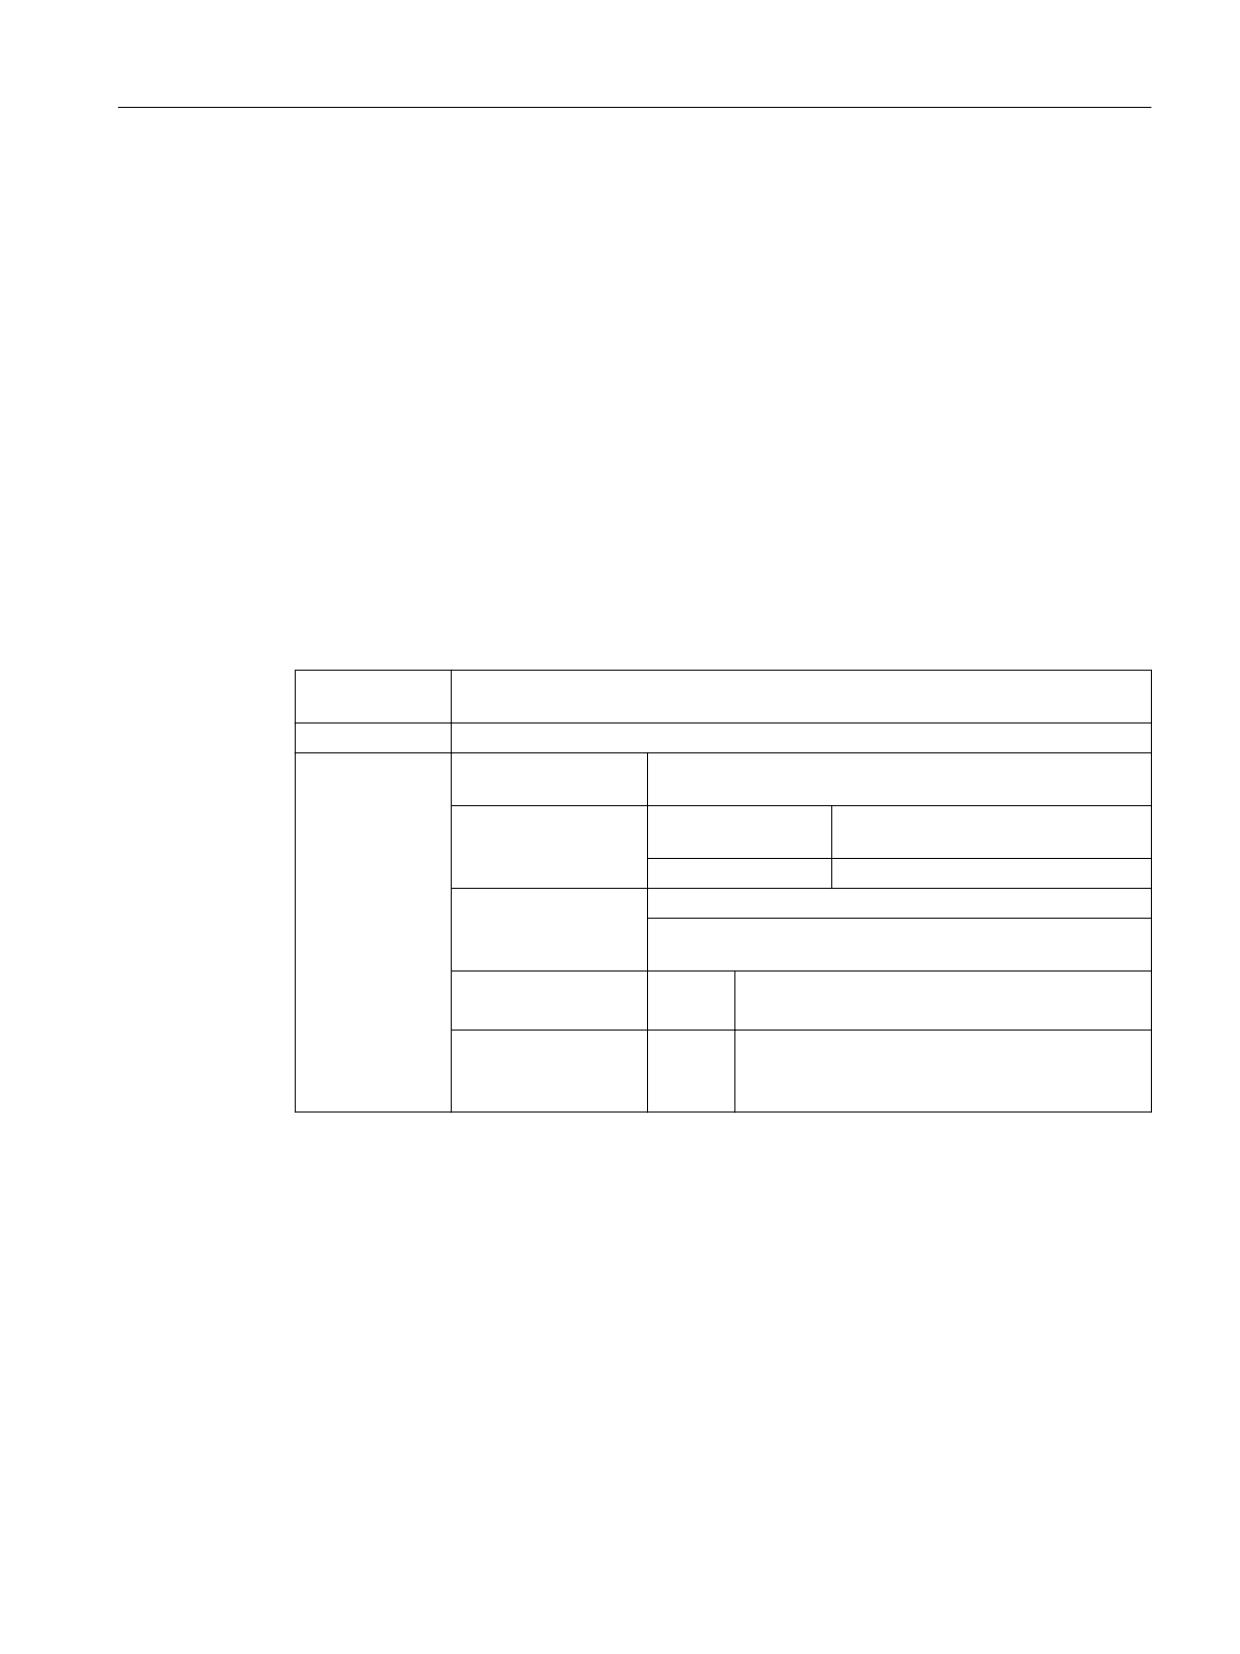
Example
Definition of a MyGridVar variable which displays a "MyGrid1" grid in its input/output field
(distance from left: 100, distance from top: Standard, width: 350, height: 100).
DEF MyGridVar=(V/% MyGrid1///////100,,350,100)
SINUMERIK Integrate Run MyScreens
210
Programming Manual, 10/2020, A5E40869575B AD
Graphic and logic elements
8.3 Table description (grid)
See also
Parameters of variables (Page 98)
Load Grid (LG) (Page 175)
8.3.1
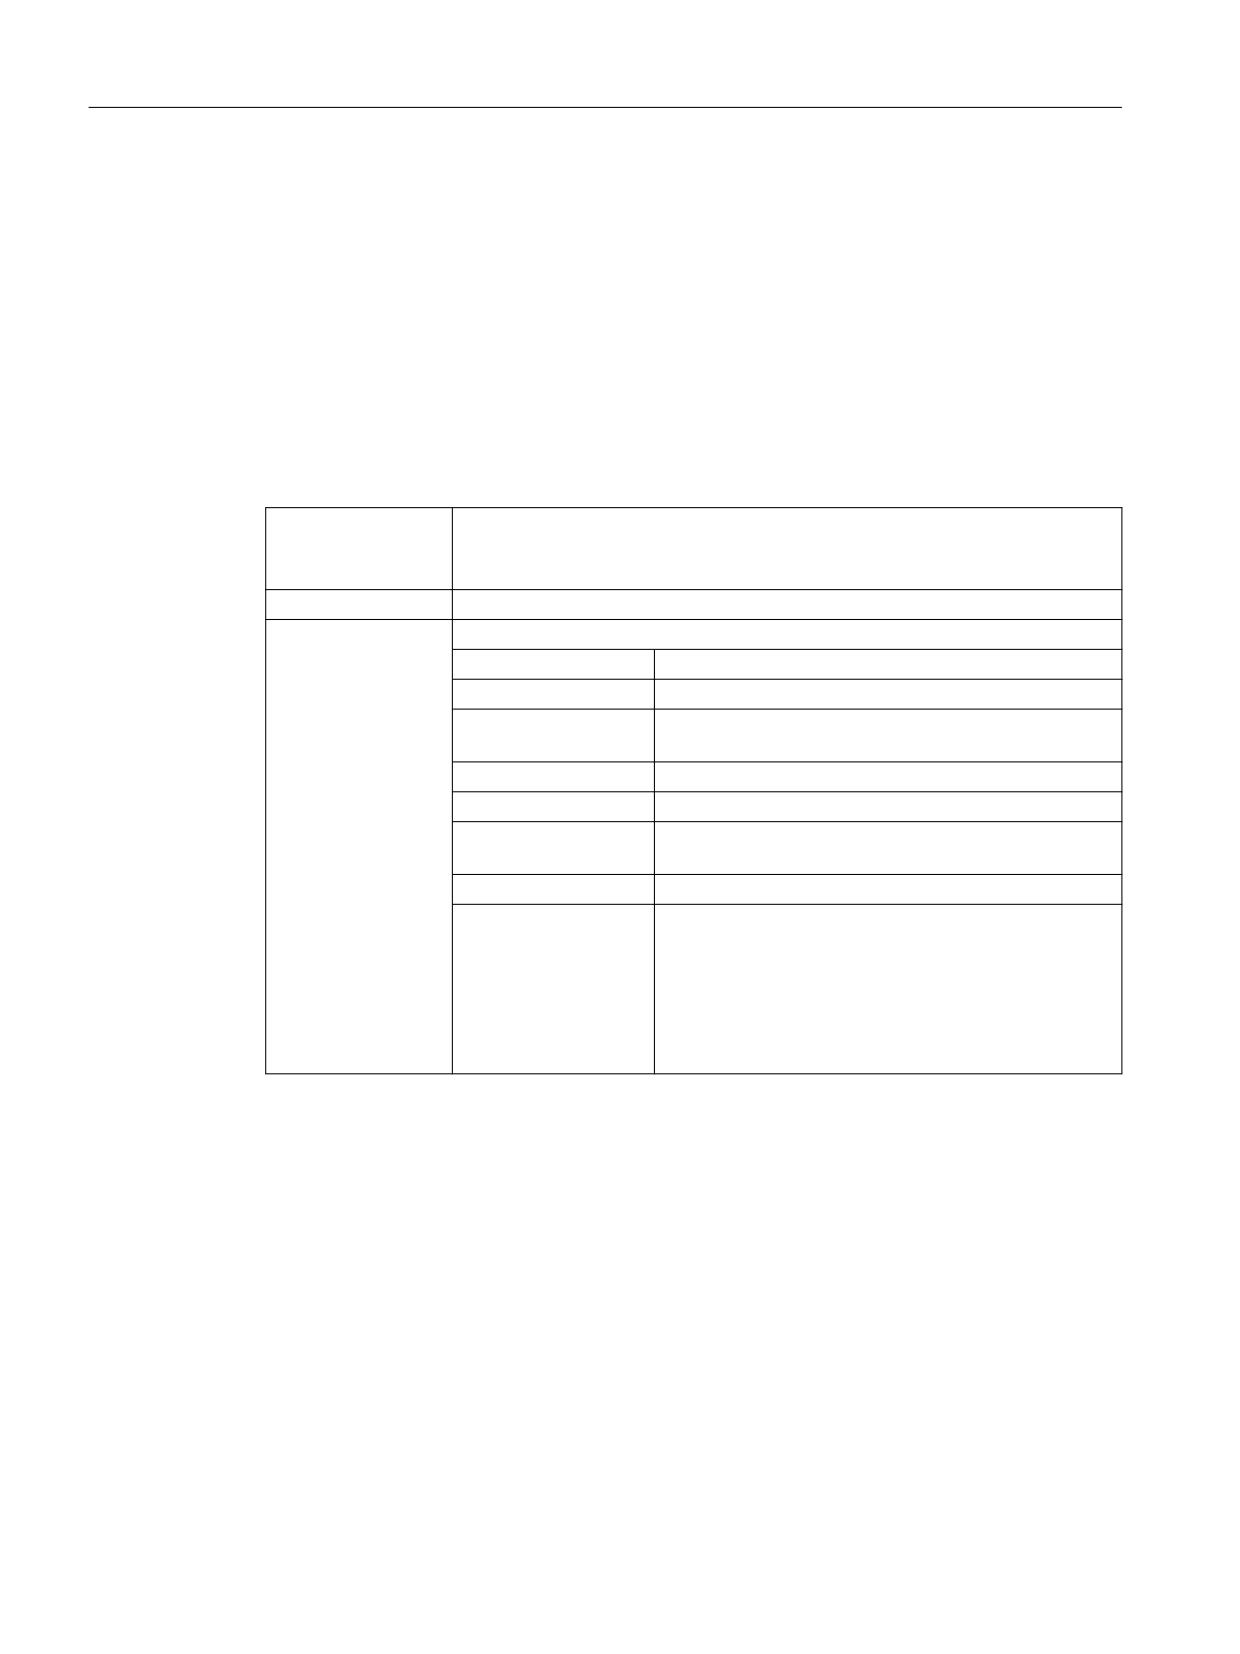
Defining a table (grid)
Description
The table block comprises:
• Header
•
1 to n column descriptions
Programming
Syntax:
//G(table identifier/table type/number of rows/
[attribute fixed row],[attribute fixed column])
Description:
Defines a table (grid)
Parameters:
Table identifier
The table identifier is used without a leading % sign. It can
only be used once in a dialog.
Table type
0 (default)
Table for PLC or user data (NCK- and
channel-specific data)
1
and others, reserved
Number of lines
Number of lines including header
The fixed line or fixed column is not scrolled. The number of
columns is the number of columns configured.
Display of column
-1:
The column header line is not displayed
header line
0:
The column header line is displayed (default)
Number of fixed col-
0:
No fixed column
umns
1 ... n:
Number of columns that are to be permanently
visible, i.e. not scrolled horizontally
Examples
//G(grid1/0/5/-1,2)
Column header line is hidden and two fixed
columns
//G(grid1/0/5/,1)
Column header line is displayed and one fixed
column
//G(grid1/0/5)
Column header line is displayed and no fixed
columns
SINUMERIK Integrate Run MyScreens
Programming Manual, 10/2020, A5E40869575B AD
211
Graphic and logic elements
8.3 Table description (grid)
8.3.2
Defining columns
Description
For tables (grids), it is advisable to use variables with an index. For PLC or NC variables, the index
number with one or more indices is of significance.
The values displayed in a table can be modified directly within the restrictions of the rights
granted by the attributes and within any defined limits.
Programming
Syntax:
(Type/Limits/Empty/Long text,column header/Attributes/Help display/
System or user variable/Column width/Offset1, Offset2, Offset3)
See also Extended configuration syntax (Page 49).
Description:
Defining columns
Parameters:
Similar to variables
Type
Data type
Limits
Limit value MIN, limit value MAX
Long text, column
header
Attributes
Help display
System or user variable
As variable, PLC or NC variables should be entered in
double quotation marks.
Column width
Entry in pixels.
Offset
The increment sizes to increment each index in order to
fill the column are specified in the assigned offset pa-
rameter:
• Offset1: Step width for the 1st index
• Offset2: Step width for the 2nd index
• Offset3: Step width for the 3rd index
Column header from text file
The column header can be entered as text or text number ($8xxxx) and is not scrolled.
Modifying column properties
The column properties which can be modified dynamically (written) are:
• Limits (min,max),
• Column header (st),
• Attributes (wr, ac and li),
• Help screens (hlp)
SINUMERIK Integrate Run MyScreens
212
Programming Manual, 10/2020, A5E40869575B AD
Graphic and logic elements
8.3 Table description (grid)
Column properties are modified via the variable identifier in the definition line and the column
index (starting at 1).
Example: VAR1[1].st="Column 1"
The wr, ac and li attributes can be specified for column definitions.
See also
Load Grid (LG) (Page 175)
8.3.3
Focus control in the table (cell)
Description
The Row and Col properties can be used to set and calculate the focus within a table:
• Identifier.Row
• Identifier.Col
Programming
Each cell in a table has the Val and Vld properties.
In order to read and write cell properties, a line and column index must be specified in addition
to the variable identifiers from the definition list.
Syntax:
Identifier[Line index, column index].val or
Identifier[Line index, column index]
Description:
Val properties
Syntax:
Identifier[Line index, column index].vld
Description:
Vld properties
Example
Var1[2,3].val=1.203
If the line and column indices are not specified, the indices of the focused cell apply. This
corresponds to:
Var1.Row =2
Var1.Col=3
Var1.val=1.203
SINUMERIK Integrate Run MyScreens
Programming Manual, 10/2020, A5E40869575B AD
213
Graphic and logic elements
8.4 Custom widgets
8.4
Custom widgets
8.4.1
Defining custom widgets
Description
User-specific display elements are configured in the dialog using a custom widget.
Software option
In order to use custom widgets in dialog boxes, you require the following additional
software option:
"SINUMERIK Integrate Run MyHMI /3GL" (6FC5800-0AP60-0YB0)
Programming
Definition:
DEF (name)
Syntax:
(W///"","(library name).(class name)"/////a,b,c,d);
Description:
W
Defining custom widgets
Parameters:
Name
Custom widget name, freely selectable
Library name
Can be freely selected, name of the dll (Windows) or (Li-
nux) library file
Class name
Freely selectable, name of the class function from the
previously named library
a, b, c, d
Position and size of the configuration
Example
A custom widget is defined in the dialog configuration in the following way:
DEF Cus = (W///"","slestestcustomwidget.SlEsTestCustomWidget"/////
20,20,250,100);
8.4.2
Structure of the custom widget library
Description
Essentially, the custom widget library contains a defined class. The name of this class must be
specified in the dialog configuration in addition to the library names. Starting from library
names, "Run MyScreens" accesses a dll file with the same name, e.g.:
slestestcustomwidget.dll
SINUMERIK Integrate Run MyScreens
214
Programming Manual, 10/2020, A5E40869575B AD
Graphic and logic elements
8.4 Custom widgets
Programming
The class definition of the dll file should look like this:
#define SLESTESTCUSTOMWIDGET_EXPORT Q_DECL_EXPORT
class SLESTESTCUSTOMWIDGET_EXPORT SlEsTestCustomWidget
: public QWidget
{
Q_OBJECT
public slots:
bool serialize(const QString& szFilePath, bool bIsStoring);
}
8.4.3
Structure of the custom widget interface
Description
The library is supplemented by an interface in order to display the custom widget in the dialog.
This contains macro definitions with which "Run MyScreens" initiates the custom widget. The
interface is available in the form of a cpp file. The file name can be freely selected, e.g.:
sleswidgetfactory.cpp
Programming
The interface is defined as follows:
#include "slestestcustomwidget.h"
; The header file for the relevant custom widg-
ets is inserted at the beginning of the file
//Makros
; Macro definitions are not changed
WIDGET_CLASS_EXPORT(SlEsTestCustom-
; The relevant custom widget is declared at
Widget)
the end of the file
Example
Content of the file sleswidgetfactory.cpp for a custom widget with the class name
SlEsTestCustomWidget":
#include <Qt/qglobal.h>
#include "slestestcustomwidget.h"
SINUMERIK Integrate Run MyScreens
Programming Manual, 10/2020, A5E40869575B AD
215
Graphic and logic elements
8.4 Custom widgets
///////////////////////////////////////////////////////////////////////////
// MAKROS FOR PLUGIN DLL-EXPORT - DO NOT CHANGE
///////////////////////////////////////////////////////////////////////////
#ifndef Q_EXTERN_C
#ifdef __cplusplus
#define Q_EXTERN_C
extern "C"
#else
#define Q_EXTERN_C
extern
#endif
#endif
#define SL_ES_FCT_NAME(PLUGIN) sl_es_create_ ##PLUGIN
#define SL_ES_CUSTOM_WIDGET_PLUGIN_INSTANTIATE( IMPLEMENTATION , PARAM) \
{ \
IMPLEMENTATION *i = new PARAM; \
return i; \
}
#ifdef Q_WS_WIN
#
ifdef Q_CC_BOR
#
define EXPORT_SL_ES_CUSTOM_WIDGET_PLUGIN(PLUGIN,PARAM) \
Q_EXTERN_C __declspec(dllexport) void* \
__stdcall SL_ES_FCT_NAME(PLUGIN) (QWidget* pParent) \
SL_ES_CUSTOM_WIDGET_PLUGIN_INSTANTIATE( PLUGIN,PARAM )
#
else
#
define EXPORT_SL_ES_CUSTOM_WIDGET_PLUGIN(PLUGIN,PARAM) \
Q_EXTERN_C __declspec(dllexport) void* SL_ES_FCT_NAME(PLUGIN) \
(QWidget* pParent) \
SL_ES_CUSTOM_WIDGET_PLUGIN_INSTANTIATE( PLUGIN,PARAM )
#
endif
#else
#
define EXPORT_SL_ES_CUSTOM_WIDGET_PLUGIN(PLUGIN,PARAM) \
Q_EXTERN_C void* SL_ES_FCT_NAME(PLUGIN) (QWidget* pParent) \
SL_ES_CUSTOM_WIDGET_PLUGIN_INSTANTIATE( PLUGIN,PARAM )
#endif
#define WIDGET_CLASS_EXPORT(CLASSNAME)
\
EXPORT_SL_ES_CUSTOM_WIDGET_PLUGIN(CLASSNAME,CLASSNAME(pParent))
///////////////////////////////////////////////////////////////////////////
// FOR OEM USER - please declare here your widget classes for export
///////////////////////////////////////////////////////////////////////////
SINUMERIK Integrate Run MyScreens
216
Programming Manual, 10/2020, A5E40869575B AD
Graphic and logic elements
8.4 Custom widgets
WIDGET_CLASS_EXPORT(SlEsTestCustomWidget)
8.4.4
Interaction between custom widget and dialog box - Automatic data exchange
Custom widgets interact with dialog boxes and can display values or manipulate them.
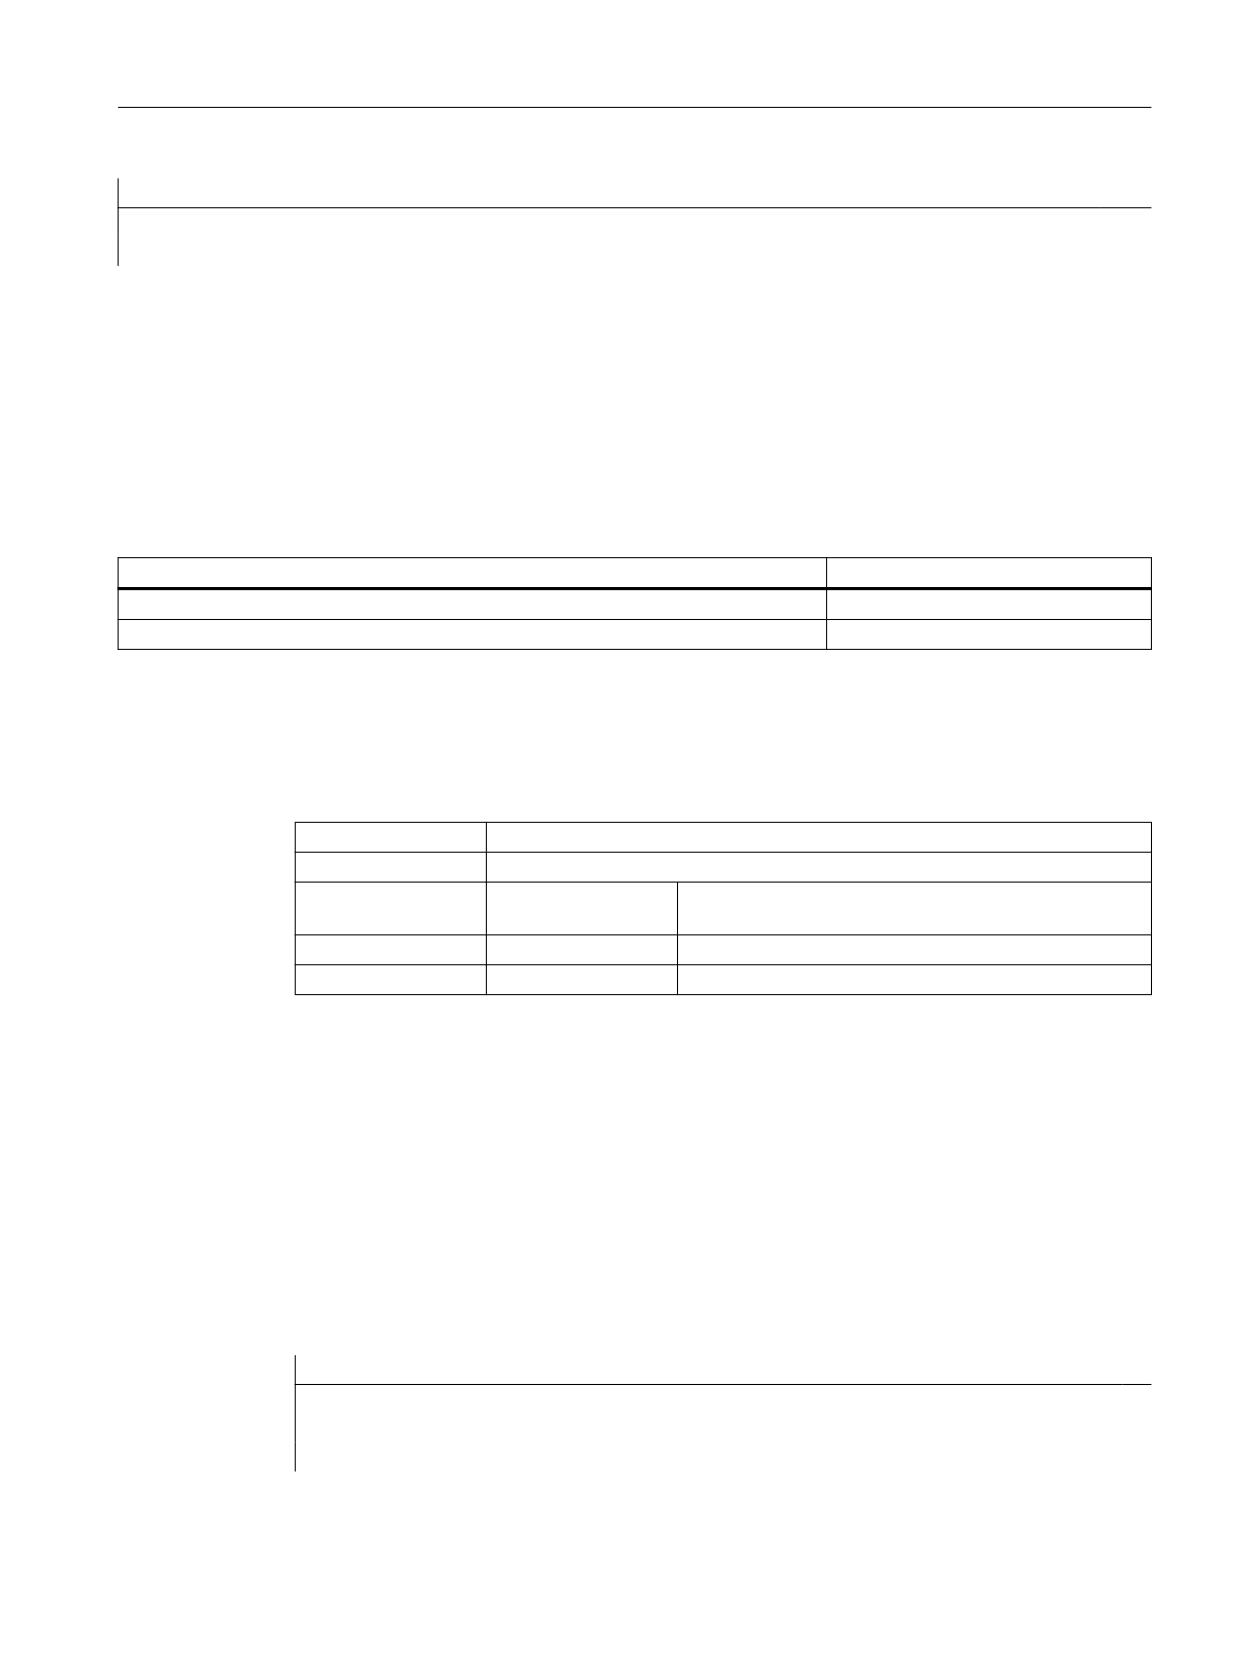
Conditions
Automatic data exchange takes place under the following conditions:
Condition
Direction
When starting or recompiling a dialog
Dialog → custom widget
When executing the GC command for generating cycle calls
Custom widget → Dialog
Programming
The following definitions are necessary for the interaction:
Expansion of the dialog configuration
Definition:
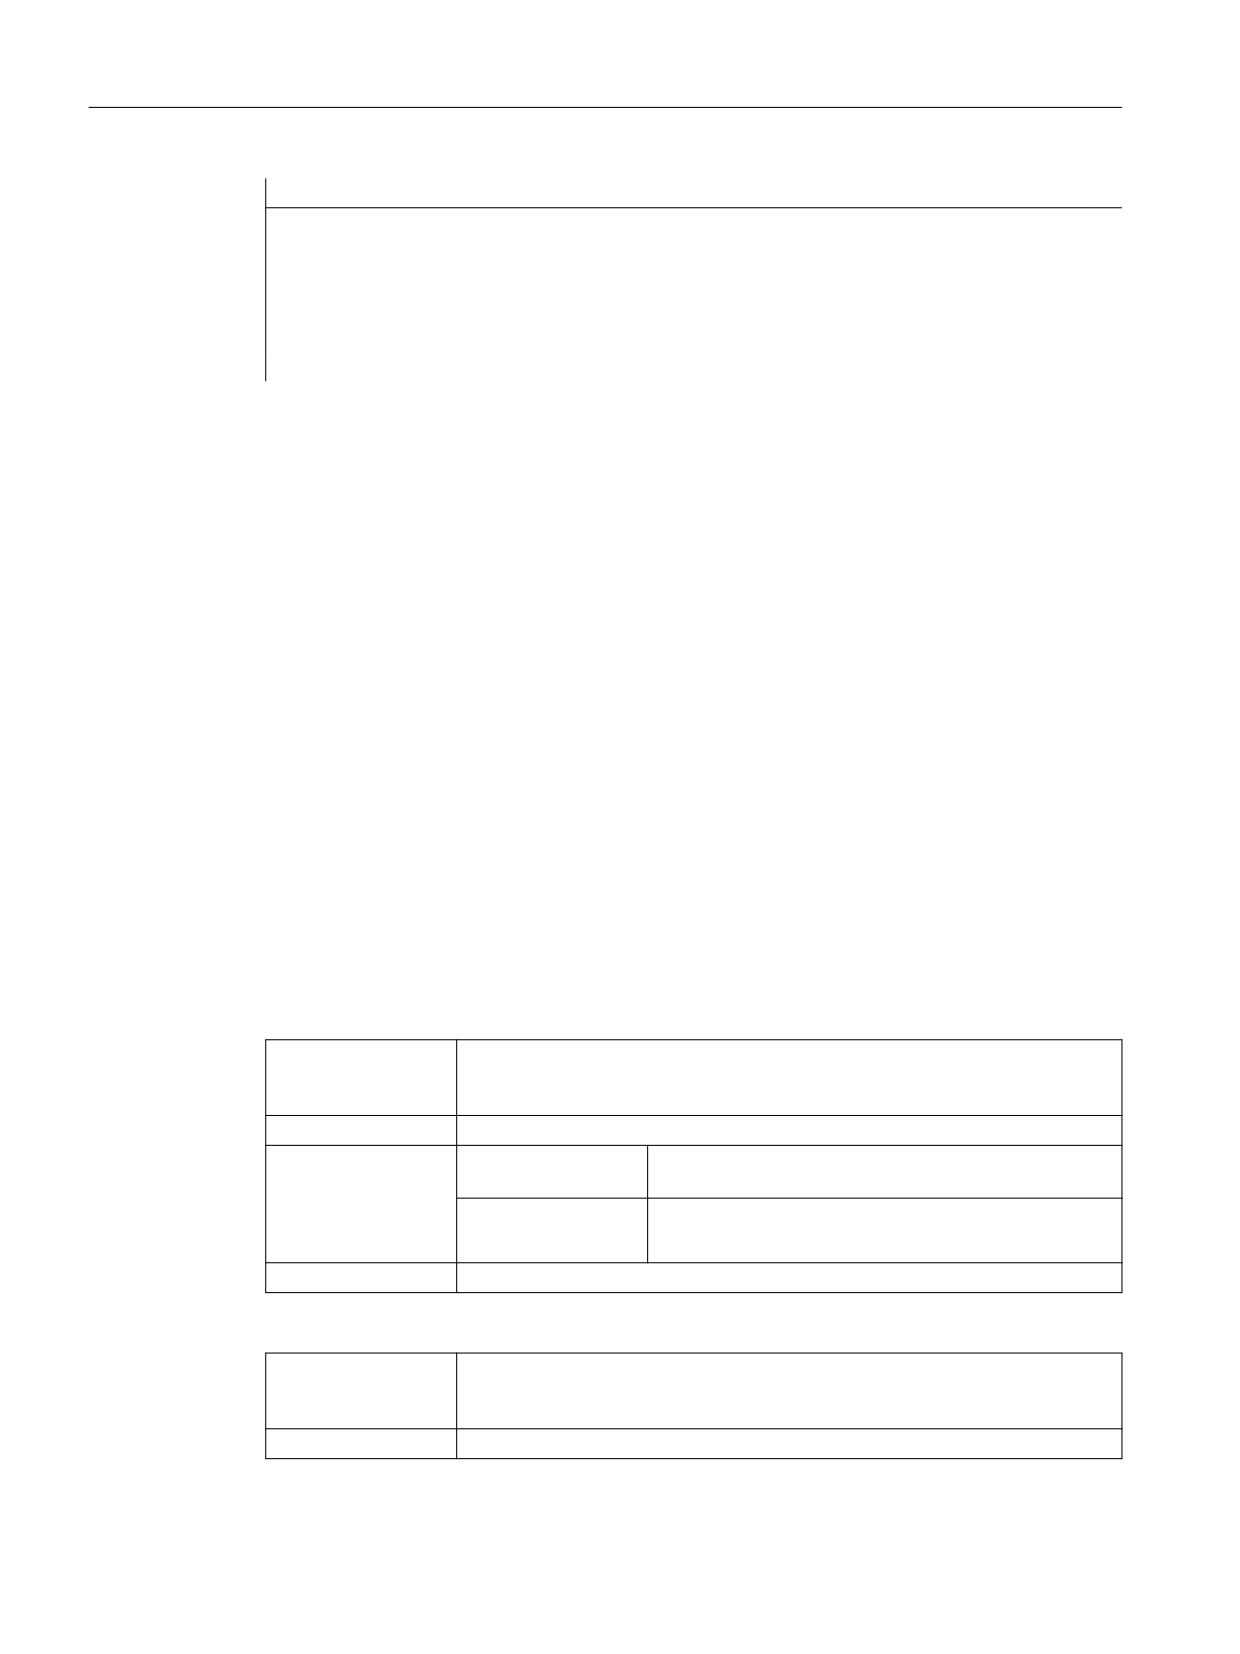
DEF (variable)
Syntax:
((type)//5/"","(variable)",""/wr2/)
Variable type:
Type
Standard input field (no grid or toggle) with any data type
(no W)
Parameters:
Variable
Any designation of a variable for data exchange
Input mode:
wr2
Reading and writing
Example
DEF CUSVAR1 = (R//5/"","CUSVAR1",""/wr2/)
Expansion of the class definition
In the class definition of the custom widgets, a QProperty must be created whose name is
identical to the selected variable of the dialog configuration, e.g.:
Q_PROPERTY(double CUSVAR1 READ cusVar1 WRITE setCusVar1);
Example
The class definition of the dll file should look like this:
#define SLESTESTCUSTOMWIDGET_EXPORT Q_DECL_EXPORT
class SLESTESTCUSTOMWIDGET_EXPORT SlEsTestCustomWidget
: public QWidget
SINUMERIK Integrate Run MyScreens
Programming Manual, 10/2020, A5E40869575B AD
217
Graphic and logic elements
8.4 Custom widgets
{
Q_OBJECT
Q_PROPERTY(double CUSVAR1 READ cusVar1
WRITE setCusVar1);
}
8.4.5
Interaction between custom widget and dialog box - Manual data exchange
Besides automatic data exchange, manual data exchange is also possible. Data exchange is
dynamic, i.e. takes place while the dialog box is running. The following actions are possible:
• Properties of the custom widget can be read and written.
• Methods of the custom widget can be called from the Run MyScreens configuration.
• A response to a particular signal of the custom widget can be implemented in order to call
subprograms (SUB) in the Run MyScreens configuration.
8.4.5.1
Reading and writing properties
Description
The functions ReadCWProperties and WriteCWProperties are provided in the Run MyScreens
configuration for reading and writing properties of the custom widgets.
Programming
Syntax:
ReadCWProperty("Variablename", "Propertyname")
Description:
Reading a property of a custom widget
Parameters:
Variablename
Name of a dialog box variable to which a custom widget
is assigned
Propertyname
Name of the custom widget property to be read
Return value:
Current value of the custom widget property
Syntax:
WriteCWProperty("Variablename", "Propertyname", "Value")
Description:
Writing the property of a custom widget
SINUMERIK Integrate Run MyScreens
218
Programming Manual, 10/2020, A5E40869575B AD
Graphic and logic elements
8.4 Custom widgets
Parameters:
Variable name
Name of a dialog box variable to which a custom widget
is assigned
Propertyname
Name of the custom widget property to be written
Value
Value to be written to the property of the custom widget
Examples
Example 1:
Read property "MyStringVar" of the custom widget that is linked to dialog box variable
"MyCWVar1" and assign the value to register 7.
Custom widget class declaration:
class SLESTESTCUSTOMWIDGET_EXPORT SlEsTestCustomWidget
: public QWidget
{
Q_OBJECT
Q_PROPERTY(QString MyStringVar
READ myStringVar
WRITE setMyStringVar);
Dialog box configuration:
DEF MyCWVar1 = (W///,"slestestcustomwidget.SlEsTestCustomWidget")
PRESS(VS1)
REG[7]=ReadCWProperty("MyCWVar1", "MyStringVar")
END_PRESS
Example 2:
Write the result of the calculation "3 + sin(123.456)" into property "MyRealVar" of the custom
widget that is linked to dialog box variable "MyCWVar1."
Custom widget class declaration:
class SLESTESTCUSTOMWIDGET_EXPORT SlEsTestCustomWidget
: public QWidget
{
Q_OBJECT
Q_PROPERTY(double MyRealVar
READ myRealVar
WRITE setMyRealVar);
Dialog box configuration:
DEF MyCWVar1 = (W///,"slestestcustomwidget.SlEsTestCustomWidget")
PRESS(VS1)
WriteCWProperty("MyCWVar1", "MyRealVar", 3 + sin(123.456))
SINUMERIK Integrate Run MyScreens
Programming Manual, 10/2020, A5E40869575B AD
219
Graphic and logic elements
8.4 Custom widgets
DEF MyCWVar1 = (W///,"slestestcustomwidget.SlEsTestCustomWidget")
END_PRESS
8.4.5.2
Executing a method of the custom widget
Description
The function CallCWMethod is available in the Run MyScreens configuration for executing
methods of the custom widget.
The custom widget method to be called must have no more than 10 transfer parameters.
The following transfer parameter data formats are supported:
• bool
• uint
• int
• double
• QString
• QByteArray
Programming
Syntax:
CallCWMethod("Variablename", "Methodname[, Argument 0][, Argument 1 …
[,Argument 9]")
Description:
Calling a custom widget method
Parameters:
Variable name
Name of a dialog box variable to which a custom widget
is assigned
Method name
Name of the custom widget name to be called
Argument 0 - 9
Transfer parameter for the custom widget method
Supported data formats: see above
Note: The transfer parameters are always transferred
with "ByVal," i.e. only the value is transferred and not, for
example, the reference to a variable.
Return value:
Return value of the custom widget method
The following transfer parameter data formats are supported:
• void
• bool
• uint
• int
• double
• QString
• QByteArray
Note: Even if the data format of the return value of the custom widget method
is "void," it must be formally assigned to a variable, for example.
SINUMERIK Integrate Run MyScreens
220
Programming Manual, 10/2020, A5E40869575B AD
Graphic and logic elements
8.4 Custom widgets
Example
Custom widget class declaration:
class SLESTESTCUSTOMWIDGET_EXPORT SlEsTestCustomWidget
: public QWidget
{
Q_OBJECT
public slots:
void myFunc1(int nValue, const QString& szString, double dValue);
Dialog box configuration:
DEF MyCWVar1 = (W///,"slestestcustomwidget.SlEsTestCustomWidget")
DEF MyStringVar1 = (S)
DEF MyRealVar = (R)
PRESS(VS3)
REG[9] = CallCWMethod("MyCWVar1", "myFunc1", 1+7, MyStringVar1, sin(MyRealVar) -
8)
END_PRESS
Note
The custom widget must implement the "serialize" method. Here, you have the option of writing
the internal data of a custom widget
to a specified file, or restoring it again. This is especially necessary, if, with the "Run MyScreens"
screen open, you change to another operating area and then return again. Otherwise, internal
data are lost when redisplaying.
Syntax:
public slots:
bool serialize(const QString& szFilePath, bool bIsStoring);
Description:
Reading and writing internal data and states to and from a file
Parameters:
szFilePath
Name of the file with complete path data, in which the
internal data and states of the custom widget are written
to - or from which they are to be read.
If necessary, the file must create the custom widget itself.
bIsStoring
TRUE = write
FALSE = read
Example
bool SlEsTestCustomWidget::serialize(const QString& szFilePath, bool bIsStoring)
{
QFileInfo fi(szFilePath);
bool bReturn = false;
QDir dir;
if (dir.mkpath(fi.canonicalPath()))
{
SINUMERIK Integrate Run MyScreens
Programming Manual, 10/2020, A5E40869575B AD
221
Graphic and logic elements
8.4 Custom widgets
bool SlEsTestCustomWidget::serialize(const QString& szFilePath, bool bIsStoring)
QFile fileData(szFilePath);
QIODevice::OpenMode mode;
if (bIsStoring)
{
mode = QIODevice::WriteOnly;
}
else
{
mode = QIODevice::ReadOnly;
}
if (fileData.open(mode))
{
QDataStream streamData;
streamData.setDevice(&fileData);
if (bIsStoring)
{
streamData << m_nDataCount << m_dValueX;
}
else
{
streamData >> m_nDataCount >> m_dValueX;
}
streamData.setDevice(0);
fileData.flush();
fileData.close();
bReturn = true;
}
}
return bReturn;
}
8.4.5.3
Response to a custom widget signal
Description
In Run MyScreens it is possible to respond to a particular signal (invokeSub()) of the custom
widget and call up a subprogram (SUB).
10 global variables, the so-called SIGARG, are available for passing values (custom widget signal
-> SUB), which are comparable to registers (REG) in configuration. This is where the values
transferred with the custom widget signal are stored.
SINUMERIK Integrate Run MyScreens
222
Programming Manual, 10/2020, A5E40869575B AD
Graphic and logic elements
8.4 Custom widgets
The following transfer parameter data formats are supported:
• bool
• uint
• int
• double
• QString
• QByteArray
Programming
Calling the subroutine:
Syntax:
void invokeSub(const QString& rszSignalName, const
QVariantList& rvntList);
Description:
Custom widget signal with which a Run MyScreens subprogram is called.
Parameters:
rszSignalName
Name of the Run MyScreens subprogram to be called
rvntList
QVariantList array for transferring parameters that are
stored in the global parameter SIGARG and which are
available in the configuration.
Maximum size: 10 elements
Data formats supported: see above
Note: The transfer parameters are always passed "ByVal,"
i.e. only the value and not, for example, the reference to
a variable is passed.
Subroutine to be called:
Syntax:
SUB(on_<Variablename>_<Signalname>)
…
END_SUB
Description:
Response to a custom widget signal
Parameters:
Variable name
Name of a dialog box variable to which a custom widget
is assigned.
Signal name
Name of the custom widget signal
SIGARG 0 - 9
Transfer parameters for the custom widget method.
Supported data formats: See above
Note: The transfer parameters are always passed "ByVal,"
i.e. only the value and not, for example, the reference to
a variable is passed.
Example
Customer widget class declaration:
class SLESTESTCUSTOMWIDGET_EXPORT SlEsTestCustomWidget
: public QWidget
{
SINUMERIK Integrate Run MyScreens
Programming Manual, 10/2020, A5E40869575B AD
223
Graphic and logic elements
8.4 Custom widgets
class SLESTESTCUSTOMWIDGET_EXPORT SlEsTestCustomWidget
: public QWidget
Q_OBJECT
signals:
void invokeSub(const QString& szSubName, const QVariantList& vntList);
…
}
Custom widget class:
QVariantList vntList;
vntList << 123.456;
emit invokeSub("MySub", vntList);
Dialog box configuration:
DEF MyCWVar1 = (W///,"slestestcustomwidget.SlEsTestCustomWidget")
SUB(on_MyCWVar1_MySub)
DEBUG("SUB(on_MyCWVar1_MySub) was called with parameter: """ << SIGARG[0] <<
"""")
END_SUB
Result "easyscreen_log.txt":
[10:22:40.445] DEBUG: SUB(on_MyCWVar1_MySub) was called with parameter: "123.456"
SINUMERIK Integrate Run MyScreens
224
Programming Manual, 10/2020, A5E40869575B AD
Graphic and logic elements
8.5 SIEsGraphCustomWidget
8.5
SIEsGraphCustomWidget
8.5.1
SIEsGraphCustomWidget
General
Using SlEsGraphCustomWidget, you can display geometrical objects (point, line, square, square
with rounded corners, ellipse, arc, text) and curves from interpolation points (e.g. measured
values, characteristic).
The objects are organized in one or several contours. These can then be displayed, either
individually or combined; they can also be entered, selected and deleted.
Using functions, the objects are added to the currently selected contour, and these are then
drawn in this particular sequence. If you wish to draw the object in a specific color, then you must
set the appropriate pen color before adding. All objects subsequently added will be drawn in this
pen color. In addition to the pen color, you can also influence the pen width and pen style. For
closed objects such as square, square with rounded edges and ellipse, before adding the objects
you can set a fill color.
Every contour can be brought into various modes:
• Standard display of all object types.
• Points can be connected to create a polyline, and can therefore be displayed as curve/graph.
• The area between points, lines or arcs up to the X axis can be filled in with the currently
selected fill color. For instance, you can use this option to visualize residual material when
turning.
If, in this mode, points are displayed in addition as polyline, then the complete area below the
curve up to the X axis is filled. The points, lines and arcs can be located in all four quadrants.
You can move along one or several contours using a special cursor mode. To do this, the cursor
is set to the first or last point object of a contour or, starting from the actual cursor position is
moved either forward or backward within the contour of a point object.
When required, a second Y axis (right) can be displayed with its own scaling. This is coupled to
the first Y axis (left) through an offset and a factor.
Based on a specified X coordinate, using a search function, a point previously added to the
contour can be found, and if required, the cursor can be set to this point.
You can also configure contours as ring buffer with an adjustable size.
As a result of the serialization, the actual state of the SlEsGraphCustomWidget can be saved in a
file in binary form - and also restored.
The SlEsGraphCustomWidget can be operated using the "Pan" gesture (where the view is
shifted) and the "Pinch"/"Spread" gestures (zooming in and out of the view).
Using the mouse, you can shift the view (left mouse button + Move), and you can zoom in and
out (mouse wheel).
For performance reasons, the display is not automatically refreshed. Depending on the
particular application, you can initiate the refresh by calling the appropriate function.
SINUMERIK Integrate Run MyScreens
Programming Manual, 10/2020, A5E40869575B AD
225
Graphic and logic elements
8.5 SIEsGraphCustomWidget
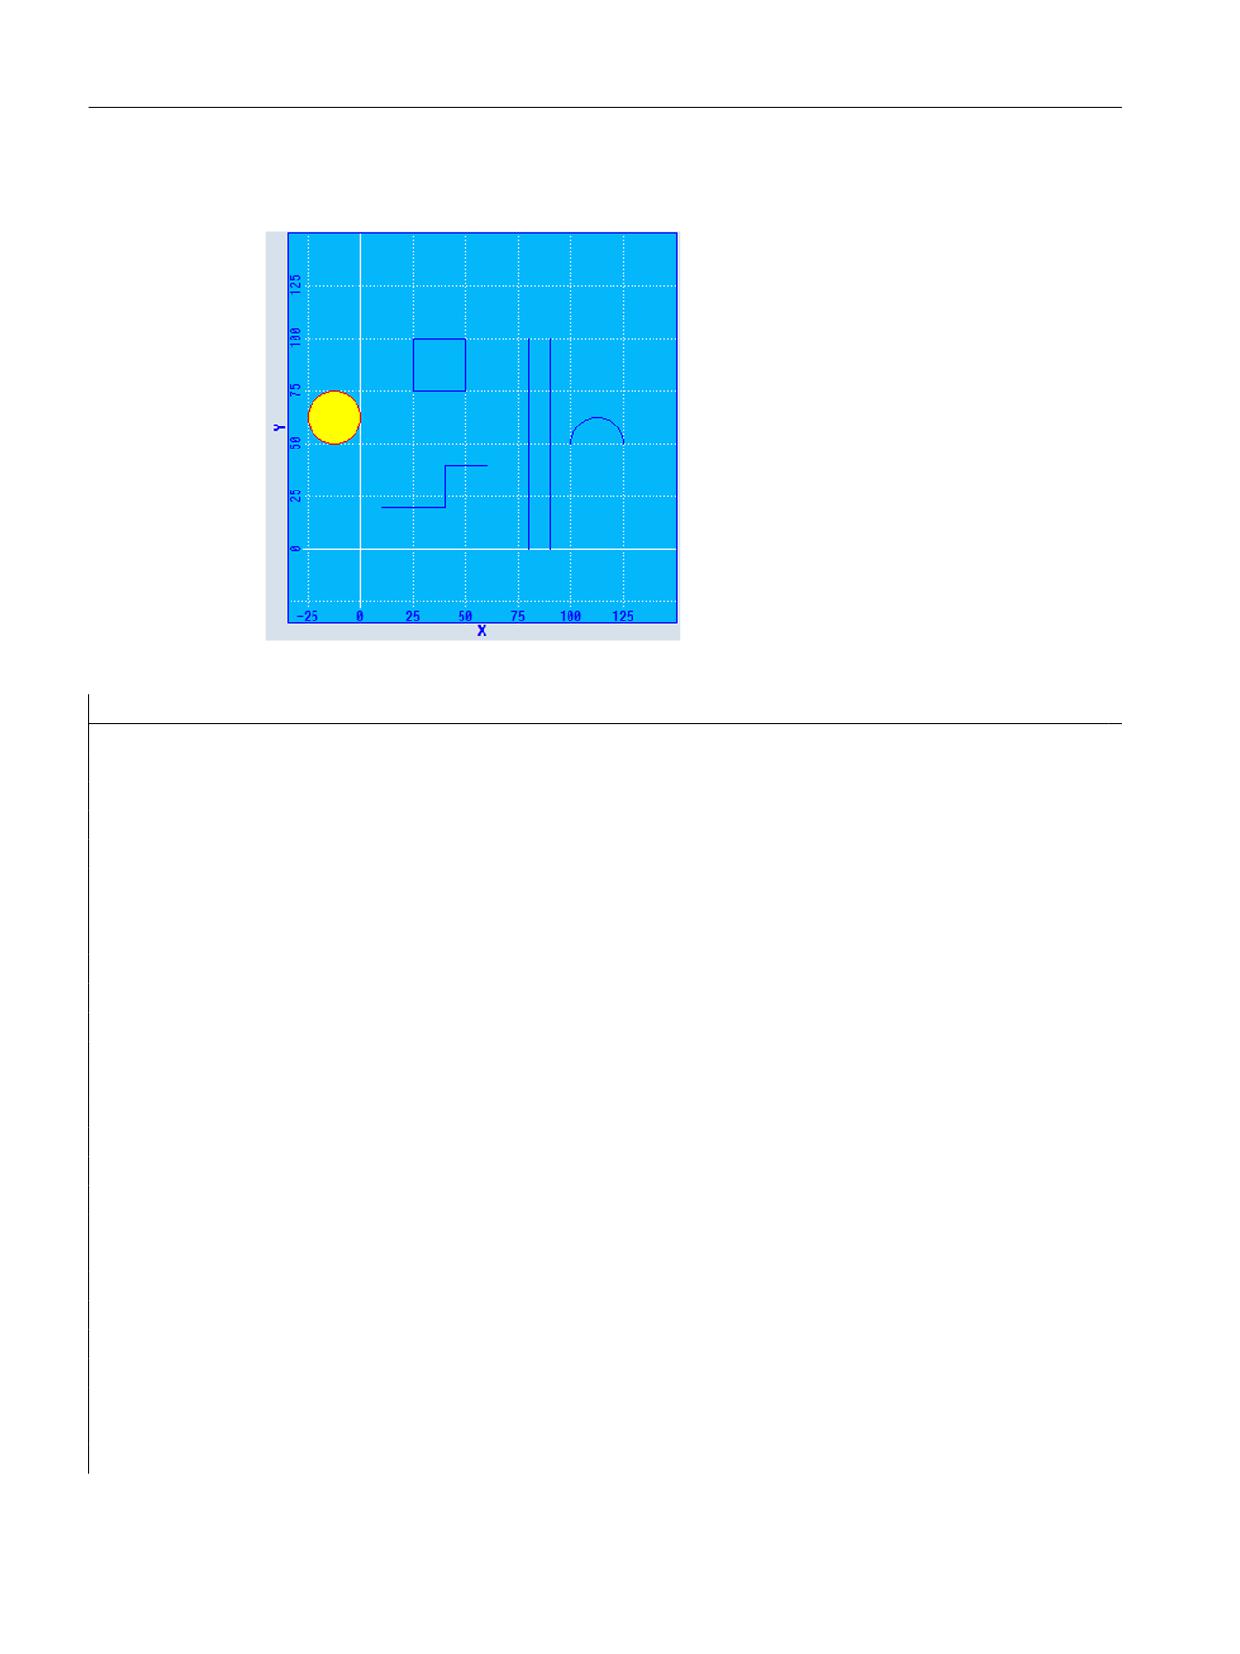
Example
Figure 8-1
SlEsGraphCustomWidget example
//M(MyGraphSampleMask/"SlEsGraphCustomWidget Sample")
DEF MyGraphVar = (W///,"slesgraphcustomwidget.SlEsGraphCustomWidget"/////10,10,340,340/0,0,0,0)
VS1=("Add objects",,se1)
LOAD
WRITECWPROPERTY("MyGraphVar", "AxisNameX", "X")
WRITECWPROPERTY("MyGraphVar", "AxisNameY", "Y")
WRITECWPROPERTY("MyGraphVar", "ScaleTextOrientationYAxis", 2)
WRITECWPROPERTY("MyGraphVar", "KeepAspectRatio", TRUE)
REG[0]= CALLCWMETHOD("MyGraphVar", "addContour", "MyContour", TRUE)
REG[0]= CALLCWMETHOD("MyGraphVar", "showContour", "MyContour")
REG[0]= CALLCWMETHOD("MyGraphVar", "setView", -35, -35, 150, 150)
END_LOAD
PRESS(VS1)
REG[0]= CALLCWMETHOD("MyGraphVar", "addLine", 10, 20, 40, 20)
REG[0]= CALLCWMETHOD("MyGraphVar", "addLine", 40, 20, 40, 40)
REG[0]= CALLCWMETHOD("MyGraphVar", "addLine", 40, 40, 60, 40)
REG[0]= CALLCWMETHOD("MyGraphVar", "addLine", 80, 0, 80, 100)
REG[0]= CALLCWMETHOD("MyGraphVar", "addLine", 90, 0, 90, 100)
REG[0]= CALLCWMETHOD("MyGraphVar", "addRect", 25, 100, 50, 75)
REG[0]= CALLCWMETHOD("MyGraphVar", "setPenColor", "#ff0000");red
REG[0]= CALLCWMETHOD("MyGraphVar", "setFillColor", "#ffff00");yellow
REG[0]= CALLCWMETHOD("MyGraphVar", "addCircle", -12.5, 62.5, 12.5)
REG[0]= CALLCWMETHOD("MyGraphVar", "setFillColor");off/default
REG[0]= CALLCWMETHOD("MyGraphVar", "setPenColor");off/default
REG[0]= CALLCWMETHOD("MyGraphVar", "addArc", 100, 37.5, 125, 62.5, 0, 180)
SINUMERIK Integrate Run MyScreens
226
Programming Manual, 10/2020, A5E40869575B AD
Graphic and logic elements
8.5 SIEsGraphCustomWidget
//M(MyGraphSampleMask/"SlEsGraphCustomWidget Sample")
REG[0]= CALLCWMETHOD("MyGraphVar", "update")
END_PRESS
8.5.2
Notes regarding performance
Depending on the hardware used and the basic utilization of the system, when using
SlEsGraphCustomWidgets you must observe the following guide values. In addition to the
hardware being used and the basic utilization, the values vary depending on the
SIEsGraphCustomWidgets configuration.
Observe these guide values so that the response and stability of the overall system are not
diminished.
• Number of SlEsGraphCustomWidgets configured simultaneously (e.g. a maximum of 1)
• Number of configured contours (e.g. a maximum of 6)
• Number of configured graphic objects per contour (e.g. maximum of 1000)
• Frequency of the requested refresh operations (e.g. max. 500 ms)
Note
The display is not real-time capable.
8.5.3
Reading and writing properties
Description
The properties listed in the following section are read with ReadCWProperty() and written with
WriteCWProperty().
Examples
Reading the "CursorX" property of the SlEsGraphCustomWidget linked using display variable
"MyGraphVar". The result is written to register 0.
REG[0] = ReadCWProperty("MyGraphVar", "CursorX")
Writes value "MyFirstContour" to the "SelectedContour" property of the
SlEsGraphCustomWidget linked using display variable "MyGraphVar".
WriteCWProperty("MyGraphVar ", "SelectedContour", "MyFirstContour")
SINUMERIK Integrate Run MyScreens
Programming Manual, 10/2020, A5E40869575B AD
227
Graphic and logic elements
8.5 SIEsGraphCustomWidget
8.5.4
Properties
Overview
Property
Description
AxisNameX
Axis identifiers, X axis
AxisNameY
Axis identifiers, Y axis
AxisNameY2
Axis identifiers, second Y axis (right)
AxisY2Visible
Display/hide second Y axis (right)
AxisY2Offset
Offset second Y axis (right)
AxisY2Factor
Factor second Y axis (right)
ScaleTextEmbedded
Position of the scaling texts
ScaleTextOrientationYAxis
Alignment of the scaling texts of the Y axis
KeepAspectRatio
Keep aspect ratios
SelectedContour
Name of the currently selected contour
BackColor
Background color
ChartBackColor
Background color of the drawing area
ForeColor
Foreground color for text and default pen color
ForeColorY2
Foreground color for the texts of the second Y axis (right)
GridColor
Color of the grid lines
GridColorY2
Color of the horizontal grid lines of the second Y axis (right)
CursorColor
Color of the cursor crosshairs
ShowCursor
Display/hide cursor
CursorX
Cursor X position
CursorY
Cursor Y position
CursorY2
Cursor Y position referred to the second Y axis (right)
CursorStyle
Cursor display type
ViewMoveZoomMode
Response when zooming and shifting using gestures
AxisNameX - axis identifiers, X axis
Syntax:
ReturnValue = ReadCWProperty(GraphVarName, "AxisNameX")
WriteCWProperty(GraphVarName, "AxisNameX", Value)
Description:
Reads or sets the identifier of the X axis. If an identifier is not specified, then the
space available for the drawing area is fully utilized.
Parameters:
GraphVarName
Name of the display variable which contains a SlEsGraph-
CustomWidget
Return Value
Read value of the property (QString)
Value
Value to be set (QString)
SINUMERIK Integrate Run MyScreens
228
Programming Manual, 10/2020, A5E40869575B AD
Graphic and logic elements
8.5 SIEsGraphCustomWidget
AxisNameX - axis identifiers, Y axis
Syntax:
ReturnValue = ReadCWProperty(GraphVarName, "AxisNameY")
WriteCWProperty(GraphVarName, "AxisNameY", Value)
Description:
Reads or sets the identifier of the Y axis. If an identifier is not specified, then the
space available for the drawing area is fully utilized.
Parameters:
GraphVarName
Name of the display variable which contains a SlEsGraph-
CustomWidget
Return Value
Read value of the property (QString)
Value
Value to be set (QString)
AxisY2Visible - display/hide second Y axis (right)
Syntax:
ReturnValue = ReadCWProperty(GraphVarName, "AxisY2Visible")
WriteCWProperty(GraphVarName, "AxisY2Visible", Value)
Description:
Displays/hides second Y axis (right)
Parameters:
GraphVarName
Name of the display variable which contains a SlEsGraph-
CustomWidget
Return Value
Read value of the property (bool)
Value
Value to be set (bool): TRUE or FALSE
AxisY2Offset - offset second Y axis (right)
Syntax:
ReturnValue = ReadCWProperty(GraphVarName, "AxisY2Offset")
WriteCWProperty(GraphVarName, "AxisY2Offset", Value)
Description:
Offset of the second Y axis (right) referred to the first Y axis (left).
See example for AxisY2Factor property.
Parameters:
GraphVarName
Name of the display variable which contains a SlEsGraph-
CustomWidget
Return Value
Read value of the property (double)
Value
Value to be set (double).
AxisY2Factor - factor second Y axis (right)
Syntax:
ReturnValue = ReadCWProperty(GraphVarName, "AxisY2Factor") WriteCWProp-
erty(GraphVarName, "AxisY2Factor", Value)
Description:
Factor of the second Y axis (right) referred to the first Y axis (left).
Parameters:
GraphVarName
Name of the display variable which contains a SlEsGraph-
CustomWidget
Return Value
Read value of the property (double)
Value
Value to be set (double).
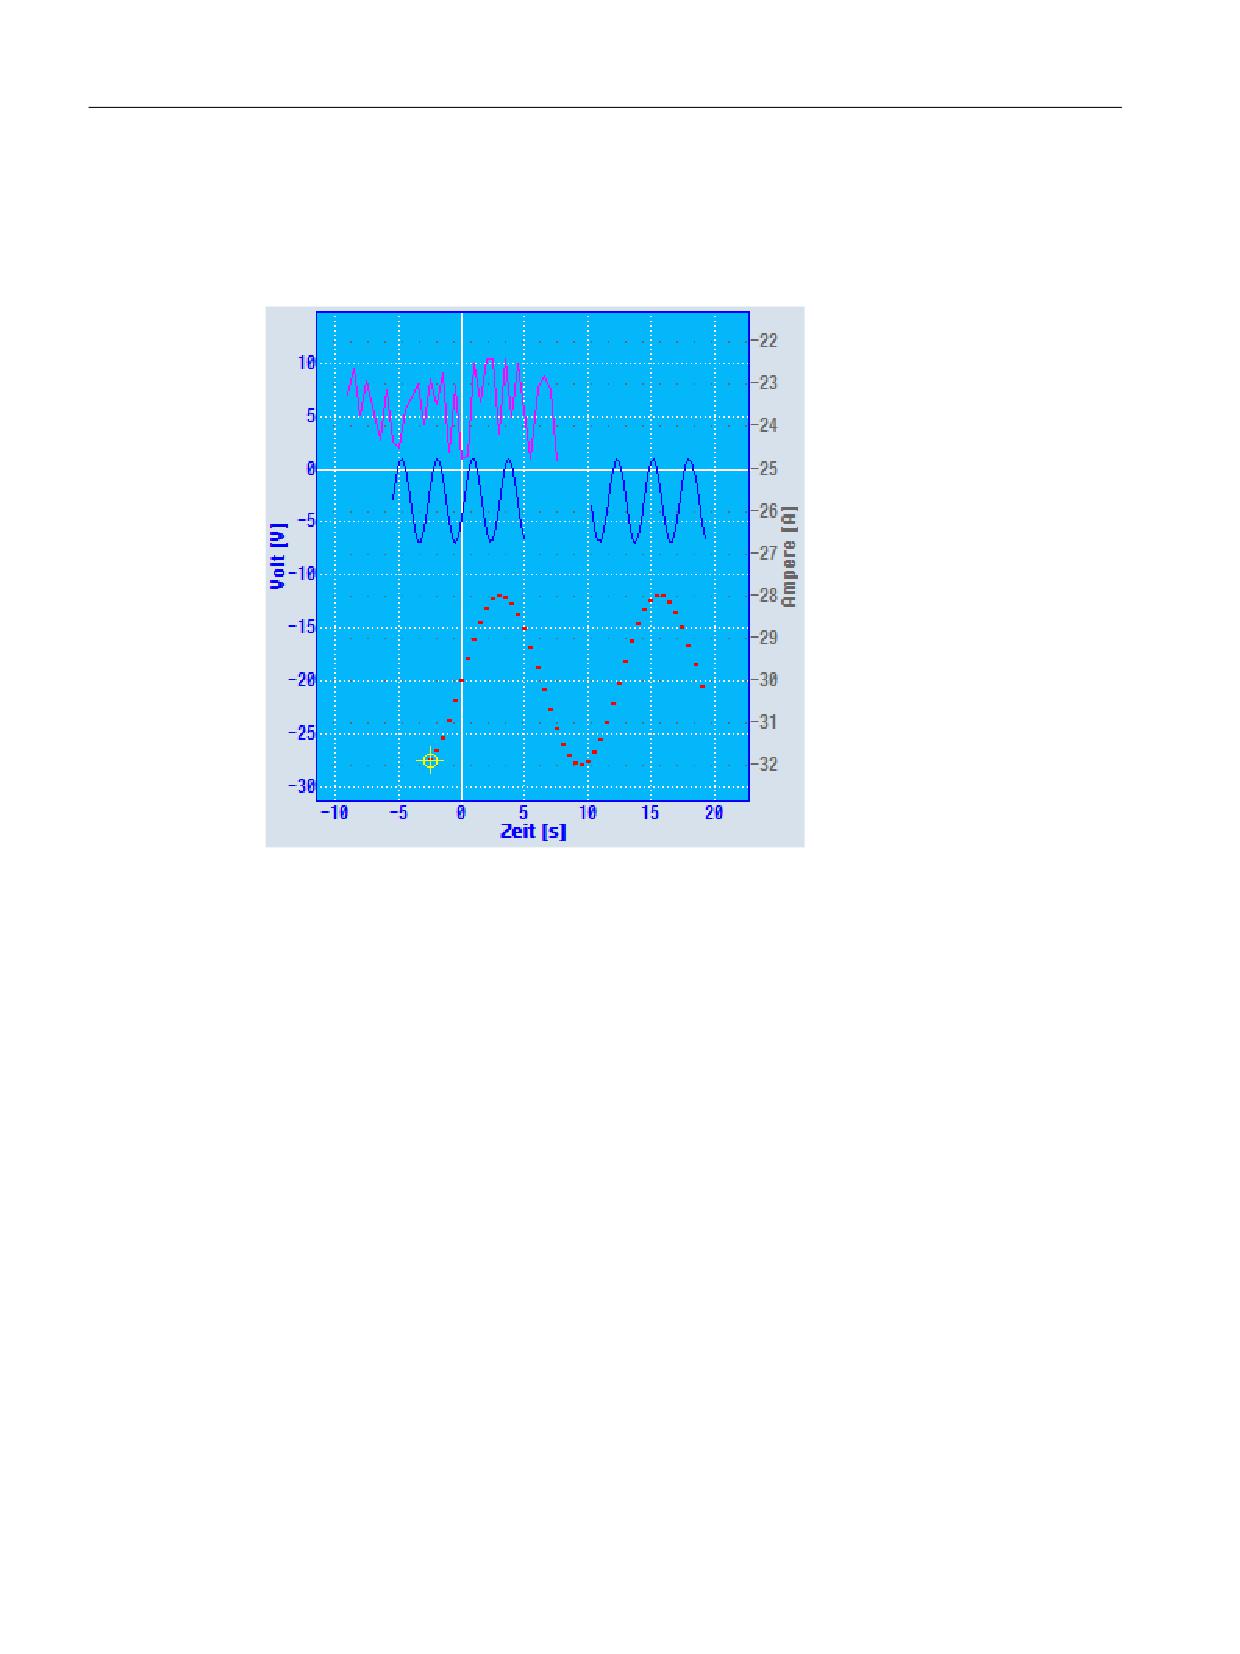
Together with the "AxisY2Offset" property, it is possible to display a second Y axis (right) with its
own scaling. The scale is coupled to the first Y axis (left) through an offset and a factor.
Formula for converting Y2 to Y:
SINUMERIK Integrate Run MyScreens
Programming Manual, 10/2020, A5E40869575B AD
229
Graphic and logic elements
8.5 SIEsGraphCustomWidget
Y = Y2 / factor - offset
Formula for converting Y to Y2:
Y2 = (Y + offset) * factor
Figure 8-2
Example with second Y axis with own scaling
Example
Y: 0 to 200 should correspond to Y2: -25 to 25.
• Offset: -100
• Factor: 0.25
Calculation example:
Y2 = -30
Y = -30 / 0.25 - (-100) = -20
Calculation example:
Y = 0
Y2 = (0 + (-100)) * 0.25 = -25
The X axis is the same for both coordinate systems.
You can set the colors using setForeColorY2() and setGridColorY2() (see colors).
The axes are labeled with setAxisNameY2() (see axis identifiers).
SINUMERIK Integrate Run MyScreens
230
Programming Manual, 10/2020, A5E40869575B AD
Graphic and logic elements
8.5 SIEsGraphCustomWidget
ScaleTextEmbedded - position of the scaling texts
Syntax:
ReturnValue = ReadCWProperty(GraphVarName, "ScaleTextEmbedded")
WriteCWProperty(GraphVarName, "ScaleTextEmbedded", Value)
Description:
Using this property you define whether the scaling is positioned inside or outside
the drawing area.
Parameters:
GraphVarName
Name of the display variable which contains a SlEsGraph-
CustomWidget
Return Value
Read value of the property (bool)
Value
Value to be set (bool): TRUE or FALSE
Example
Scaling text outside the drawing area:
ScaleTextEmbedded = FALSE
Figure 8-3
Scaling text outside the drawing area
Scaling text within the drawing area:
ScaleTextEmbedded = TRUE
Figure 8-4
Scaling text within the drawing area
SINUMERIK Integrate Run MyScreens
Programming Manual, 10/2020, A5E40869575B AD
231
Graphic and logic elements
8.5 SIEsGraphCustomWidget
ScaleTextOrientationYAxis - alignment of the scaling texts of the Y axis
Syntax:
ReturnValue = ReadCWProperty(GraphVarName, "ScaleTextOrientationYAxis")
WriteCWProperty(GraphVarName, "ScaleTextOrientationYAxis", Value)
Description:
Using this function, the scaling texts of the Y axis are aligned vertically.
Parameters:
GraphVarName
Name of the display variable which contains a SlEsGraph-
CustomWidget
Return Value
Read value of the property (int)
Value
Value to be set (int): 1 (= horizontal) or 2 (= vertical)
Example
Scaling text within the drawing area:
• ScaleTextEmbedded = TRUE
Horizontal text alignment:
• ScaleTextOrientationYAxis = 1
Figure 8-5
Scaling text within the drawing area, horizontal text alignment
Vertical text alignment:
• ScaleTextOrientationYAxis = 2
Figure 8-6
Scaling text within the drawing area, vertical text alignment
SINUMERIK Integrate Run MyScreens
232
Programming Manual, 10/2020, A5E40869575B AD
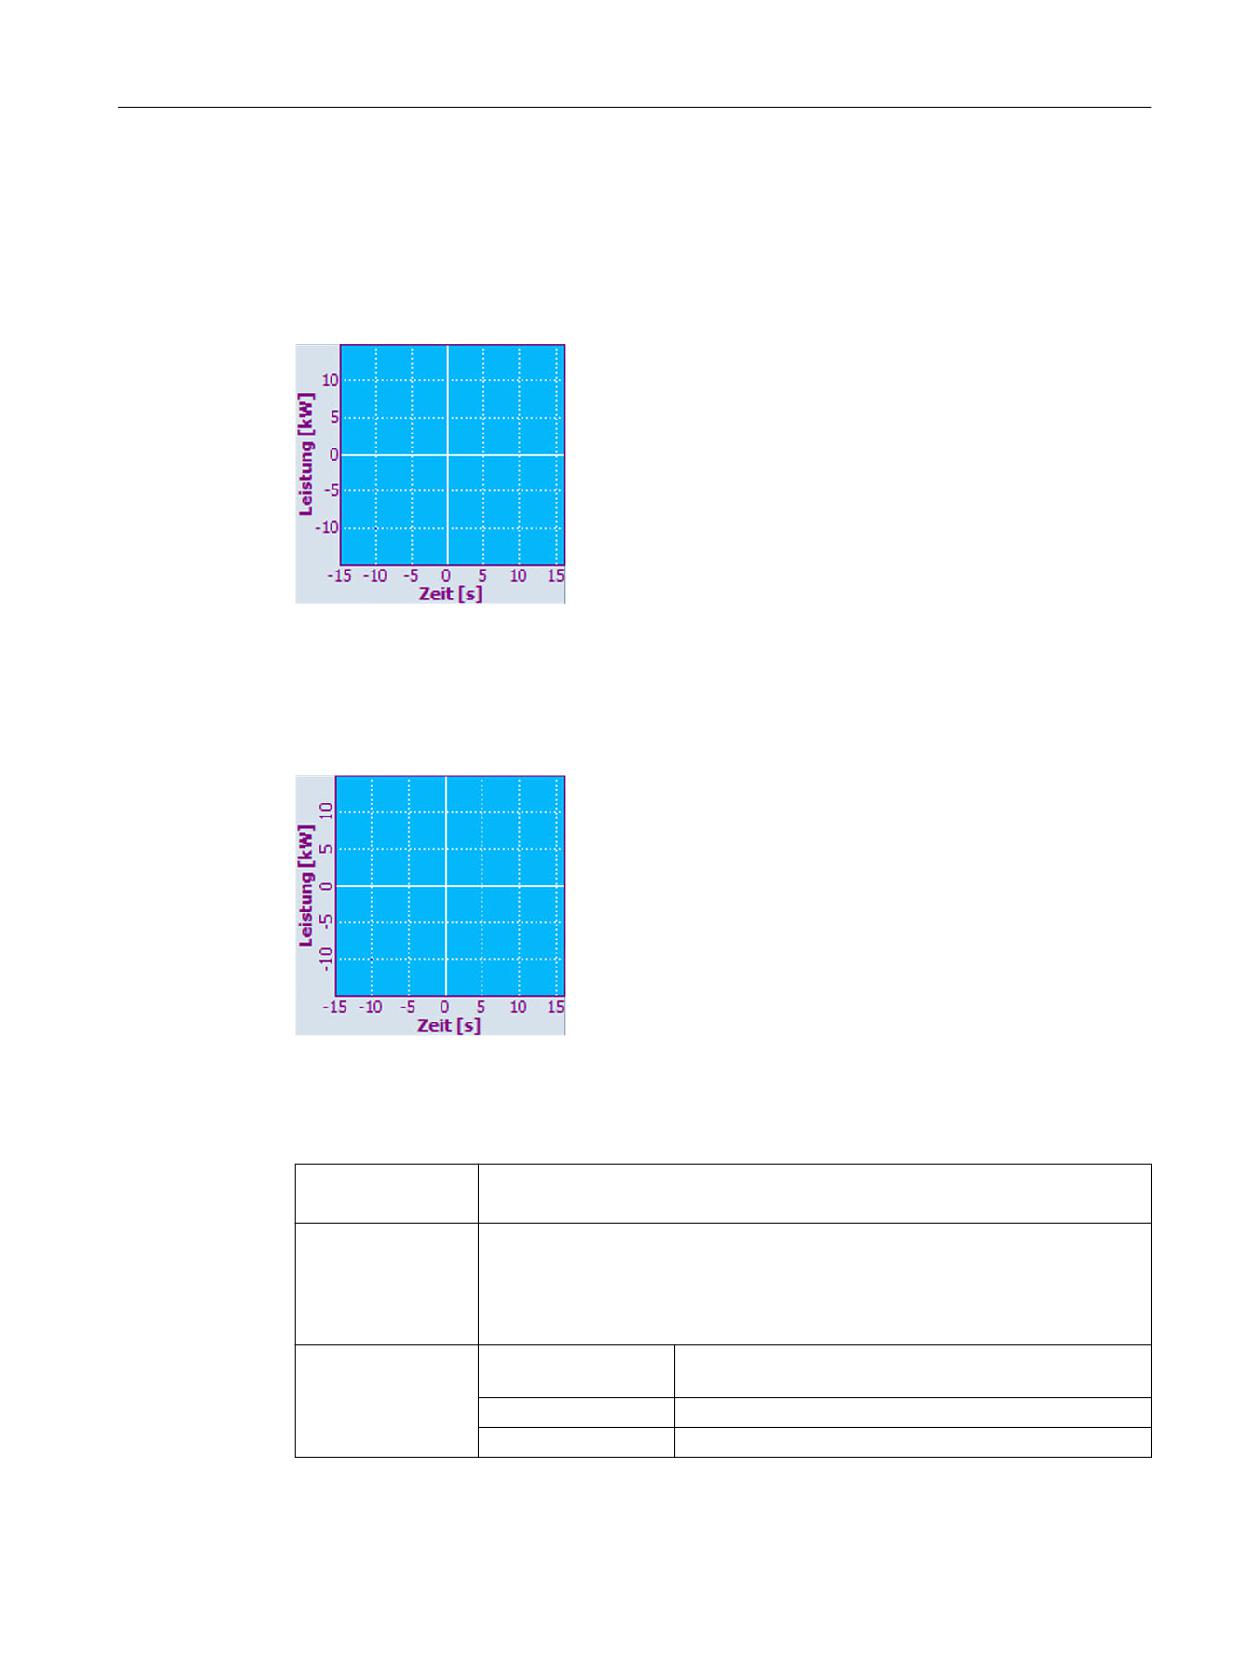
Graphic and logic elements
8.5 SIEsGraphCustomWidget
Scaling text outside the drawing area:
• ScaleTextEmbedded = FALSE
Horizontal text alignment:
• ScaleTextOrientationYAxis = 1
Figure 8-7
Scaling text outside the drawing area, horizontal text alignment
Vertical text alignment:
• ScaleTextOrientationYAxis = 2
Figure 8-8
Scaling text outside the drawing area, vertical text alignment
KeepAspectRatio - keep aspect ratio
Syntax:
ReturnValue = ReadCWProperty(GraphVarName, "KeepAspectRatio")
WriteCWProperty(GraphVarName, "KeepAspectRatio", Value)
Description:
With this property, you define as to whether the view defined using setView()
should be automatically aligned, adapted or extended, so that the aspect ratio
from X to Y axis always remains the same. This property is especially relevant when
displaying geometrical figures. For example, a circle or square is displayed as such,
and does not become an ellipse or rectangle.
Parameters:
GraphVarName
Name of the display variable which contains a SlEsGraph-
CustomWidget
Return Value
Read value of the property (bool)
Return Value
Value to be set (bool): TRUE or FALSE
SINUMERIK Integrate Run MyScreens
Programming Manual, 10/2020, A5E40869575B AD
233
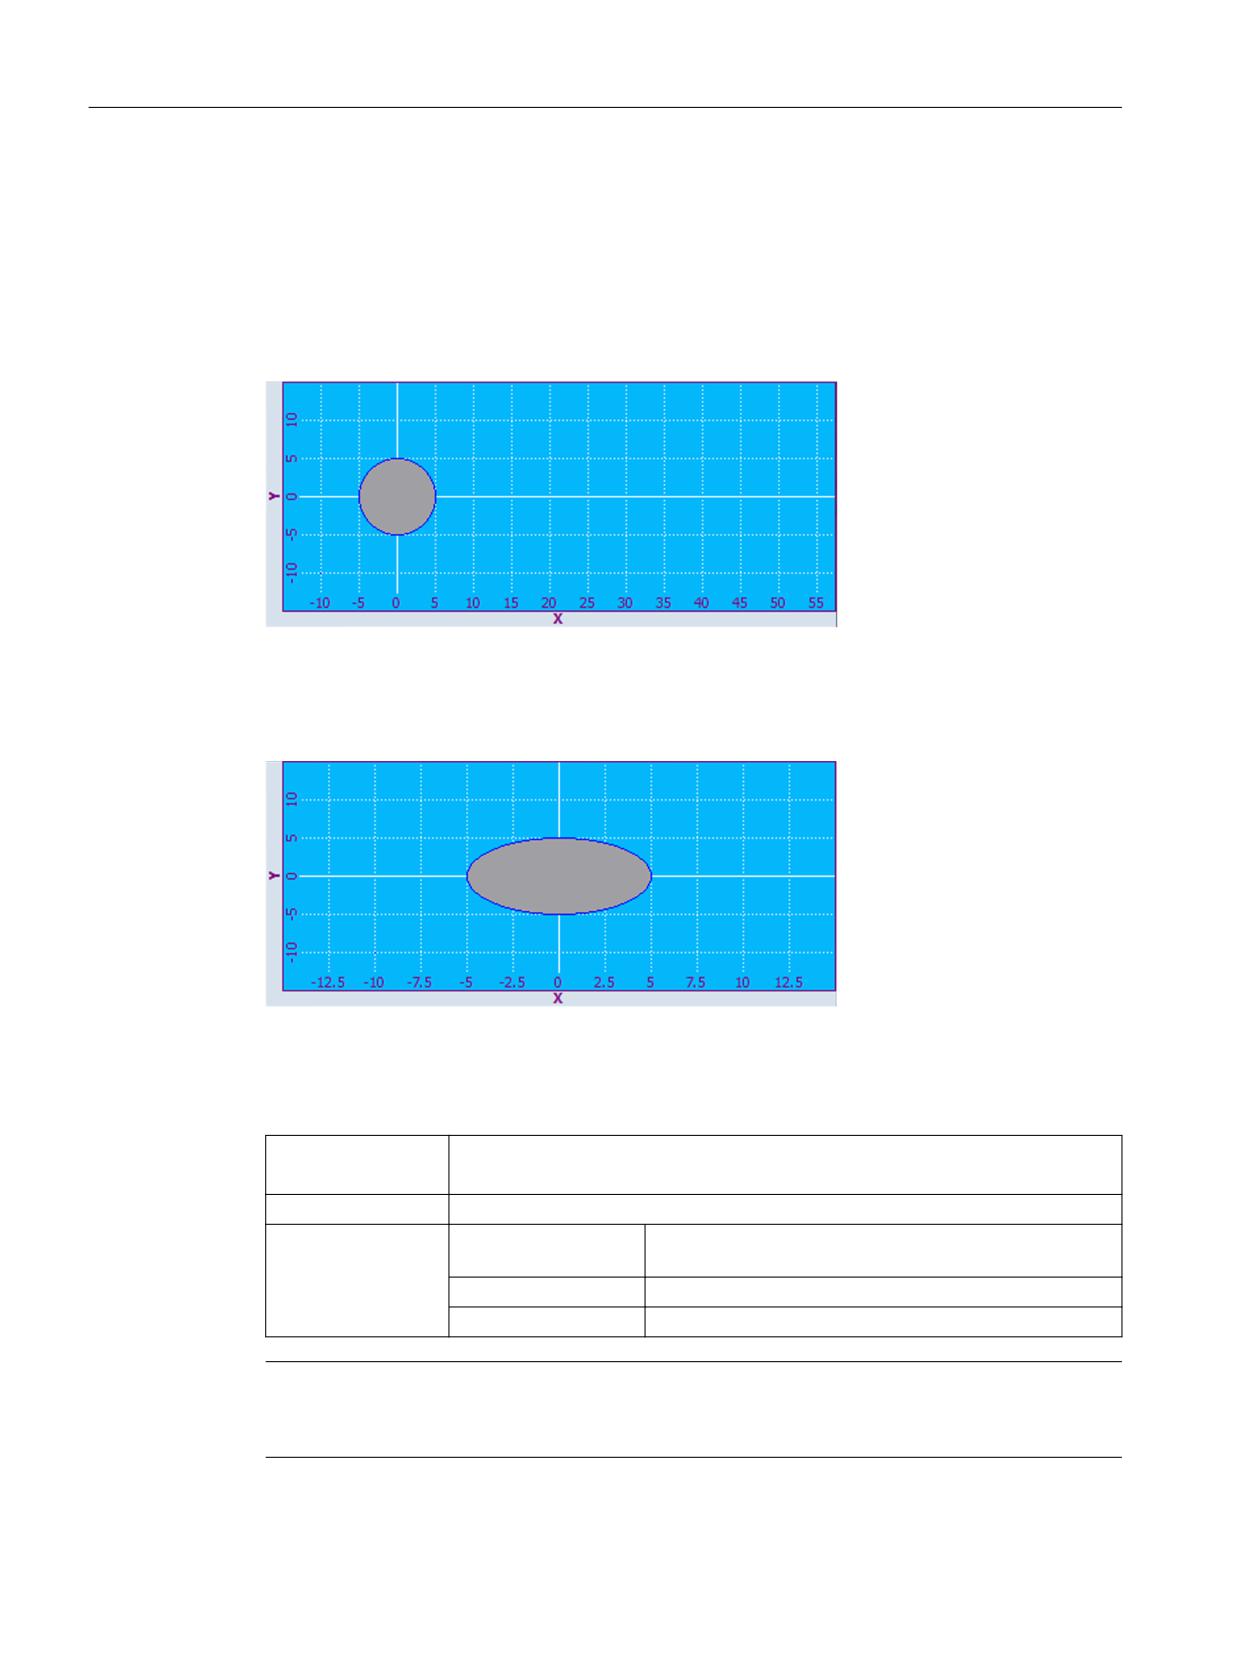
Graphic and logic elements
8.5 SIEsGraphCustomWidget
Example
setView(-15, -15, 15, 15)
setFillColor("#A0A0A4")
addCircle(0, 0, 5)
KeepAspectRatio = TRUE
Figure 8-9
Aspect ratio from X to Y axis remain the same
KeepAspectRatio = FALSE
Figure 8-10
Aspect ratio from X to Y axis distorted
SelectedContour - name of the currently selected contour
Syntax:
ReturnValue = ReadCWProperty(GraphVarName, " SelectedContour")
WriteCWProperty(GraphVarName, " SelectedContour", Value)
Description:
Reads or sets the selection of the actual contour.
Parameters:
GraphVarName
Name of the display variable which contains a SlEsGraph-
CustomWidget
Return Value
Read value of the property (QString)
Value
Value to be set (QString)
Note
In order to be able to execute operations on a contour, e.g. to add a graphic object, you must
first select this.
SINUMERIK Integrate Run MyScreens
234
Programming Manual, 10/2020, A5E40869575B AD
Graphic and logic elements
8.5 SIEsGraphCustomWidget
BackColor - backg36round color
Syntax:
ReturnValue = ReadCWProperty(GraphVarName, " BackColor")
WriteCWProperty(GraphVarName, " BackColor", Value)
Description:
The backg36round color for labeling axes depends on the ScaleTextInsideChartArea
property - also the scaling texts.
Parameters:
GraphVarName
Name of the display variable which contains a SlEsGraph-
CustomWidget
Return Value
Read color of the property (QString)
Value
Value to be set (QString) as RGB value in the form
"#RRGGBB", for example, "#04B7FB"
ChartBackColor - backg36round color of the drawing area
Syntax:
ReturnValue = ReadCWProperty(GraphVarName, "ChartBackColor")
WriteCWProperty(GraphVarName, "ChartBackColor", Value)
Description:
Background color for the drawing area.
Parameters:
GraphVarName
Name of the display variable which contains a SlEsGraph-
CustomWidget
Return Value
Read color of the property (QString)
Value
Value to be set (QString) as RGB value in the form
"#RRGGBB", for example, "#04B7FB"
ForeColor - foreground color for labeling and default pen color
Syntax:
ReturnValue = ReadCWProperty(GraphVarName, "ForeColor")
WriteCWProperty(GraphVarName, "ForeColor", Value)
Description:
Foreground color for text and default pen color.
Parameters:
GraphVarName
Name of the display variable which contains a SlEsGraph-
CustomWidget
Return Value
Read color of the property (QString)
Value
Value to be set (QString) as RGB value in the form
"#RRGGBB", for example, "#04B7FB"
ForeColorY2 - foreground color for labeling the second Y axis (right)
Syntax:
ReturnValue = ReadCWProperty(GraphVarName, "ForeColorY2")
WriteCWProperty(GraphVarName, "ForeColorY2", Value)
Description:
Foreground color for the texts of the second Y axis (right).
Parameters:
GraphVarName
Name of the display variable which contains a SlEsGraph-
CustomWidget
Return Value
Read color of the property (QString)
Value
Value to be set (QString) as RGB value in the form
"#RRGGBB", for example, "#04B7FB"
SINUMERIK Integrate Run MyScreens
Programming Manual, 10/2020, A5E40869575B AD
235
Graphic and logic elements
8.5 SIEsGraphCustomWidget
GridColor - color of the grid lines
Syntax:
ReturnValue = ReadCWProperty(GraphVarName, "GridColor")
WriteCWProperty(GraphVarName, "GridColor", Value)
Description:
Color of the grid lines.
Parameters:
GraphVarName
Name of the display variable which contains a SlEsGraph-
CustomWidget
Return Value
Read color of the property (QString)
Value
Value to be set (QString) as RGB value in the form
"#RRGGBB", for example, "#04B7FB"
GridColorY2 - color of the horizontal grid lines of the second Y axis (right)
Syntax:
ReturnValue = ReadCWProperty(GraphVarName, "GridColorY2")
WriteCWProperty(GraphVarName, "GridColorY2", Value)
Description:
Color of the horizontal grid lines of the second Y axis (right).
Parameters:
GraphVarName
Name of the display variable which contains a SlEsGraph-
CustomWidget
Return Value
Read color of the property (QString)
Value
Value to be set (QString) as RGB value in the form
"#RRGGBB", for example, "#04B7FB"
CursorColor - color of the cursor
Syntax:
ReturnValue = ReadCWProperty(GraphVarName, "CursorColor")
WriteCWProperty(GraphVarName, "CursorColor", Value)
Description:
Color of the cursor.
Parameters:
GraphVarName
Name of the display variable which contains a SlEsGraph-
CustomWidget
Return Value
Read color of the property (QString)
Value
Value to be set (QString) as RGB value in the form
"#RRGGBB", for example, "#04B7FB"
ShowCursor - Display/hide cursor
Syntax:
ReturnValue = ReadCWProperty(GraphVarName, " ShowCursor")
WriteCWProperty(GraphVarName, " ShowCursor", Value)
Description:
Displays/hides cursor.
Parameters:
GraphVarName
Name of the display variable which contains a SlEsGraph-
CustomWidget
Return Value
Read value of the property (bool)
Value
Value to be set (bool): TRUE or FALSE
SINUMERIK Integrate Run MyScreens
236
Programming Manual, 10/2020, A5E40869575B AD
Graphic and logic elements
8.5 SIEsGraphCustomWidget
Note
This function automatically refreshes the display.
CursorX - cursor X position
Syntax:
ReturnValue = ReadCWProperty(GraphVarName, "CursorX")
WriteCWProperty(GraphVarName, "CursorX", Value)
Description:
X position of the cursor.
Parameters:
GraphVarName
Name of the display variable which contains a SlEsGraph-
CustomWidget
Return Value
Read value of the property (double)
Value
Value to be set (double).
Note
This function automatically refreshes the display.
CursorY - cursor Y position
Syntax:
ReturnValue = ReadCWProperty(GraphVarName, "CursorY")
WriteCWProperty(GraphVarName, "CursorY", Value)
Description:
Y position of the cursor.
Parameters:
GraphVarName
Name of the display variable which contains a SlEsGraph-
CustomWidget
Return Value
Read value of the property (double)
Value
Value to be set (double).
Note
This function automatically refreshes the display.
CursorY2 - cursor Y position referred to the second Y axis (right)
Syntax:
ReturnValue = ReadCWProperty(GraphVarName, "CursorY2")
WriteCWProperty(GraphVarName, "CursorY2", Value)
Description:
Y position of the cursor referred to the second Y axis (right).
Parameters:
GraphVarName
Name of the display variable which contains a SlEsGraph-
CustomWidget
Return Value
Read value of the property (double)
Value
Value to be set (double).
SINUMERIK Integrate Run MyScreens
Programming Manual, 10/2020, A5E40869575B AD
237
Graphic and logic elements
8.5 SIEsGraphCustomWidget
Note
This function automatically refreshes the display.
CursorStyle - cursor display type
Syntax:
ReturnValue = ReadCWProperty(GraphVarName, "CursorStyle")
WriteCWProperty(GraphVarName, "CursorStyle", Value)
Description:
Cursor display type.
Parameters:
GraphVarName
Name of the display variable which contains a SlEsGraph-
CustomWidget
Return Value
Read value of the property (int)
Value
Value to be set (int):
0 (= cross)
1 (= crosshairs)
2 (= vertical line)
3 (= horizontal line)
4 (= horizontal and vertical line))
ViewMoveZoomMode - response when zooming and shifting using gestures
Syntax:
ReturnValue = ReadCWProperty(GraphVarName, "ViewMoveZoomMode")
WriteCWProperty(GraphVarName, "ViewMoveZoomMode", Value)
Description:
The displayed view of the SlEsGraphCustomWidgets can be changed using ges-
tures. This property allows you to define which type should be permitted. For
example, in certain applications it may make sense that the view is only horizon-
tally shifted and zoomed, e.g. when displaying measured value characteristics.
Parameters:
GraphVarName
Name of the display variable which contains a SlEsGraph-
CustomWidget
Return Value
Read value of the property (int)
Value
Value to be set (int):
0 (= off)
1 (= only horizontal)
2 (= only vertical)
3 (= horizontal and vertical)
8.5.5
Functions
You can call the subsequently listed functions using the CallCWMethod() function.
Example
Setting the view of the SlEsGraphCustomWidget link using display variable "MyGraphVar".
SINUMERIK Integrate Run MyScreens
238
Programming Manual, 10/2020, A5E40869575B AD
Graphic and logic elements
8.5 SIEsGraphCustomWidget
The result is written to register 0.
REG[0] = CallCWMethod("MyGraphVar", "setView", -8, -5, 11- 20)
Overview
Function
Description
setView
Sets coordinate system
setMaxContourObjects
Sets maximum number of objects for a contour (ring buffer)
addContour
Adds a contour
showContour
Shows a contour
hideContour
Hides a contour
hideAllContours
Hides all contours
removeContour
Removes a contour
clearContour
Deletes graphic object of a contour
fitViewToContours
Automatic adaptation of the view
fitViewToContour
Automatic adaptation of the view
findX
Searches in a contour
setPolylineMode
Displays points of a contour as polyline/curve
setIntegralFillMode
Displays points of a contour as polyline/curve
repaint, update
Refreshes view
addPoint
Adds a point to a contour
addLine
Adds a line to a contour
addRect
Adds a rectangle to a contour
addRoundedRect
Adds a rectangle with rounded corners to a contour
addEllipse
Adds an ellipse to a contour
addCircle
Adds a circle to a contour
addArc
Adds an arc to a contour
addText
Adds text to a contour
setPenWidth
Sets the pen width
setPenStyle
Sets the pen style
setPenColor
Sets the pen color
setFillColor
Sets fill color
setCursorPosition
Positions the cursor
setCursorPositionY2
Positions the cursor referred to the second Y axis (right)
setCursorOnContour
Positions the cursor on contour
moveCursorOnContourBegin
Positions the cursor to the first graphic object of a contour
moveCursorOnContourEnd
Positions the cursor to the last graphic object of a contour
moveCursorOnContourNext
Positions the cursor to the next graphic object of a contour
serialize
Saves/restores the actual state
SINUMERIK Integrate Run MyScreens
Programming Manual, 10/2020, A5E40869575B AD
239
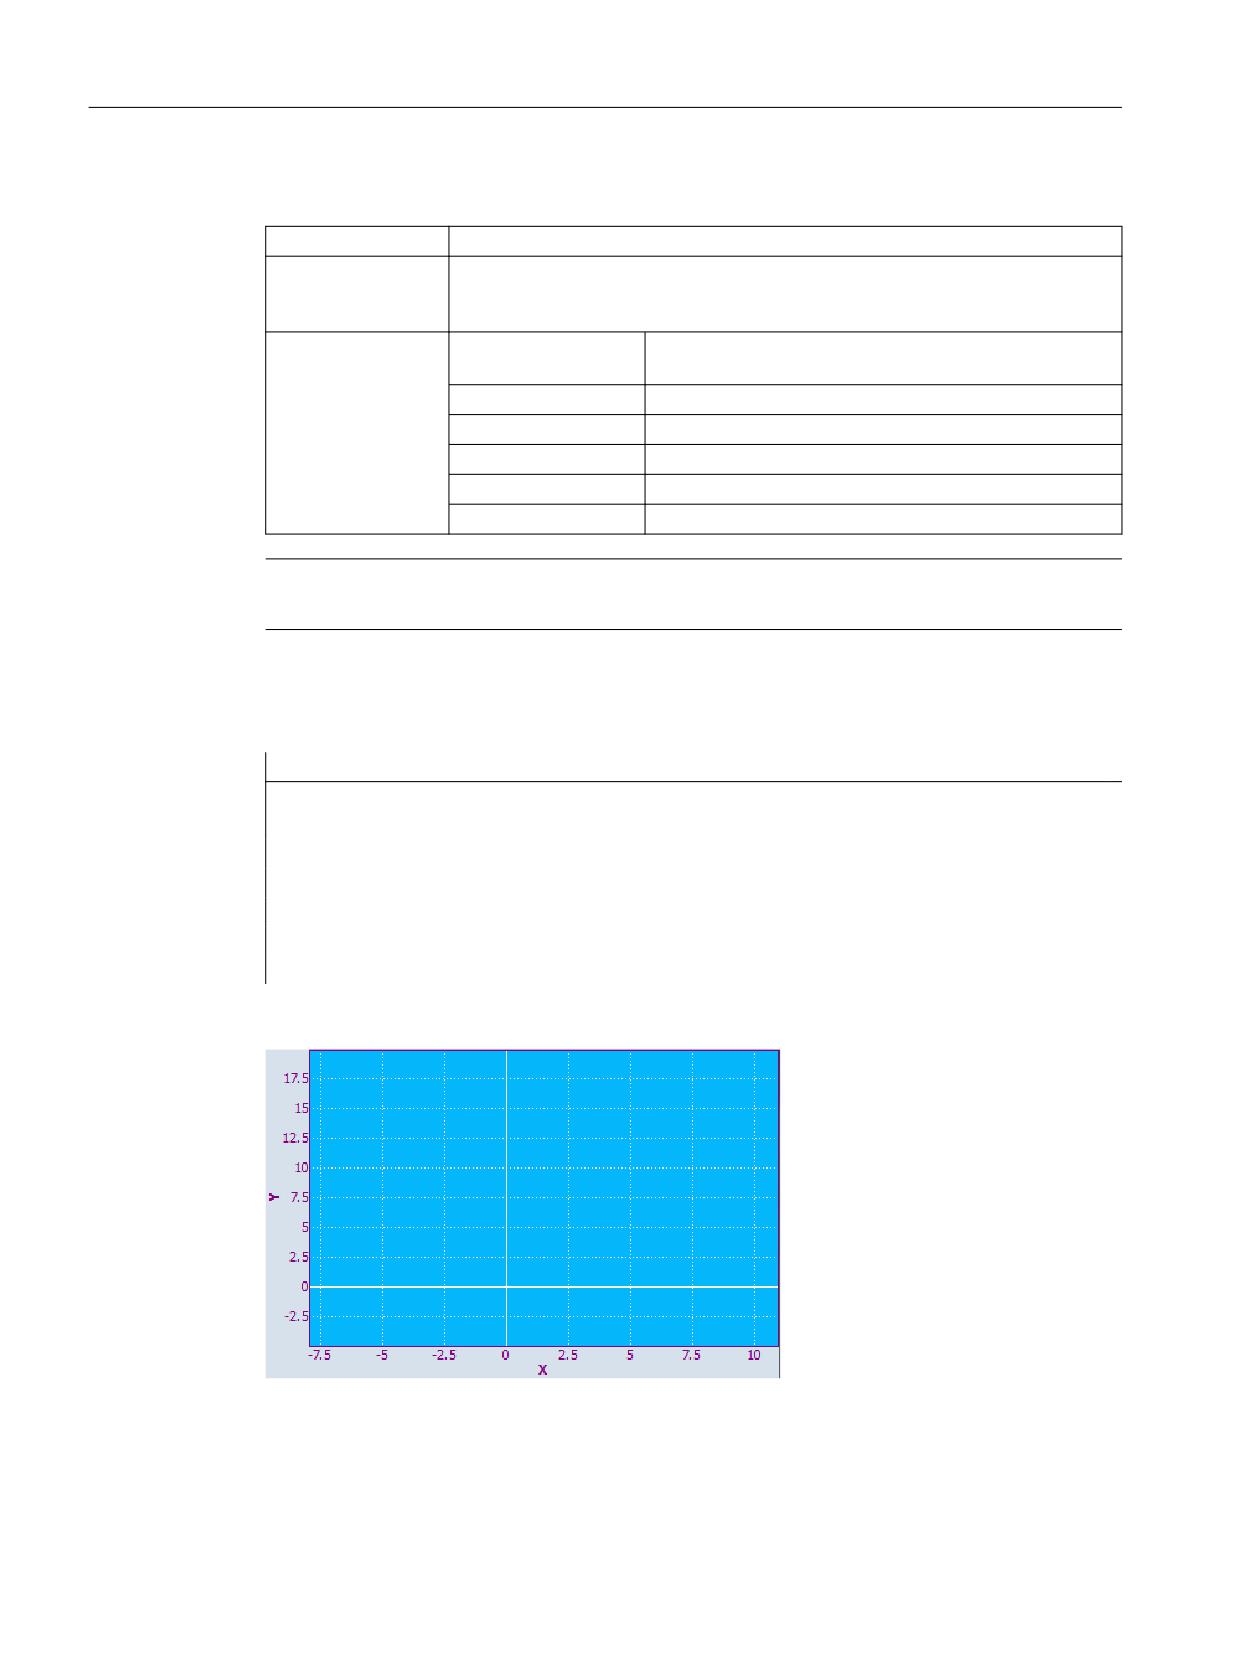
Graphic and logic elements
8.5 SIEsGraphCustomWidget
setView - sets the coordinate system
Syntax:
ReturnValue = CallCWMethod(GraphVarName, "setView", x1, y1, x2, y2)
Description:
Using this function, you define the size of the coordinate system that should be
displayed within the SlEsGraphCustomWidget. See also KeepAspectRatio proper-
ty.
Parameters:
GraphVarName
Name of the display variable which contains a SlEsGraph-
CustomWidget
Return Value
Error code (bool): TRUE = successful
x1
left-hand edge (double)
y1
upper edge (double)
x2
right-hand edge (double)
y2
lower edge (double)
Note
The function automatically refreshes the display.
Example
setView(-8, -5, 11, 20)
AxisNameX = "X"
AxisNameY = "Y"
ScaleTextOrientationYAxis = 1
ScaleTextEmbedded = false
KeepAspectRatio = false
update
Figure 8-11
Example - setView
SINUMERIK Integrate Run MyScreens
240
Programming Manual, 10/2020, A5E40869575B AD
Graphic and logic elements
8.5 SIEsGraphCustomWidget
setMaxContourObjects - sets the maximum number of objects of a contour (ring buffer)
Syntax:
ReturnValue = CallCWMethod(GraphVarName, "setMaxContourObjects", Value)
ReturnValue = CallCWMethod(GraphVarName, "setMaxContourObjects", Value,
ContourName)
Description:
Using this function, you can define the size of a contour ring buffer. If the number
of objects added to the contour exceeds this limit, then the oldest object is deleted.
Parameters:
GraphVarName
Name of the display variable which contains a SlEsGraph-
CustomWidget
Return Value
Error code (bool): TRUE = successful
Value
Maximum number of graphic objects (uint)
ContourName
Name of the contour (QString).
If a contour is not specified, then the call automatically
refers to the currently selected contour.
Note
The function automatically refreshes the display.
addContour - add contour
Syntax:
ReturnValue = CallCWMethod(GraphVarName, "addContour", ContourName)
ReturnValue = CallCWMethod(GraphVarName, "addContour", ContourName, Se-
lected)
ReturnValue = CallCWMethod(GraphVarName, "addContour", ContourName, Se-
lected, AssignedY2)
Description:
Using this function, you can define a new contour.
Optionally, you can assign the contour to the coordinate system of the second Y
axis (right).
Parameters:
GraphVarName
Name of the display variable which contains a SlEsGraph-
CustomWidget
Return Value
Error code (bool): TRUE = successful
ContourName
Name of the contour (QString).
If a contour is not specified, then the call automatically
refers to the currently selected contour.
Selected
Contour should be selected (bool): TRUE or FALSE
AssignedY2
Contour should be assigned to the second Y axis (right)
(bool): TRUE or FALSE
showContour - shows a contour
Syntax:
ReturnValue = CallCWMethod(GraphVarName, "showContour")
ReturnValue = CallCWMethod(GraphVarName, "showContour", ContourName)
Description:
This function makes a contour visible.
SINUMERIK Integrate Run MyScreens
Programming Manual, 10/2020, A5E40869575B AD
241
Graphic and logic elements
8.5 SIEsGraphCustomWidget
Parameters:
GraphVarName
Name of the display variable which contains a SlEsGraph-
CustomWidget
Return Value
Error code (bool): TRUE = successful
ContourName
Name of the contour (QString).
If a contour is not specified, then the call automatically
refers to the currently selected contour.
hideContour - hide contour
Syntax:
ReturnValue = CallCWMethod(GraphVarName, "hideContour")
ReturnValue = CallCWMethod(GraphVarName, "hideContour", ContourName)
Description:
This function hides a contour.
Parameters:
GraphVarName
Name of the display variable which contains a SlEsGraph-
CustomWidget
Return Value
Error code (bool): TRUE = successful
ContourName
Name of the contour (QString).
If a contour is not specified, then the call automatically
refers to the currently selected contour.
showAllContours - shows all contours
Syntax:
ReturnValue = CallCWMethod(GraphVarName, "showAllContours")
Description:
This function makes all contours visible.
Parameters:
GraphVarName
Name of the display variable which contains a SlEsGraph-
CustomWidget
Return Value
Error code (bool): TRUE = successful
hideAllContours - hide all contours
Syntax:
ReturnValue = CallCWMethod(GraphVarName, "hideAllContours")
Description:
This function hides all contours.
Parameters:
GraphVarName
Name of the display variable which contains a SlEsGraph-
CustomWidget
Return Value
Error code (bool): TRUE = successful
removeContour - hides a contour
Syntax:
ReturnValue = CallCWMethod(GraphVarName, "removeContour")
ReturnValue = CallCWMethod(GraphVarName, "removeContour", ContourName)
Description:
Removes a contour.
SINUMERIK Integrate Run MyScreens
242
Programming Manual, 10/2020, A5E40869575B AD
Graphic and logic elements
8.5 SIEsGraphCustomWidget
Parameters:
GraphVarName
Name of the display variable which contains a SlEsGraph-
CustomWidget
Return Value
Error code (bool): TRUE = successful
ContourName
Name of the contour (QString).
If a contour is not specified, then the call automatically
refers to the currently selected contour.
clearContour - delete graphic object of a contour
Syntax:
ReturnValue = CallCWMethod(GraphVarName, "clearContour")
ReturnValue = CallCWMethod(GraphVarName, "clearContour", ContourName)
Description:
Deletes all graphic objects on a contour.
Parameters:
GraphVarName
Name of the display variable which contains a SlEsGraph-
CustomWidget
Return Value
Error code (bool): TRUE = successful
ContourName
Name of the contour (QString).
If a contour is not specified, then the call automatically
refers to the currently selected contour.
fitViewToContours - automatic adaptation of the view
Syntax:
ReturnValue = CallCWMethod(GraphVarName, "fitViewToContours")
ReturnValue = CallCWMethod(GraphVarName, "fitViewToContours", OnlyVisi-
ble)
Description:
Using this function, the view is automatically adapted to the contours. Depending
on the transfer parameter, you define whether only all visible contours can be seen
or all contours can be seen.
Parameters:
GraphVarName
Name of the display variable which contains a SlEsGraph-
CustomWidget
Return Value
Error code (bool): TRUE = successful
OnlyVisible
Value to be set (bool): TRUE or FALSE
fitViewToContour - automatic adaptation of the view
Syntax:
ReturnValue = CallCWMethod(GraphVarName, "fitViewToContour", Contour-
Name)
Description:
Using this function, the view is automatically adapted so that only a specific con-
tours visible.
Parameters:
GraphVarName
Name of the display variable which contains a SlEsGraph-
CustomWidget
Return Value
Error code (bool): TRUE = successful
ContourName
Name of the contour (QString)
SINUMERIK Integrate Run MyScreens
Programming Manual, 10/2020, A5E40869575B AD
243
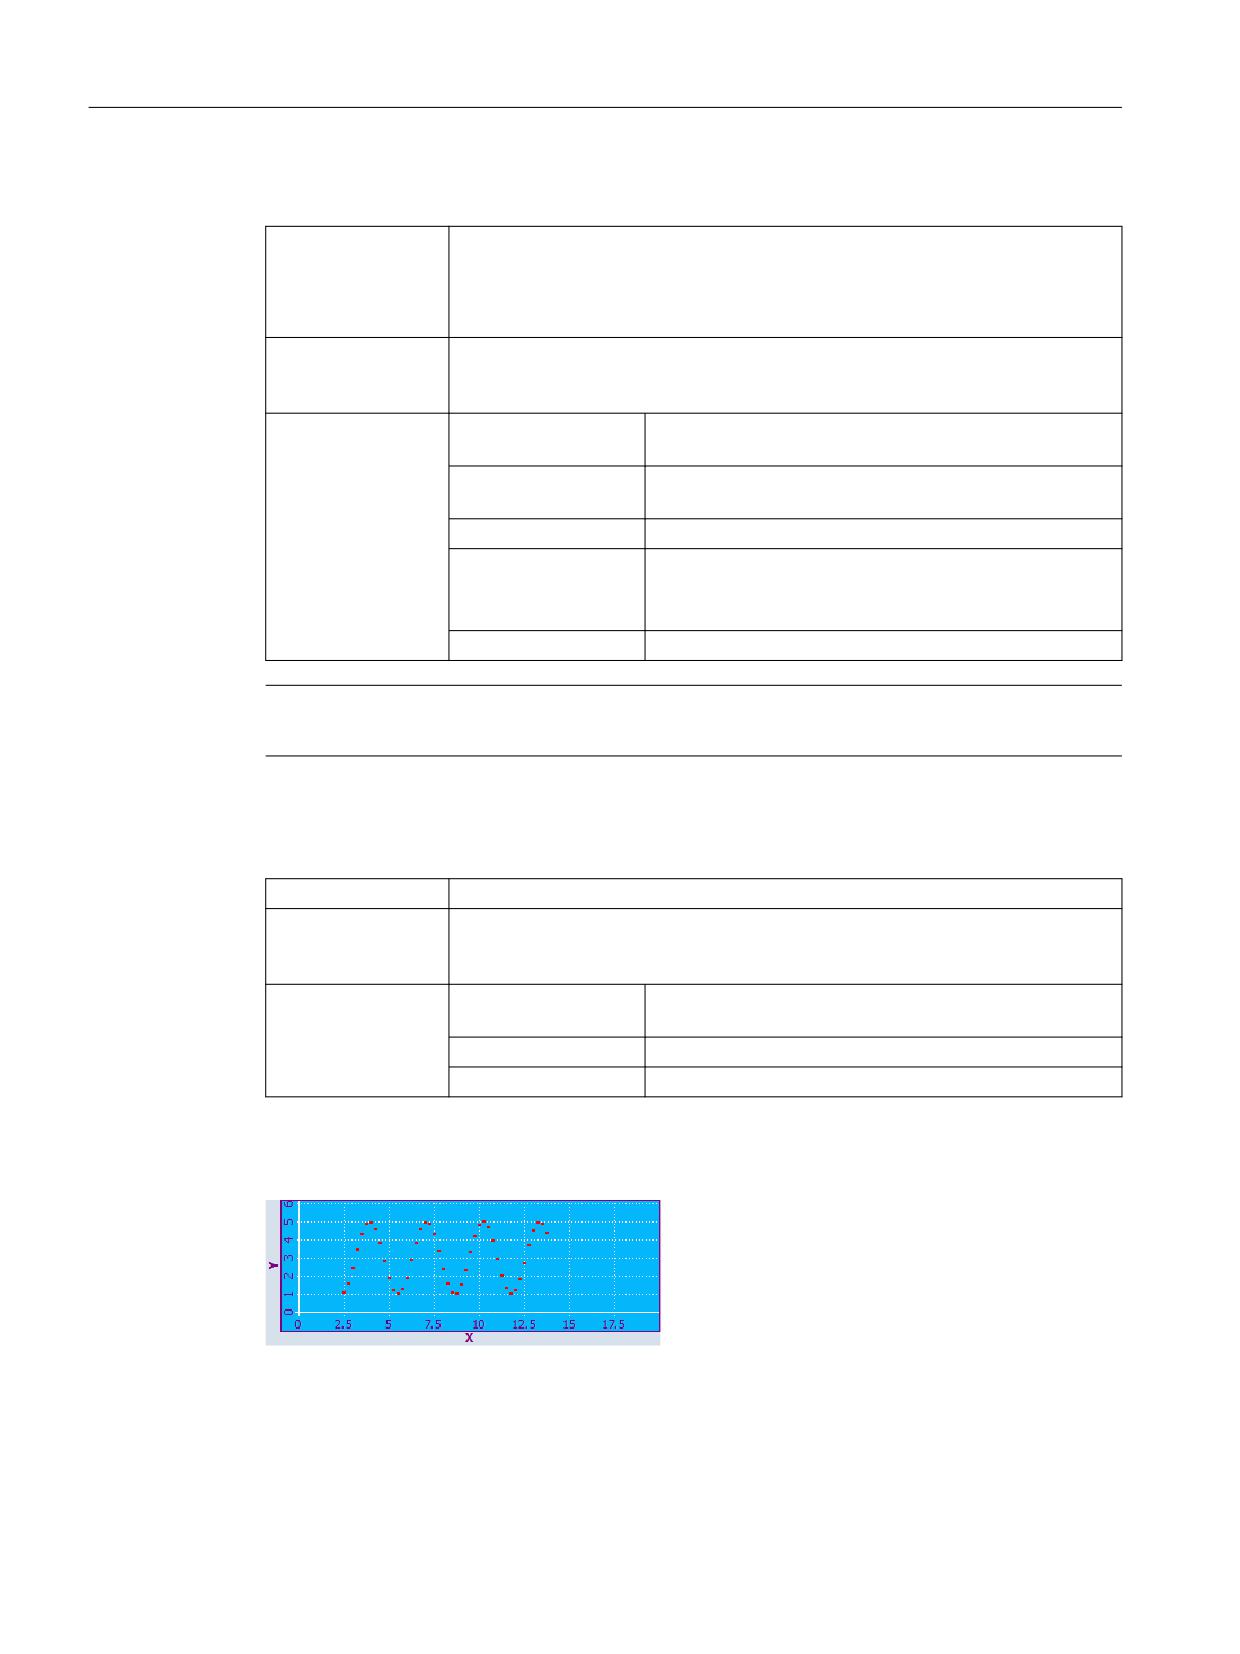
Graphic and logic elements
8.5 SIEsGraphCustomWidget
findX - search in a contour
Syntax:
ReturnValue = CallCWMethod(GraphVarName, "findX", x)
ReturnValue = CallCWMethod(GraphVarName, "findX", x, ContourName)
ReturnValue = CallCWMethod(GraphVarName, "findX", x, ContourName, SetCur-
sor)
Description:
Using this function, you can search for a previously defined point with a specific X
coordinate in a contour. You obtain the Y coordinate as result. Optionally, you can
also simultaneously position the cursor to this point.
Parameters:
GraphVarName
Name of the display variable which contains a SlEsGraph-
CustomWidget
Return Value
Error code (QString): If successful, the associated Y value
is supplied
x
X value to be searched for (double)
ContourName
Name of the contour (QString).
If a contour is not specified, then the call automatically
refers to the currently selected contour
SetCursor
Set cursor (bool): TRUE or FALSE
Note
The display is automatically updated if you set the cursor using this function.
setPolylineMode - displays points on the contour as polyline/curve
Syntax:
ReturnValue = CallCWMethod(GraphVarName, "setPolylineMode", SetPoly)
Description:
All of the points of the actual contour added after this function call are connected
to create a polyline/curve. This function is contour-specific, and can be activated
and deactivated on a segment-for-segment basis.
Parameters:
GraphVarName
Name of the display variable which contains a SlEsGraph-
CustomWidget
Return Value
Error code (bool): TRUE = successful
SetPoly
PolylineMode (bool): TRUE = on
Example
Figure 8-12
Example - PolylineMode: Off
SINUMERIK Integrate Run MyScreens
244
Programming Manual, 10/2020, A5E40869575B AD
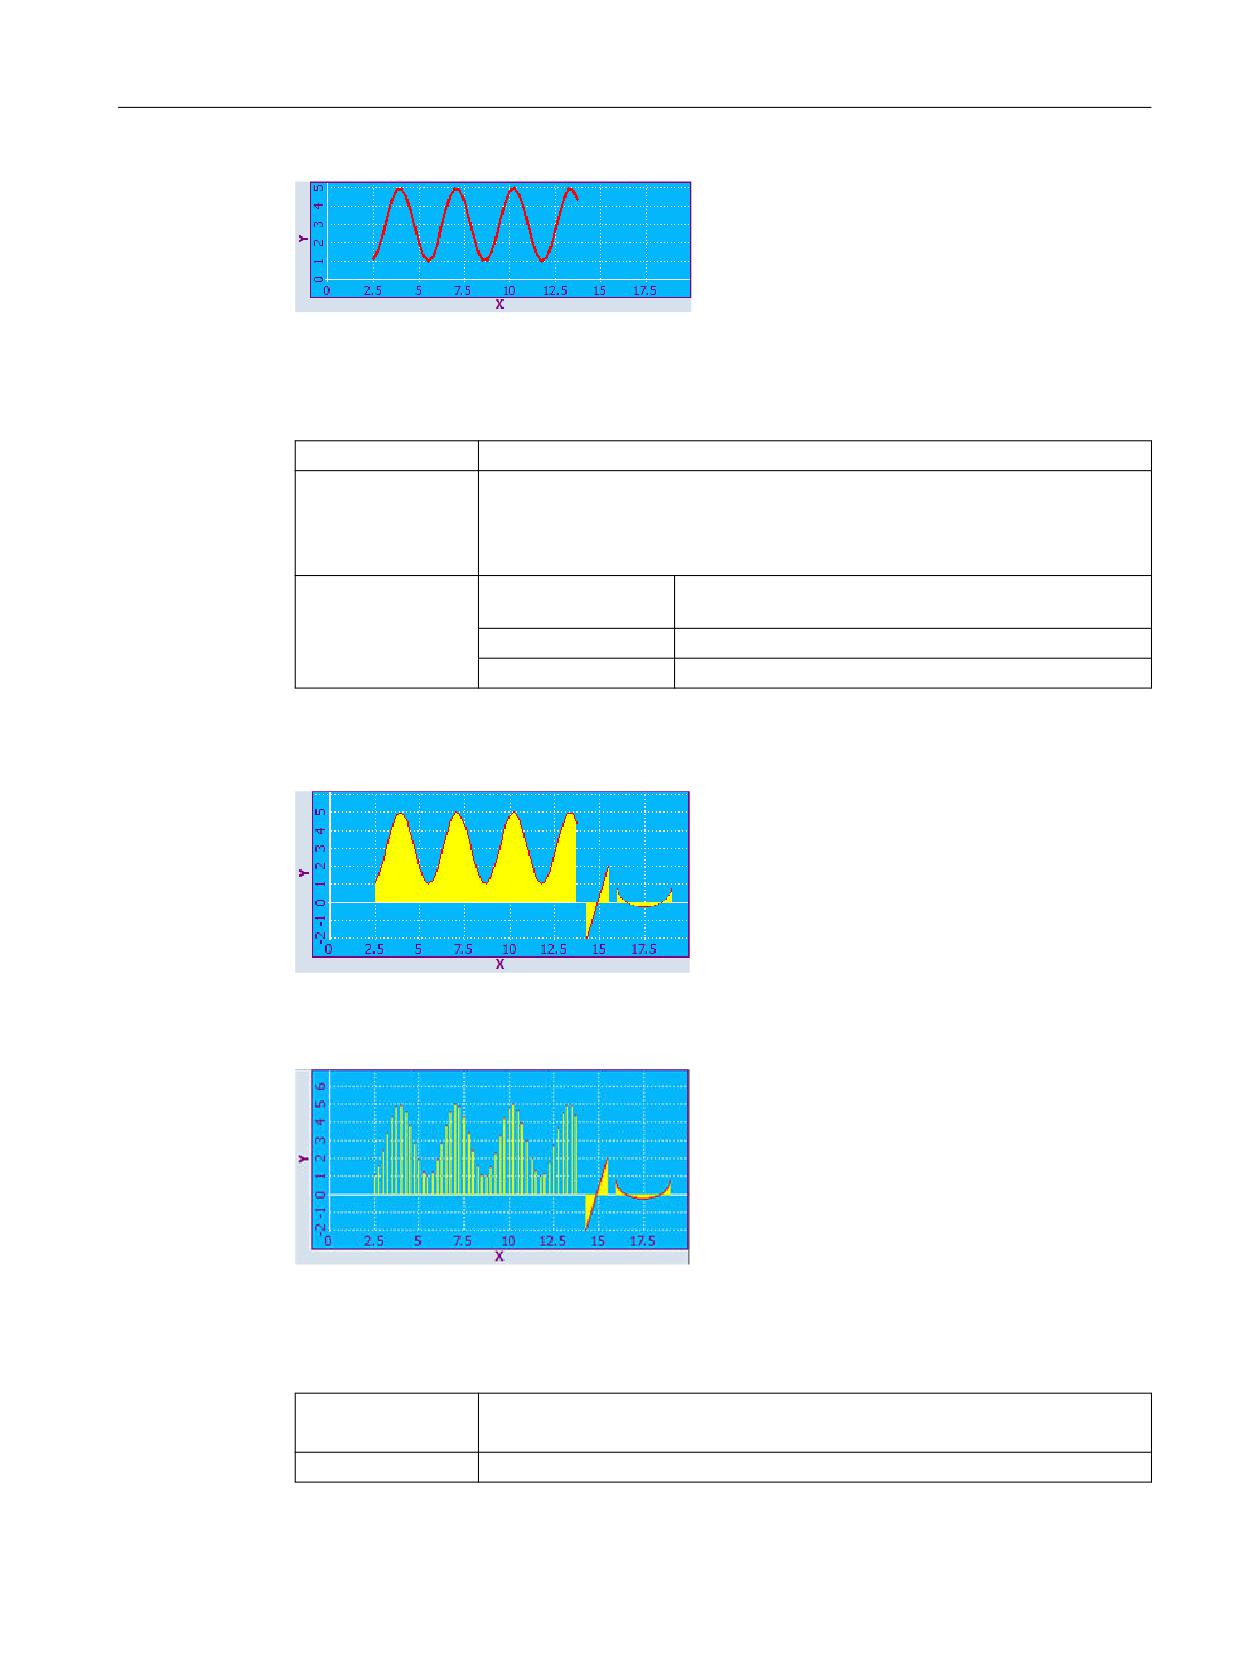
Graphic and logic elements
8.5 SIEsGraphCustomWidget
Figure 8-13
Example - PolylineMode: To
setIntegralFillMode - fills the areas between points, lines and arcs and the X axis
Syntax:
ReturnValue = CallCWMethod(GraphVarName, "setIntegralFillMode", SetIntFill)
Description:
Areas between points, lines and arcs of the X axis are filled with the current fill
color (independent of whether the points are +Y or -Y).
This function is contour-specific, and can be activated and deactivated on a seg-
ment-for-segment basis.
Parameters:
GraphVarName
Name of the display variable which contains a SlEsGraph-
CustomWidget
Return Value
Error code (bool): TRUE = successful
SetIntFill
IntegralFillMode (bool): TRUE = on
Example
Figure 8-14
Example - setIntegralFillMode: on
Figure 8-15
Example - setIntegralFillMode: Off
repaint, update - update view
Syntax:
ReturnValue = CallCWMethod(GraphVarName, "repaint")
ReturnValue = CallCWMethod(GraphVarName, "update")
Description:
Using this function, you can manually refresh the display.
SINUMERIK Integrate Run MyScreens
Programming Manual, 10/2020, A5E40869575B AD
245
Graphic and logic elements
8.5 SIEsGraphCustomWidget
Parameters:
GraphVarName
Name of the display variable which contains a SlEsGraph-
CustomWidget
Return Value
Error code (bool): TRUE = successful
• update()
The function refreshes the view, assuming that the Widget refresh is not deactivated, and the
Widget is not hidden. The function is optimized so that the application performance is
maintained, and the view does not flicker as a result of excessively high refresh rates.
• repaint()
The function refreshes the view directly after the function call. Therefore, you should only
use the repaint function if an immediate refresh is absolutely necessary, e.g. for animation
purposes
It is recommended that you always work with the update() function. Internally, the
SlEsGraphCustomWidget always works with the function update() e.g. for setView().
addPoint - add point to a contour
Syntax:
ReturnValue = CallCWMethod(GraphVarName, "addPoint", x, y)
ReturnValue = CallCWMethod(GraphVarName, "addPoint", x, y, DummyPoint)
Description:
Adds a point to the currently selected contour Further, you can set a dummy point;
although it does not show up in the drawing, it can be positioned with the cursor.
Parameters:
GraphVarName
Name of the display variable which contains a SlEsGraph-
CustomWidget
Return Value
Error code (bool): TRUE = successful
x
x coordinate (double)
y
y coordinate (double)
DummyPoint
Point is treated as invisible (bool): TRUE = yes
addLine - add line to a contour
Syntax:
ReturnValue = CallCWMethod(GraphVarName, "addLine", x1, y1, x2, y2)
Description:
Adds a line to the currently selected contour
Parameters:
GraphVarName
Name of the display variable which contains a SlEsGraph-
CustomWidget
Return Value
Error code (bool): TRUE = successful
x1
x coordinate of the starting point (double)
y1
y coordinate of the starting point (double)
x2
x coordinate of the end point (double)
y2
y coordinate of the end point (double)
addRect - add rectangle to a contour
Syntax:
ReturnValue = CallCWMethod(GraphVarName, "addRect", x1, y1, x2, y2)
Description:
Adds a rectangle to the currently selected contour.
SINUMERIK Integrate Run MyScreens
246
Programming Manual, 10/2020, A5E40869575B AD
Graphic and logic elements
8.5 SIEsGraphCustomWidget
Parameters:
GraphVarName
Name of the display variable which contains a SlEsGraph-
CustomWidget
Return Value
Error code (bool): TRUE = successful
x1
left-hand edge (double)
y1
left-hand edge (double)
x2
right-hand edge (double)
y2
lower edge (double)
addRoundedRect - add rectangle with rounded corners to a contour
Syntax:
ReturnValue = CallCWMethod(GraphVarName, "addRoundedRect", x1, y1, x2,
y2, r)
Description:
Adds a rectangle with rounded off corners to the currently selected contour.
Parameters:
GraphVarName
Name of the display variable which contains a SlEsGraph-
CustomWidget
Return Value
Error code (bool): TRUE = successful
x1
left-hand edge (double)
y1
upper edge (double)
x2
upper edge (double)
y2
upper edge (double)
r
Radius (double)
addElipse - add ellipse to a contour
Syntax:
ReturnValue = CallCWMethod(GraphVarName, "addEllipse", x1, y1, x2, y2, radius)
Description:
Adds an ellipse to the currently selected contour.
Parameters:
GraphVarName
Name of the display variable which contains a SlEsGraph-
CustomWidget
Return Value
Error code (bool): TRUE = successful
x1
left-hand edge (double)
y1
upper edge (double)
x2
right-hand edge (double)
y2
lower edge (double)
Radius
Radius (double)
addCircle - add circle to a contour
Syntax:
ReturnValue = CallCWMethod(GraphVarName, "addCircle", x, y, radius)
Description:
Adds a circle to the currently selected contour
SINUMERIK Integrate Run MyScreens
Programming Manual, 10/2020, A5E40869575B AD
247
Graphic and logic elements
8.5 SIEsGraphCustomWidget
Parameters:
GraphVarName
Name of the display variable which contains a SlEsGraph-
CustomWidget
Return Value
Error code (bool): TRUE = successful
x
left-hand edge (double)
y
upper edge (double)
Radius
Radius (double)
addArc - add arc to a contour
Syntax:
ReturnValue = CallCWMethod(GraphVarName, "addArc", x1, y1, x2, y2, StartAn-
gle, SpanAngle
Description:
Adds an arc to the currently selected contour
Parameters:
GraphVarName
Name of the display variable which contains a SlEsGraph-
CustomWidget
Return Value
Error code (bool): TRUE = successful
x1
left-hand edge (double)
y1
upper edge (double)
x2
right-hand edge (double)
y2
lower edge (double)
StartAngle
Starting angle in degrees (double)
SpanAngle
Opening angle in degrees (double)
addText - add text to a contour
Syntax:
ReturnValue = CallCWMethod(GraphVarName, "addText", x, y, Text)
Description:
Adds a text to the currently selected contour
Parameters:
GraphVarName
Name of the display variable which contains a SlEsGraph-
CustomWidget
Return Value
Error code (bool): TRUE = successful
x
left-hand edge (double)
y
upper edge (double)
Text
Text (QString)
setPenWidth - sets the pen width
Syntax:
ReturnValue = CallCWMethod(GraphVarName, "setPenWidth") ReturnValue =
CallCWMethod(GraphVarName, "setPenWidth", width)
Description:
Defines the pen width from the instant that the function was called for the fol-
lowing objects that were added to the actual contour.
Parameters:
GraphVarName
Name of the display variable which contains a SlEsGraph-
CustomWidget
Return Value
Error code (bool): TRUE = successful
width
Pen width (double).
If a pen width is not specified, then the default pen width
is set.
SINUMERIK Integrate Run MyScreens
248
Programming Manual, 10/2020, A5E40869575B AD
Graphic and logic elements
8.5 SIEsGraphCustomWidget
setPenStyle - sets the pen style
Syntax:
ReturnValue = CallCWMethod(GraphVarName, "setPenStyle")
ReturnValue = CallCWMethod(GraphVarName, "setPenStyle", style)
Description:
Defines pen style from the instant that the function is called for the following
objects that are added to the actual contour.
Parameters:
GraphVarName
Name of the display variable which contains a SlEsGraph-
CustomWidget
Return Value
Error code (bool): TRUE = successful
style
1 : Solid line (___
)
2 : Interrupted line (_ _)
3 : Dotted line (...)
4 : Line-point-line (_._)
5 : Line-point-point (_..)
setPenColor - sets the pen color
Syntax:
ReturnValue = CallCWMethod(GraphVarName, "setPenColor")
ReturnValue = CallCWMethod(GraphVarName, "setPenColor", Color)
Description:
Defines the pen color from the instant that the function was called for the follow-
ing objects that were added to the actual contour.
Parameters:
GraphVarName
Name of the display variable which contains a SlEsGraph-
CustomWidget
Return Value
Error code (bool): TRUE = successful
Color
Value to be set (QString) as RGB value in the form
"#RRGGBB", for example, "#04B7FB"
setFillColor - set fill color
Syntax:
ReturnValue = CallCWMethod(GraphVarName, "setFillColor")
ReturnValue = CallCWMethod(GraphVarName, "setFillColor", Color)
Description:
Defines the fill color from the instant that the function was called for the following
objects that were added to the actual contour.
Parameters:
GraphVarName
Name of the display variable which contains a SlEsGraph-
CustomWidget
Return Value
Error code (bool): TRUE = successful
Color
Value to be set (QString) as RGB value in the form
"#RRGGBB", for example, "#04B7FB"
setCursorPosition - position cursor
Syntax:
ReturnValue = CallCWMethod(GraphVarName, "setCursorPosition", x, y)
Description:
Sets the cursor to the specified position.
SINUMERIK Integrate Run MyScreens
Programming Manual, 10/2020, A5E40869575B AD
249
Graphic and logic elements
8.5 SIEsGraphCustomWidget
Parameters:
GraphVarName
Name of the display variable which contains a SlEsGraph-
CustomWidget
Return Value
Error code (bool): TRUE = successful
x
x coordinate (double)
y
y coordinate (double)
Note
This function automatically refreshes the display.
setCursorPositionY2Cursor - position cursor referred to the second Y axis (right)
Syntax:
ReturnValue = CallCWMethod(GraphVarName, "setCursorPositionY2", x, y2)
Description:
Sets the cursor to the specified position referred to the second Y axis (right).
Parameters:
GraphVarName
Name of the display variable which contains a SlEsGraph-
CustomWidget
Return Value
Error code (bool): TRUE = successful
x
x coordinate (double)
y2
Y coordinate referred to the second Y axis (right) (double)
Note
This function automatically refreshes the display.
setCursorOnContour - position cursor on contour
Syntax:
ReturnValue = CallCWMethod(GraphVarName, "setCursorOnContour")
ReturnValue = CallCWMethod(GraphVarName, "setCursorOnContour", Contour-
Name)
Description:
Sets the cursor to the last cursor position within a contour.
Parameters:
GraphVarName
Name of the display variable which contains a SlEsGraph-
CustomWidget
Return Value
Error code (bool): TRUE = successful
ContourName
Name of the contour (QString).
If a contour is not specified, then the call automatically
refers to the currently selected contour.
Note
This function automatically refreshes the display.
SINUMERIK Integrate Run MyScreens
250
Programming Manual, 10/2020, A5E40869575B AD