Intel 64 and IA-32 Architectures. Software Developer’s Manual (2026) - page 57

DEBUG, BRANCH PROFILE, TSC, AND INTEL® RESOURCE DIRECTOR TECHNOLOGY (INTEL® RDT) FEATURES
CPUID.0FH.01H:EAX[7:0]: Encode counter width as offset from 24b. See Section 20.18.5.2 for details. Bits 31:11
of EAX are reserved.
CPUID.0FH.01H:EAX[8]: If 1, indicates the presence of an overflow bit in the IA32_QM_CTR MSR. See Section
20.18.5.2 for details. Bits 31:11 of EAX are reserved.
CPUID.0FH.01H:EAX[9]: If 1, indicates the presence of non-CPU agent Intel RDT CMT support. See Section 20.20
for details. Bits 31:11 of EAX are reserved.
CPUID.0FH.01H:EAX[10]:If 1, indicates the presence of non-CPU agent Intel RDT MBM support. See Section 20.20
for details. Bits 31:11 of EAX are reserved.
For each supported Cache Monitoring resource type, hardware supports only a finite number of RMIDs.
CPUID.0FH.01H:ECX enumerates the highest RMID value that can be monitored with this resource type, see Figure
20-21.
CPUID.0FH.01H:EDX specifies a bit vector that is used to look up the EventID (See Figure 20-22 and Table 20-18)
that software must program with IA32_QM_EVTSEL in order to retrieve event data. After software configures
IA32_QMEVTSEL with the desired RMID and EventID, it can read the resulting data from IA32_QM_CTR. The raw
numerical value reported from IA32_QM_CTR can be converted to the final value (occupancy in bytes or bandwidth
in bytes per sampled time period) by multiplying the counter value by the value from CPUID.0FH.01H:EBX, see
Figure 20-21.
EventTypeBitMask
31
3
2
1
0
EDX
Reserved
L3 Occupancy
L3 Total BW
L3 Local BW
Figure 20-22. L3 Cache Monitoring Capability Enumeration Event Type Bit Vector (CPUID.0FH.01H )
20.18.5.1 Cache Monitoring Technology
On processors for which Cache Monitoring Technology supports the L3 cache occupancy event,
CPUID.0FH.01H:EDX returns with bit 0 set. The corresponding event ID is shown in Table 20-18. The L3 occupancy
data accumulated in the IA32_QM_CTR MSR can be converted to total occupancy (in bytes) by multiplying with
CPUID.0FH.01H:EBX.
Event codes for Cache Monitoring Technology are discussed in the next section.
20.18.5.2 Memory Bandwidth Monitoring
On processors that monitoring supports Memory Bandwidth Monitoring using ResID=1 (L3), two additional bits are
defined in the vector at CPUID.0FH.01H:EDX:
• CPUID.0FH.01H:EDX[1]: indicates the L3 total external bandwidth monitoring event is supported if set. This
event monitors the L3 total external bandwidth to the next level of the cache hierarchy, including all demand
and prefetch misses from the L3 to the next hierarchy of the memory system. In most platforms, this
represents memory bandwidth.
• CPUID.0FH.01H:EDX[2]: indicates L3 local memory bandwidth monitoring event is supported if set. This event
monitors the L3 external bandwidth satisfied by the local memory. In most platforms that support this event,
L3 requests are likely serviced by a memory system with non-uniform memory architecture. This allows
bandwidth to off-package memory resources to be tracked by subtracting local from total bandwidth (for
instance, bandwidth over QPI to a memory controller on another physical processor could be tracked by
subtraction). Note that it is not possible to read the local and total bandwidth atomically; multiple operations
are needed. Because of this, it is possible for the counters to change in between the two reads.
20-48
Vol. 3B

DEBUG, BRANCH PROFILE, TSC, AND INTEL® RESOURCE DIRECTOR TECHNOLOGY (INTEL® RDT) FEATURES
The corresponding Event ID is shown in Table 20-18. The L3 bandwidth data accumulated in IA32_QM_CTR can be
converted to total bandwidth (in bytes) using CPUID.0FH.01H:EBX.
Table 20-18. Monitoring Supported Event IDs
Event Type
Event ID
Context
L3 Cache Occupancy
01H
Cache Monitoring Technology
L3 Total External Bandwidth
02H
MBM
L3 Local External Bandwidth
03H
MBM
Reserved
All other event codes
N/A
A field is added to CPUID to enumerate the MBM counter width in platforms that support the extensible MBM
counter width feature.
• CPUID.0FH.01H:EAX[7:0]: Encode counter width as offset from 24b in bits[7:0]. In EAX bits 7:0, the counter
width is encoded as an offset from 24b. A value of zero in this field means 24-bit counters are supported. A
value of 8 indicates that 32-bit counters are supported, as in the 3rd generation Intel Xeon Scalable Processor
Family. With this enumerable counter width, the requirement that software polls at 1Hz is removed. Software
may poll at a varying rate with a reduced risk of rollover. Under typical conditions, rollover will likely require
hundreds of seconds (though this value is not explicitly specified and may vary and decrease in future
processor generations as memory bandwidths increase). Suppose software seeks to ensure that rollover does
not occur more than once between samples. In that case, sampling at 1Hz while consuming the enumerated
counter widths' worth of data will provide this guarantee for a specific platform and counter width under all
conditions.
• CPUID.0FH.01H:EAX[8]: Enumeration of the presence of an overflow bit in the IA32_QM_CTR MSR via EAX
bit[8]. Software that uses the MBM event retrieval MSR interface should be updated to comprehend this new
format, which enables up to 62-bit MBM counters to be provided by future platforms. Higher-level software that
consumes the resulting bandwidth values is not expected to be affected. An overflow bit is defined in the
IA32_QM_CTR MSR, bit 61, if CPUID.0FH.01H:EAX[8] is set. This rollover bit will be set on overflow of the MBM
counters and reset upon read. Current processors do not support this capability.
20.18.6 Monitoring Resource RMID Association
After Monitoring and sub-features have been enumerated, software can begin using the monitoring features. The
first step is to associate a given software thread (or multiple threads as part of an application, VM, group of appli-
cations or other abstraction) with an RMID.
Note that the process of associating an RMID with a given software thread is the same for all shared resource moni-
toring features (CMT, MBM), and a given RMID number has the same meaning from the viewpoint of any logical
processors in a package. Stated another way, a thread may be associated in a 1:1 mapping with an RMID, and that
RMID may allow cache occupancy, memory bandwidth information or other monitoring data to be read back later
with monitoring event codes (retrieving data is discussed in a previous section).
The association of an application thread with an RMID requires an OS to program the per-logical-processor MSR
IA32_PQR_ASSOC at context swap time (updates may also be made at any other arbitrary points during program
execution such as application phase changes). The IA32_PQR_ASSOC MSR specifies the active RMID that moni-
toring hardware will use to tag internal operations, such as L3 cache requests. The layout of the MSR is shown in
Figure 20-23. Software specifies the active RMID to monitor in the IA32_PQR_ASSOC.RMID field. The width of the
RMID field can vary from one implementation to another, and is derived from Ceil (LOG2 (1 +
CPUID.0FH.00H:EBX[31:0])). The value of IA32_PQR_ASSOC after power-on is 0.
Vol. 3B
20-49

DEBUG, BRANCH PROFILE, TSC, AND INTEL® RESOURCE DIRECTOR TECHNOLOGY (INTEL® RDT) FEATURES
63
32
31
0
Reserved
CLOS
Reserved
RMID
IA32_PQR_ASSOC
Width of IA32_PQR_ASSOC.RMID field: Ceil (LOG2 (1 + CPUID.0FH.00H:EBX[31:0]))
Width of IA32_PQR_ASSOC.CLOS field: CLOS_MAX = max of all valid RDT Allocation ResID.EDX[15:0] sub-leaves,
CLOS_WIDTH = Ceil(Log2(CLOS_MAX +1))
Figure 20-23. IA32_PQR_ASSOC MSR
In the initial implementation, the width of the RMID field is up to 10 bits wide, zero-referenced and fully encoded.
However, software must use CPUID to query the maximum RMID supported by the processor. If a value larger than
the maximum RMID is written to IA32_PQR_ASSOC.RMID, a #GP(0) fault will be generated.
RMIDs have a global scope within the physical package- if an RMID is assigned to one logical processor then the
same RMID can be used to read multiple thread attributes later (for example, L3 cache occupancy or external
bandwidth from the L3 to the next level of the cache hierarchy). In a multiple LLC platform the RMIDs are to be
reassigned by the OS or VMM scheduler when an application is migrated across LLCs.
Note that in a situation where Monitoring supports multiple resource types, some upper range of RMIDs (e.g., RMID
31) may only be supported by one resource type but not by another resource type.
20.18.7 Monitoring Resource Selection and Reporting Infrastructure
The reporting mechanism for Cache Monitoring Technology and other related features is architecturally exposed as
an MSR pair that can be programmed and read to measure various metrics such as the L3 cache occupancy (CMT)
and bandwidths (MBM) depending on the level of Monitoring support provided by the platform. Data is reported
back on a per-RMID basis. These events do not trigger based on event counts or trigger APIC interrupts (e.g., no
Performance Monitoring Interrupt occurs based on counts). Rather, they are used to sample counts explicitly.
The MSR pair for the shared resource monitoring features (CMT, MBM) is separate from and not shared with archi-
tectural PerfMon counters, meaning software can use these monitoring features simultaneously with the PerfMon
counters.
Access to the aggregated monitoring information is accomplished through the following programmable monitoring
MSRs:
• IA32_QM_EVTSEL: This MSR provides a role similar to the event select MSRs for programmable performance
monitoring described in Chapter 18. The simplified layout of the MSR is shown in Figure 20-24.
IA32_QM_EVTSEL.EvtID (bits 7:0) specifies an event code of a supported resource type for hardware to report
monitored data associated with IA32_QM_EVTSEL.RMID (bits 41:32). Software can configure
IA32_QM_EVTSEL.RMID with any RMID that is active within the physical processor. The width of
IA32_QM_EVTSEL.RMID matches that of IA32_PQR_ASSOC.RMID. Supported event codes for the
IA32_QM_EVTSEL register are shown in Table 20-18. Note that valid event codes may not necessarily map
directly to the bit position used to enumerate support for the resource via CPUID.
Software can program an RMID / Event ID pair into the IA32_QM_EVTSEL MSR bit field to select an RMID to
read a particular counter for a given resource. The currently supported list of Monitoring Event IDs is discussed
in Section 20.18.5, which covers feature-specific details.
Thread access to the IA32_QM_EVTSEL and IA32_QM_CTR MSR pair should be serialized (that is, treated as a
critical section under lock) to avoid situations where one thread changes the RMID/EvtID just before another
thread reads monitoring data from IA32_QM_CTR.
• IA32_QM_CTR: This MSR reports monitored data when available. It contains three bit fields. If software
configures an unsupported RMID or event type in IA32_QM_EVTSEL, then IA32_QM_CTR.Error (bit 63) will be
set, indicating there is no valid data to report. If IA32_QM_CTR.Unavailable (bit 62) is set, it indicates
monitored data for the RMID is not available, and IA32_QM_CTR.data (bits 61:0) should be ignored. Therefore,
IA32_QM_CTR.data (bits 61:0) is valid only if bits 63 and 62 are both clear. The IA32_QM_CTR.Overflow (bit
61) is present if CPUID.0FH.01H:EAX[8] is set. This bit is set on overflow of the MBM counters and will reset
20-50
Vol. 3B

DEBUG, BRANCH PROFILE, TSC, AND INTEL® RESOURCE DIRECTOR TECHNOLOGY (INTEL® RDT) FEATURES
upon read. For Cache Monitoring Technology, software can convert IA32_QM_CTR.data into cache occupancy
or bandwidth metrics expressed in bytes by multiplying with the conversion factor from CPUID.0FH.01H:EBX.
63
42
41
32
31
8
7
0
Reserved
RMID
Reserved
EvtID
IA32_QM_EVTSEL
63
62
61
60
0
E
U
O
Resource Monitoring Data
IA32_QM_CTR
Figure 20-24. IA32_QM_EVTSEL and IA32_QM_CTR MSRs
20.18.8 Monitoring Programming Considerations
Figure 20-25 illustrates how system software can program IA32_QOSEVTSEL and IA32_QM_CTR to perform
resource monitoring.
System Software
RMI
D
Event ID
Counter Data
63
41
32
7
0
63
62
61
0
Reserved
RMI
D
Reserved
EvtID
Monitoring Data
IA32_QOSEVTSEL MSR
IA32_QM_CTR MSR
Overflow
Resource Monit
oring ID
Event ID
Availability
Error
SDM30209
Figure 20-25. Software Usage of Cache Monitoring Resources
Though the field provided in IA32_QM_CTR allows for up to 62 bits of data to be returned, often a subset of bits are
used. With Cache Monitoring Technology for instance, the number of bits used is the base-two logarithm of the
total cache size divided by the Upscaling Factor from CPUID.
In Memory Bandwidth Monitoring, the initial counter size is 24 bits, and retrieving the value at 1Hz or faster is suffi-
cient to ensure at most one rollover per sampling period. Any changes to counter width are enumerated to soft-
ware; see Section 20.18.5.2 for details.
Vol. 3B
20-51
DEBUG, BRANCH PROFILE, TSC, AND INTEL® RESOURCE DIRECTOR TECHNOLOGY (INTEL® RDT) FEATURES
20.18.8.1 Monitoring Dynamic Configuration
Both the IA32_QM_EVTSEL and IA32_PQR_ASSOC registers are accessible and modifiable at any time during
execution using RDMSR/WRMSR unless otherwise noted. When writing to these MSRs a #GP(0) will be generated
if any of the following conditions occur:
• A reserved bit is modified,
• An RMID exceeding the maximum RMID is used.
20.18.8.2 Monitoring Operation With Power Saving Features
Some advanced power management features such as deep package C-states may shrink the L3 cache and cause
CMT occupancy count to be reduced. MBM bandwidth counts may increase due to flushing cached data out of L3.
20.18.8.3 Monitoring Operation with Other Operating Modes
The states in IA32_PQR_ASSOC and monitoring counter are unmodified across an SMI delivery. Thus, the execu-
tion of SMM handler code and SMM handler’s data can manifest as spurious contribution in the monitored data.
It is possible for an SMM handler to minimize the impact on of spurious contribution in the QOS monitoring counters
by reserving a dedicated RMID for monitoring the SMM handler. Such an SMM handler can save the previously
configured QOS Monitoring state immediately upon entering SMM, and restoring the QOS monitoring state back to
the prev-SMM RMID upon exit.
20.18.8.4 Monitoring Operation with RAS Features
In general, the Reliability, Availability, and Serviceability (RAS) features present in Intel Platforms are not expected
to significantly affect shared resource monitoring counts. In cases where software RAS features cause memory
copies or cache accesses, these may be tracked and may influence the shared resource monitoring counter values.
20.19 INTEL® RESOURCE DIRECTOR TECHNOLOGY (INTEL® RDT) ALLOCATION
FEATURES
The Intel Resource Director Technology (Intel RDT) feature set provides a set of allocation (resource control) capa-
bilities including Cache Allocation Technology (CAT) and Code and Data Prioritization (CDP). The Intel Xeon
processor E5 v4 family (and a subset of communication-focused processors in the Intel Xeon E5 v3 family) intro-
duce capabilities to configure and make use of the Cache Allocation Technology (CAT) mechanisms on the L3 cache.
Certain Intel Atom processors also provide support for control over the L2 cache, with capabilities as described
below. The programming interface for Cache Allocation Technology and for the more general allocation capabilities
are described in the rest of this chapter. The CAT and CDP capabilities, where architecturally supported, may be
detected and enumerated in software using the CPUID instruction, as described in this chapter.
The Intel Xeon Scalable Processor Family introduces the Memory Bandwidth Allocation (MBA) feature which
provides indirect control over the memory bandwidth available to CPU cores, and is discussed later in this chapter.
20.19.1 Introduction to Cache Allocation Technology (CAT)
Cache Allocation Technology enables an Operating System (OS), Hypervisor /Virtual Machine Manager (VMM) or
similar system service management agent to specify the amount of cache space into which an application can fill
(as a hint to hardware - certain features such as power management may override CAT settings). Specialized user-
level implementations with minimal OS support are also possible, though not necessarily recommended (see notes
below for OS/Hypervisor with respect to ring 3 software and virtual guests). Depending on the processor family, L2
or L3 cache allocation capability may be provided, and the technology is designed to scale across multiple cache
levels and technology generations.
Software can determine which levels are supported in a given platform programmatically using CPUID as described
in the following sections.
20-52
Vol. 3B
DEBUG, BRANCH PROFILE, TSC, AND INTEL® RESOURCE DIRECTOR TECHNOLOGY (INTEL® RDT) FEATURES
The CAT mechanisms defined in this document provide the following key features:
• A mechanism to enumerate platform Cache Allocation Technology capabilities and available resource types that
provides CAT control capabilities. For implementations that support Cache Allocation Technology, CPUID
provides enumeration support to query which levels of the cache hierarchy are supported and specific CAT
capabilities, such as the max allocation bitmask size.
• A mechanism for the OS or Hypervisor to configure the amount of a resource available to a particular Class of
Service via a list of allocation bitmasks.
• Mechanisms for the OS or Hypervisor to signal the Class of Service to which an application belongs.
• Hardware mechanisms to guide the LLC fill policy when an application has been designated to belong to a
specific Class of Service.
Note that for many usages, an OS or Hypervisor may not want to expose Cache Allocation Technology mechanisms
to Ring3 software or virtualized guests.
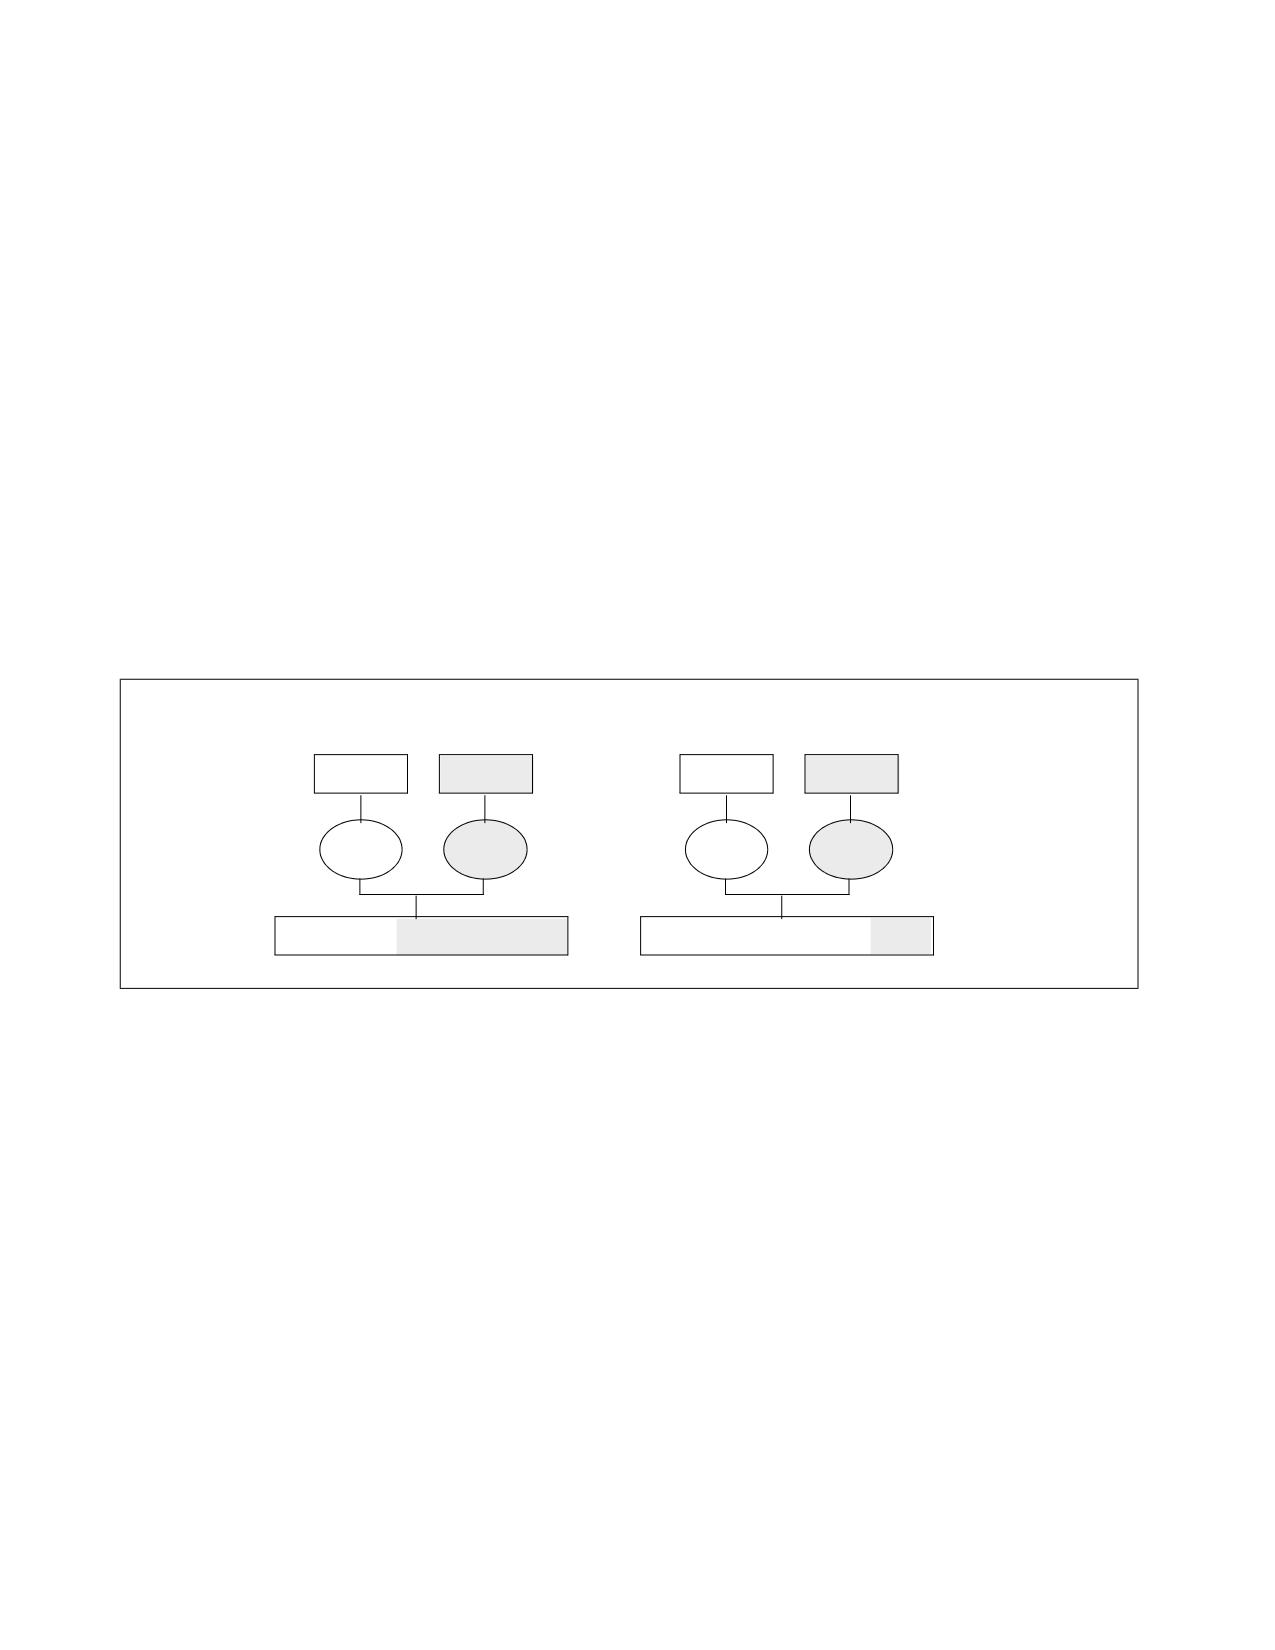
The Cache Allocation Technology feature enables more cache resources (i.e., cache space) to be made available for
high priority applications based on guidance from the execution environment as shown in Figure 20-26. The archi-
tecture also allows dynamic resource reassignment during runtime to further optimize the performance of the high
priority application with minimal degradation to the low priority app. Additionally, resources can be rebalanced for
system throughput benefit across uses cases of OSes, VMMs, containers, and other scenarios by managing the
CPUID and MSR interfaces. This section describes the hardware and software support required in the platform
including what is required of the execution environment (i.e., OS/VMM) to support such resource control. Note that
in Figure 20-26 the L3 Cache is shown as an example resource.
Without CAT
With CAT
Hi Pri App
Lo Pri App
Hi Pri App
Lo Pri App
Core 0
Core 1
Core 0
Core 1
Shared LLC, Low priority got more cache
Shared LLC, High priority got more cache
Figure 20-26. Cache Allocation Technology Enables Allocation of More Resources to High Priority Applications
20.19.2 Cache Allocation Technology Architecture
The fundamental goal of Cache Allocation Technology is to enable resource allocation based on application priority
or Class of Service (CLOS). The processor exposes a set of Classes of Service into which applications (or individual
threads) can be assigned. Cache allocation for the respective applications or threads is then restricted based on the
class with which they are associated. Each Class of Service can be configured using capacity bitmasks (CBMs)
which represent capacity and indicate the degree of overlap and isolation between classes. For each logical
processor there is a register exposed (referred to here as the IA32_PQR_ASSOC MSR or PQR) to allow the OS/VMM
to specify a CLOS when an application, thread or VM is scheduled.
The usage of Classes of Service (CLOS) are consistent across resources and a CLOS may have multiple resource
control attributes attached, which reduces software overhead at context swap time. Rather than adding new types
of CLOS tags per resource for instance, the CLOS management overhead is constant. Cache allocation for the indi-
cated application/thread/container/VM is then controlled automatically by the hardware based on the class and the
bitmask associated with that class. Bitmasks are configured via the IA32_resourceType_MASK_n MSRs, where
resourceType indicates a resource type (e.g., “L3” for the L3 cache) and “n” indicates a CLOS number.
The basic ingredients of Cache Allocation Technology are as follows:
• An architecturally exposed mechanism using CPUID to indicate whether CAT is supported, and what resource
types are available which can be controlled.
Vol. 3B
20-53

DEBUG, BRANCH PROFILE, TSC, AND INTEL® RESOURCE DIRECTOR TECHNOLOGY (INTEL® RDT) FEATURES
• For each available resourceType, CPUID also enumerates the total number of Classes of Services and the length
of the capacity bitmasks that can be used to enforce cache allocation to applications on the platform.
• An architecturally exposed mechanism to allow the execution environment (OS/VMM) to configure the behavior
of different classes of service using the bitmasks available.
• An architecturally exposed mechanism to allow the execution environment (OS/VMM) to assign a CLOS to an
executing software thread (i.e., associating the active CR3 of a logical processor with the CLOS in
IA32_PQR_ASSOC).
• Implementation-dependent mechanisms to indicate which CLOS is associated with a memory access and to
enforce the cache allocation on a per CLOS basis.
A capacity bitmask (CBM) provides a hint to the hardware indicating the cache space an application should be
limited to as well as providing an indication of overlap and isolation in the CAT-capable cache from other applica-
tions contending for the cache. The bit length of the capacity mask available generally depends on the configuration
of the cache and is specified in the enumeration process for CAT in CPUID (this may vary between models in a
processor family as well). Similarly, other parameters such as the number of supported CLOS may vary for each
resource type, and these details can be enumerated via CPUID.
M7
M6
M5
M4
M3
M2
M1
M0
CLOS0
A
A
A
A
A
A
A
A
Default Bitmask
CLOS1
A
A
A
A
A
A
A
A
CLOS2
A
A
A
A
A
A
A
A
CLOS3
A
A
A
A
A
A
A
A
M7
M6
M5
M4
M3
M2
M1
M0
CLOS0
A
A
A
A
A
A
A
A
Overlapped Bitmask
CLOS1
A
A
A
A
CLOS2
A
A
CLOS3
A
M7
M6
M5
M4
M3
M2
M1
M0
CLOS0
A
A
A
A
Isolated Bitmask
CLOS1
A
A
CLOS2
A
CLOS3
A
Figure 20-27. Examples of Cache Capacity Bitmasks
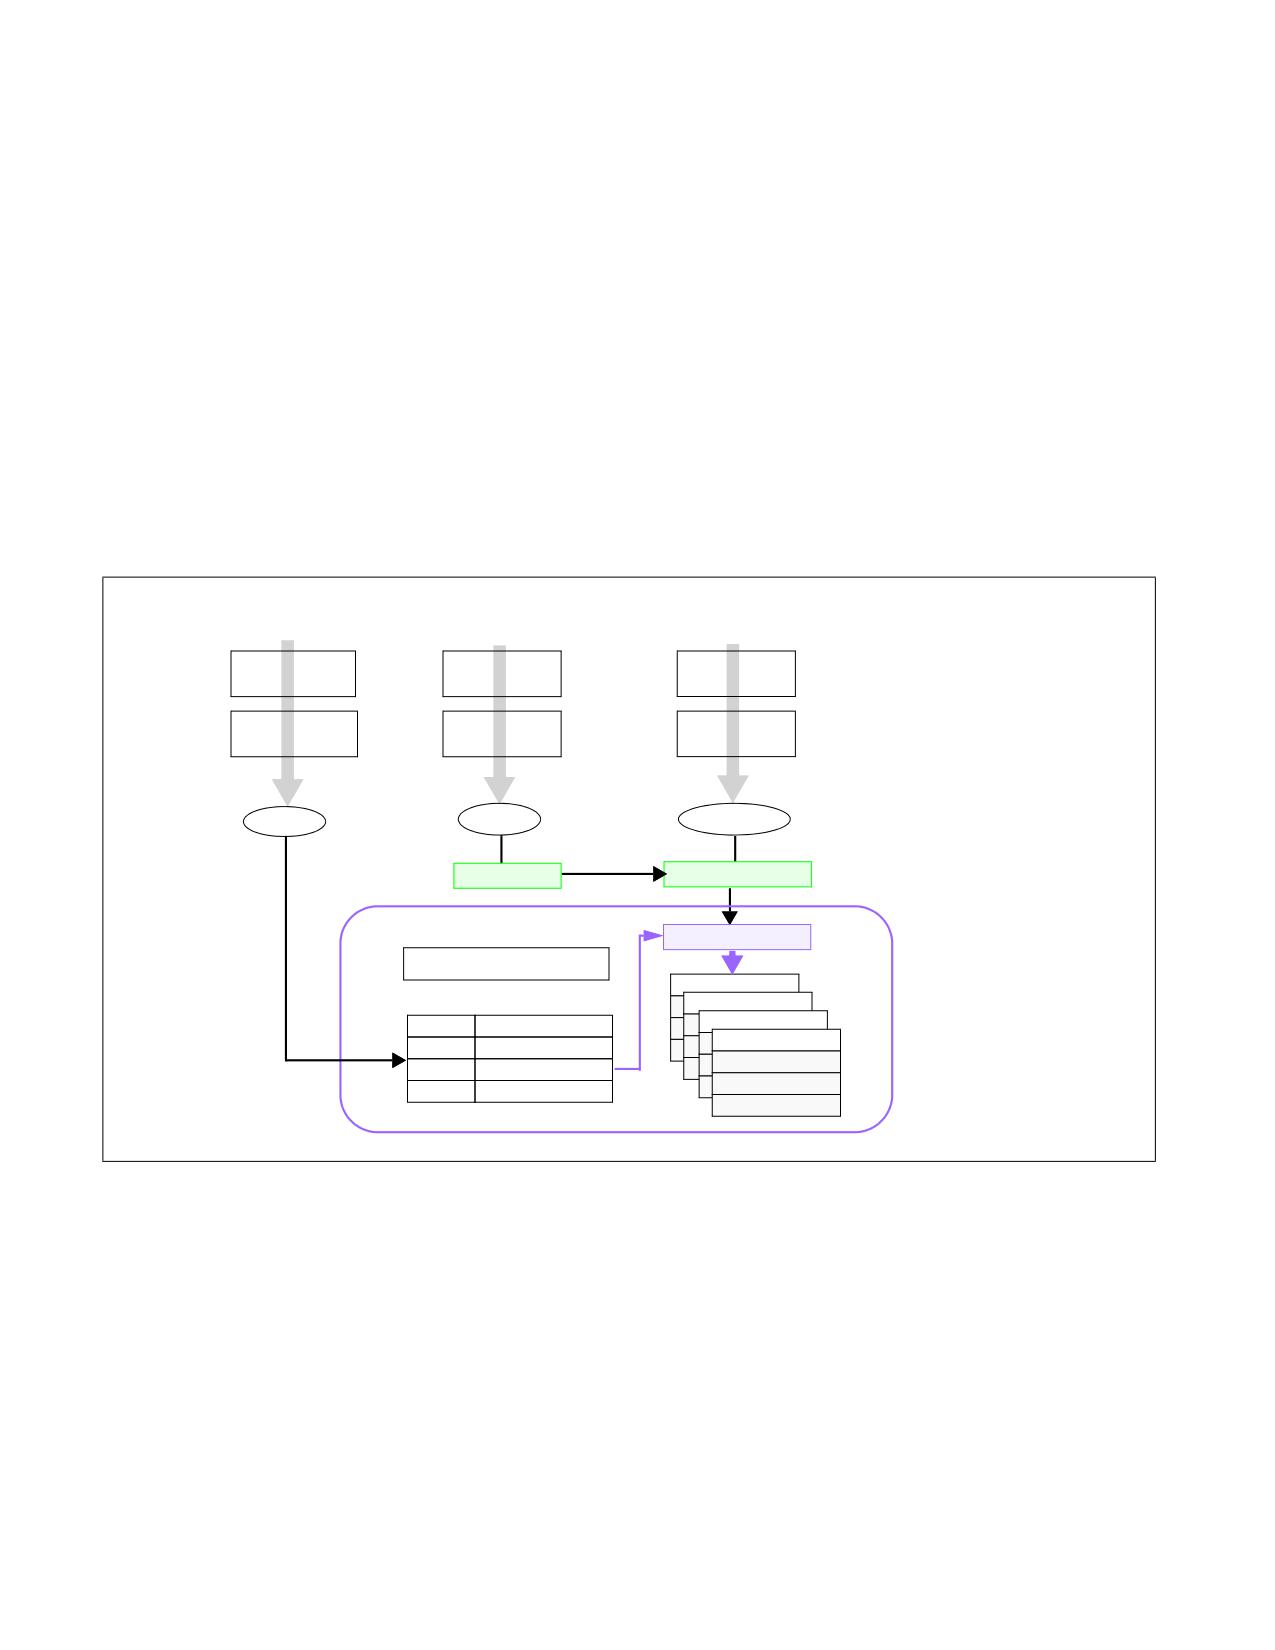
Sample cache capacity bitmasks for a bit length of 8 are shown in Figure 20-27. Note that all (and only) contiguous
'1' combinations are allowed (e.g., FFFFH, 0FF0H, 003CH, etc.), unless otherwise non-contiguous capacity bitmask
support is specified in CPUID enumeration for the resource type. Attempts to program a value without contiguous
'1's (including zero) will result in a general protection fault (#GP(0)). It is generally expected that in way-based
implementations, one capacity mask bit corresponds to some number of ways in cache, but the specific mapping is
implementation-dependent. In all cases, a mask bit set to '1' specifies that a particular Class of Service can allocate
into the cache subset represented by that bit. A value of '0' in a mask bit specifies that a Class of Service cannot
20-54
Vol. 3B
DEBUG, BRANCH PROFILE, TSC, AND INTEL® RESOURCE DIRECTOR TECHNOLOGY (INTEL® RDT) FEATURES
allocate into the given cache subset. In general, allocating more cache to a given application is usually beneficial to
its performance.
Figure 20-27 also shows three examples of sets of Cache Capacity Bitmasks. For simplicity these are represented
as 8-bit vectors, though this may vary depending on the implementation and how the mask is mapped to the avail-
able cache capacity. The first example shows the default case where all 4 Classes of Service (the total number of
CLOS are implementation-dependent) have full access to the cache. The second case shows an overlapped case,
which would allow some lower-priority threads to share cache space with the highest priority threads. The third
case shows various non-overlapped partitioning schemes. As a matter of software policy for extensibility, CLOS0
should typically be considered and configured as the highest priority CLOS, followed by CLOS1, and so on, though
there is no hardware restriction enforcing this mapping. When the system boots all threads are initialized to
CLOS0, which has full access to the cache by default.
Though the representation of the CBMs looks similar to a way-based mapping they are independent of any specific
enforcement implementation (e.g., way partitioning.) Rather, this is a convenient manner to represent capacity,
overlap, and isolation of cache space. For example, executing a POPCNT instruction (population count of set bits)
on the capacity bitmask can provide the fraction of cache space that a class of service can allocate into. In addition
to the fraction, the exact location of the bits also shows whether the class of service overlaps with other classes of
service or is entirely isolated in terms of cache space used.
Enum/Confg
Association
Enforcement
Enumerate
OS Context
Application
Enforcement
Switch
Memory Request
Configure CBM for
Set Class of Service
Tag with Cache
each Class of Service
in IA32_PQR
Class of Service
Config
CLOS = 2
Mem Request
2
CLOS
Transaction
Cache Subsystem
Enforce Mask
Cache Allocation
Set 1
Set 2
CLOS 0
Capacity bitmask 3
Set n
CLOS 1
Capacity bitmask 3
way 1
CLOS 2
Capacity bitmask 3
CLOS 3
Capacity bitmask 3
way 16
Figure 20-28. Class of Service and Cache Capacity Bitmasks
Figure 20-28 shows how the Cache Capacity Bitmasks and the per-logical-processor Class of Service are logically
used to enable Cache Allocation Technology. All (and only) contiguous 1's in the CBM are permitted, unless other-
wise non-contiguous capacity bitmask support is specified in CPUID enumeration for the resource type. The length
of a CBM may vary from resource to resource or between processor generations and can be enumerated using
CPUID. From the available mask set and based on the goals of the OS/VMM (shared or isolated cache, etc.)
bitmasks are selected and associated with different classes of service. For the available Classes of Service the asso-
ciated CBMs can be programmed via the global set of CAT configuration registers (in the case of L3 CAT, via the
IA32_L3_MASK_n MSRs, where “n” is the Class of Service, starting from zero). In all architectural implementations
supporting CPUID it is possible to change the CBMs dynamically, during program execution, unless stated other-
wise by Intel.
Vol. 3B
20-55
DEBUG, BRANCH PROFILE, TSC, AND INTEL® RESOURCE DIRECTOR TECHNOLOGY (INTEL® RDT) FEATURES
The currently running application's Class of Service is communicated to the hardware through the per-logical-
processor PQR MSR (IA32_PQR_ASSOC MSR). When the OS schedules an application thread on a logical processor,
the application thread is associated with a specific CLOS (i.e., the corresponding CLOS in the PQR) and all requests
to the CAT-capable resource from that logical processor are tagged with that CLOS (in other words, the application
thread is configured to belong to a specific CLOS). The cache subsystem uses this tagged request information to
enforce QoS. The capacity bitmask may be mapped into a way bitmask (or a similar enforcement entity based on
the implementation) at the cache before it is applied to the allocation policy. For example, the capacity bitmask can
be an 8-bit mask and the enforcement may be accomplished using a 16-way bitmask for a cache enforcement
implementation based on way partitioning.
The following sections describe extensions of CAT such as Code and Data Prioritization (CDP), followed by details
on specific features such as L3 CAT, L3 CDP, L2 CAT, and L2 CDP. Depending on the specific processor a mix of
features may be supported, and CPUID provides enumeration capabilities to enable software to dynamically detect
the set of supported features.
20.19.3 Code and Data Prioritization (CDP) Technology
Code and Data Prioritization Technology is an extension of CAT. CDP enables isolation and separate prioritization of
code and data fetches to the L2 or L3 cache in a software configurable manner, depending on hardware support,
which can enable workload prioritization and tuning of cache capacity to the characteristics of the workload. CDP
extends Cache Allocation Technology (CAT) by providing separate code and data masks per Class of Service
(CLOS). Support for the L2 CDP feature and the L3 CDP features are separately enumerated (via CPUID) and sepa-
rately controlled (via remapping the L2 CAT MSRs or L3 CAT MSRs respectively). Section 20.19.6.3 and Section
20.19.7 provide details on enumerating, controlling, and enabling L3 and L2 CDP respectively, while this section
provides a general overview.
The L3 CDP feature was first introduced on the Intel Xeon E5 v4 family of server processors, as an extension to L3
CAT. The L2 CDP feature is first introduced on future Intel Atom family processors, as an extension to L2 CAT.
By default, CDP is disabled on the processor. If the CAT MSRs are used without enabling CDP, the processor oper-
ates in a traditional CAT-only mode. When CDP is enabled:
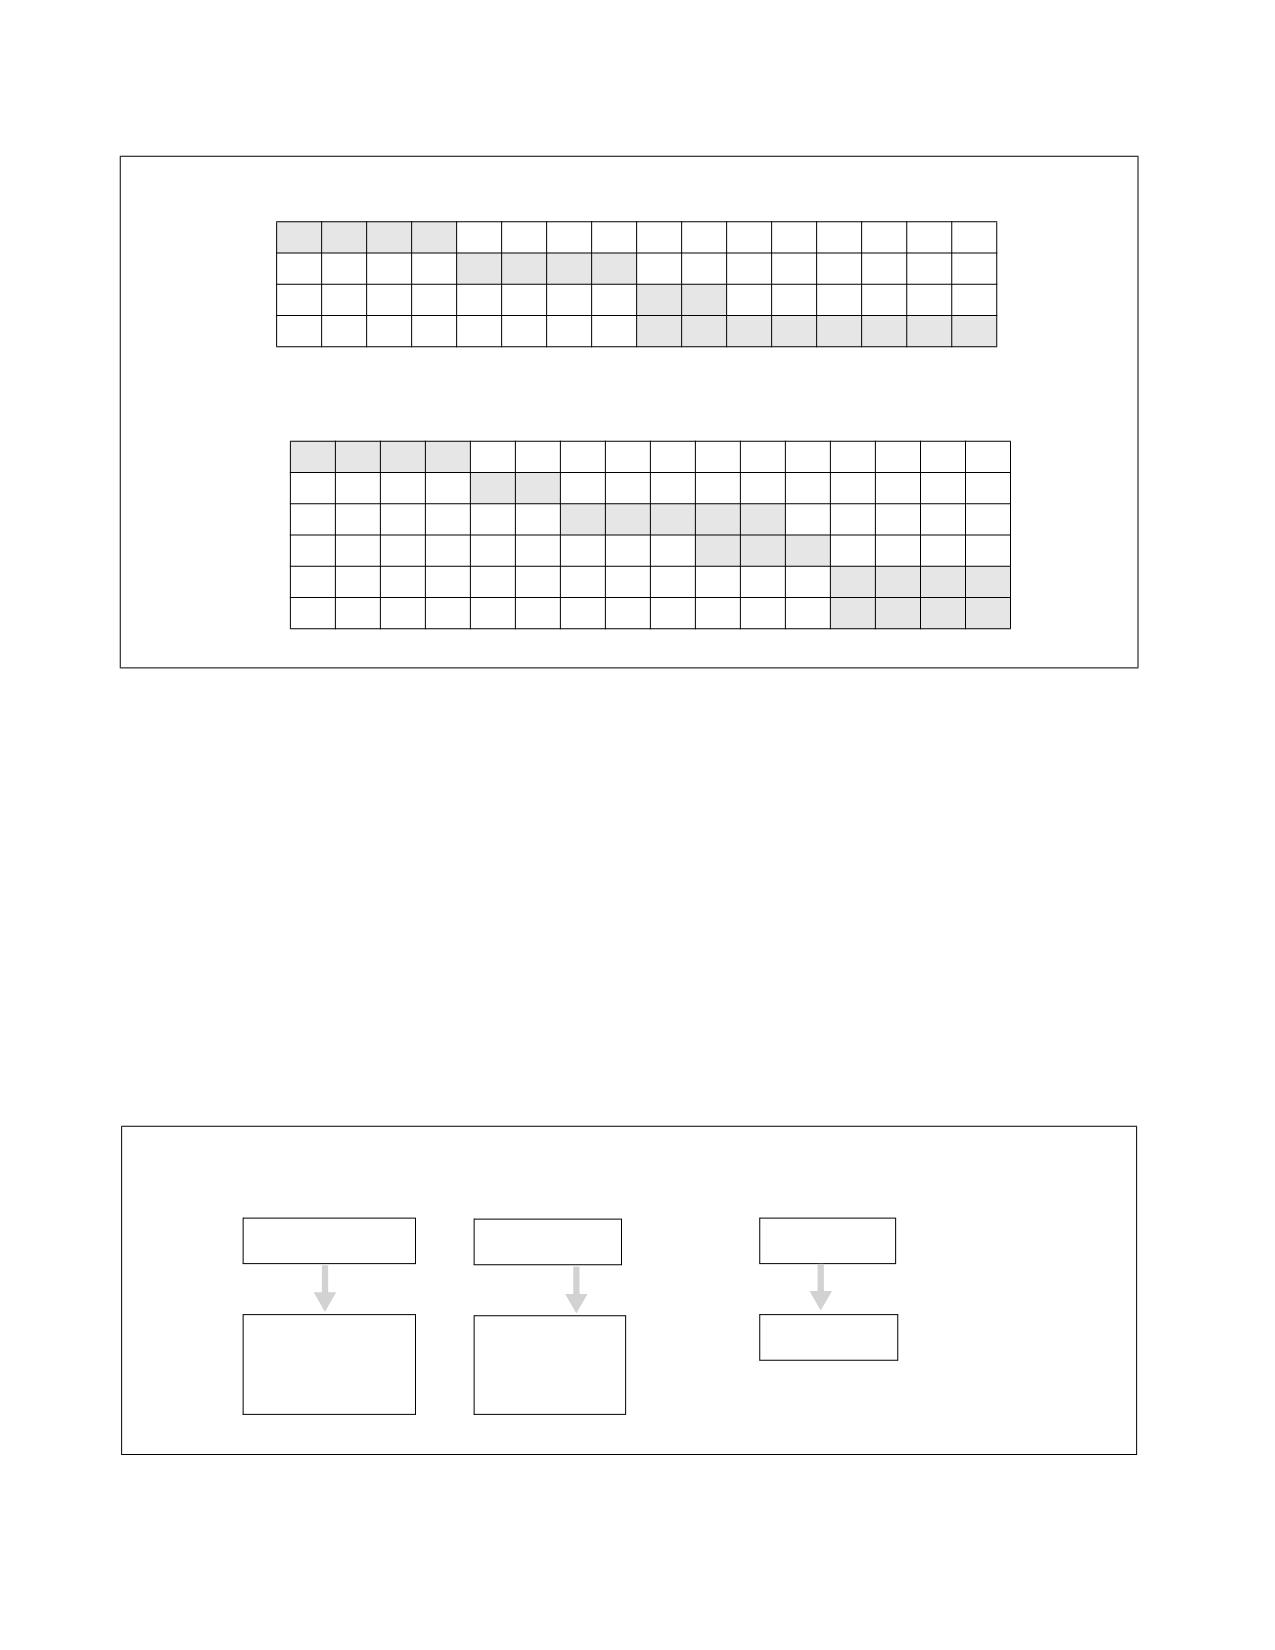
• The CAT mask MSRs are re-mapped into interleaved pairs of mask MSRs for data or code fetches (see
Figure 20-29).
• The range of CLOS for CAT is re-indexed, with the lower-half of the CLOS range available for CDP.
Using the CDP feature, virtual isolation between code and data can be configured on the L2 or L3 cache if desired,
similar to how some processor cache levels provide separate L1 data and L1 instruction caches.
Like the CAT feature, CDP may be dynamically configured by privileged software at any point during normal system
operation, including dynamically enabling or disabling the feature provided that certain software configuration
requirements are met (see Section 20.19.5).
An example of the operating mode of CDP is shown in Figure 20-29. Shown at the top are traditional CAT usage
models where capacity masks map 1:1 with a CLOS number to enable control over the cache space which a given
CLOS (and thus applications, threads or VMs) may occupy. Shown at the bottom are example mask configurations
where CDP is enabled, and each CLOS number maps 1:2 to two masks, one for code and one for data. This enables
code and data to be either overlapped or isolated to varying degrees either globally or on a per-CLOS basis,
depending on application and system needs.
20-56
Vol. 3B
DEBUG, BRANCH PROFILE, TSC, AND INTEL® RESOURCE DIRECTOR TECHNOLOGY (INTEL® RDT) FEATURES
Example of CAT-Only Usage - 16 bit Capacity Masks
CLOS0
1
1
1
1
0
0
0
0
0
0
0
0
0
0
0
0
CLOS1
0
0
0
0
1
1
1
1
0
0
0
0
0
0
0
0
Traditional
CLOS2
0
0
0
0
0
0
0
0
1
1
0
0
0
0
0
0
CAT
CLOS3
0
0
0
0
0
0
0
0
1
1
1
1
1
1
1
1
Example of Code/Data Prioritization Usage - 16 bit Capacity Masks
1
1
1
1
0
0
0
0
0
0
0
0
0
0
0
0
CLOS0.Data
0
0
0
0
1
1
0
0
0
0
0
0
0
0
0
0
CLOS0.Code
CAT with
0
0
0
0
0
0
1
1
1
1
1
0
0
0
0
0
CDP
CLOS1.Data
0
0
0
0
0
0
0
0
0
1
1
1
0
0
0
0
CLOS1.Code
0
0
0
0
0
0
0
0
0
0
0
0
1
1
1
1
Other CLOS.Data
Other CLOS.Code
0
0
0
0
0
0
0
0
0
0
0
0
1
1
1
1
Figure 20-29. Code and Data Capacity Bitmasks of CDP
When CDP is enabled, the existing mask space for CAT-only operation is split. As an example if the system supports
16 CAT-only CLOS, when CDP is enabled the same MSR interfaces are used, however half of the masks correspond
to code, half correspond to data, and the effective number of CLOS is reduced by half. Code/Data masks are
defined per-CLOS and interleaved in the MSR space as described in subsequent sections.
In cases where CPUID exposes a non-even number of supported Classes of Service for the CAT or CDP features,
software using CDP should use the lower matched pairs of code/data masks, and any upper unpaired masks should
not be used. As an example, if CPUID exposes 5 CLOS, when CDP is enabled then two code/data pairs are available
(masks 0/1 for CLOS[0] data/code and masks 2/3 for CLOS[1] data/code), however the upper un-paired mask
should not be used (mask 4 in this case) or undefined behavior may result.
20.19.4 Enabling Cache Allocation Technology Usage Flow
Figure 20-30 illustrates the key steps for OS/VMM to detect support of Cache Allocation Technology and enable
priority-based resource allocation for a CAT-capable resource.
On OS/VMM Initialization
Cache Allocation Configuration
On Context Switch
CQE Capability
Configure CBM
Set CLOS for scheduled
Enumeration
per CLOS
thread context
CPUID
WRMSR
WRMSR
CPUID.07H.00H:EBX[15]
IA32_L3_QOS_MASK_0
CPUID.10H.00H:EBX[31:1]
IA32_PQR_ASSOC
CPUID.10H.01H:EAX[4:0]
CPUID.10H.01H:EDX[15:0]
IA32_L3_QOS_MASK_n
CPUID.10H.01H:EBX[31:0]
Figure 20-30. Cache Allocation Technology Usage Flow
Vol. 3B
20-57

DEBUG, BRANCH PROFILE, TSC, AND INTEL® RESOURCE DIRECTOR TECHNOLOGY (INTEL® RDT) FEATURES
Enumeration and configuration of L2 CAT is similar to L3 CAT, however CPUID details and MSR addresses differ.
Common CLOS are used across the features.
20.19.4.1 Enumeration and Detection Support of Cache Allocation Technology
Software can query processor support of CAT capabilities by executing CPUID instruction with EAX = 07H, ECX =
0H as input. If CPUID.07H.00H:EBX.RDT_A[15] reports 1, the processor supports software control over shared
processor resources. Software must use CPUID.10H to enumerate additional details of available resource types,
classes of services and capability bitmasks. The programming interfaces provided by Cache Allocation Technology
include:
• CPUID.10H (Cache Allocation Technology Enumeration leaf) and its sub-functions provide information on
available resource types, and CAT capability for each resource type (see Section 20.19.4.2).
• IA32_L3_MASK_n: A range of MSRs is provided for each resource type, each MSR within that range specifying
a software-configured capacity bitmask for each class of service. For L3 with Cache Allocation support, the CBM
is specified using one of the IA32_L3_QOS_MASK_n MSR, where 'n' corresponds to a number within the
supported range of CLOS, i.e., the range between 0 and CPUID.10H.ResID:EDX[15:0], inclusive. See Section
20.19.4.3 for details.
• IA32_L2_MASK_n: A range of MSRs is provided for L2 Cache Allocation Technology, enabling software control
over the amount of L2 cache available for each CLOS. Similar to L3 CAT, a CBM is specified for each CLOS using
the set of registers, IA32_L2_QOS_MASK_n MSR, where 'n' ranges from zero to the maximum CLOS number
reported for L2 CAT in CPUID. See Section 20.19.4.3 for details.
The L2 mask MSRs are scoped at the same level as the L2 cache (similarly, the L3 mask MSRs are scoped at the
same level as the L3 cache). Software may determine which logical processors share an MSR (for instance local
to a core, or shared across multiple cores) by performing a write to one of these MSRs and noting which logical
threads observe the change. Example flows for a similar method to determine register scope are described in
Section 18.5.2, “System Software Recommendation for Managing CMCI and Machine Check Resources.”
Software may also use CPUID.04H to determine the maximum number of logical processor IDs that may share
a given level of the cache.
• IA32_PQR_ASSOC.CLOS: The IA32_PQR_ASSOC MSR provides a CLOS field that OS/VMM can use to assign a
logical processor to an available CLOS. The set of CLOS are common across all allocation features, meaning that
multiple features may be supported in the same processor without additional software CLOS management
overhead at context swap time. See Section 20.19.4.4 for details.
20.19.4.2 Cache Allocation Technology: Resource Type and Capability Enumeration
CPUID.10H (Cache Allocation Technology Enumeration leaf) provides two or more sub-functions:
• CAT Enumeration leaf sub-function 0 enumerates available resource types that support allocation control, i.e.,
by using CPUID.10H.00H. Each supported resource type is represented by a bit field in
CPUID.10H.00H:EBX[31:1]. The bit position of each set bit corresponds to a Resource ID (ResID), for instance
ResID=1 is used to indicate L3 CAT support, and ResID=2 indicates L2 CAT support. The ResID is also the sub-
leaf index that software must use to query details of the CAT capability of that resource type (see Figure
20-31).
CPUID.10H.00H Output: EAX: Reserved; ECX: Reserved; EDX: Reserved
31
6
5
4
3
2
1
0
C
M
R
L
L
EBX
Reserved
B
B
P
2
3
A
A
Figure 20-31. CPUID.10H.00H Available Resource Type Identification
20-58
Vol. 3B
DEBUG, BRANCH PROFILE, TSC, AND INTEL® RESOURCE DIRECTOR TECHNOLOGY (INTEL® RDT) FEATURES
- For ECX>0, EAX[4:0] reports the length of the capacity bitmask (ECX=1 or 2 for L3 CAT or L2 CAT respec-
tively). Add one to the return value to get the result, e.g., a value of 15 corresponds to the capacity bitmask
having length of 16 bits. Bits 31:5 of EAX are reserved.
• Sub-leaves of CPUID.10H with a non-zero ECX input matching a supported ResID enumerate the specific
enforcement details of the corresponding ResID. The capabilities enumerated include the length of the capacity
bitmasks and the number of Classes of Service for a given ResID. Software should query the capability of each
available ResID that supports CAT from a sub-leaf of leaf 10H using the sub-leaf index reported by the corre-
sponding non-zero bit in CPUID.10H.00H:EBX[31:1] in order to obtain additional feature details.
Figure 20-32. L3 Cache Allocation Technology and CDP Enumeration
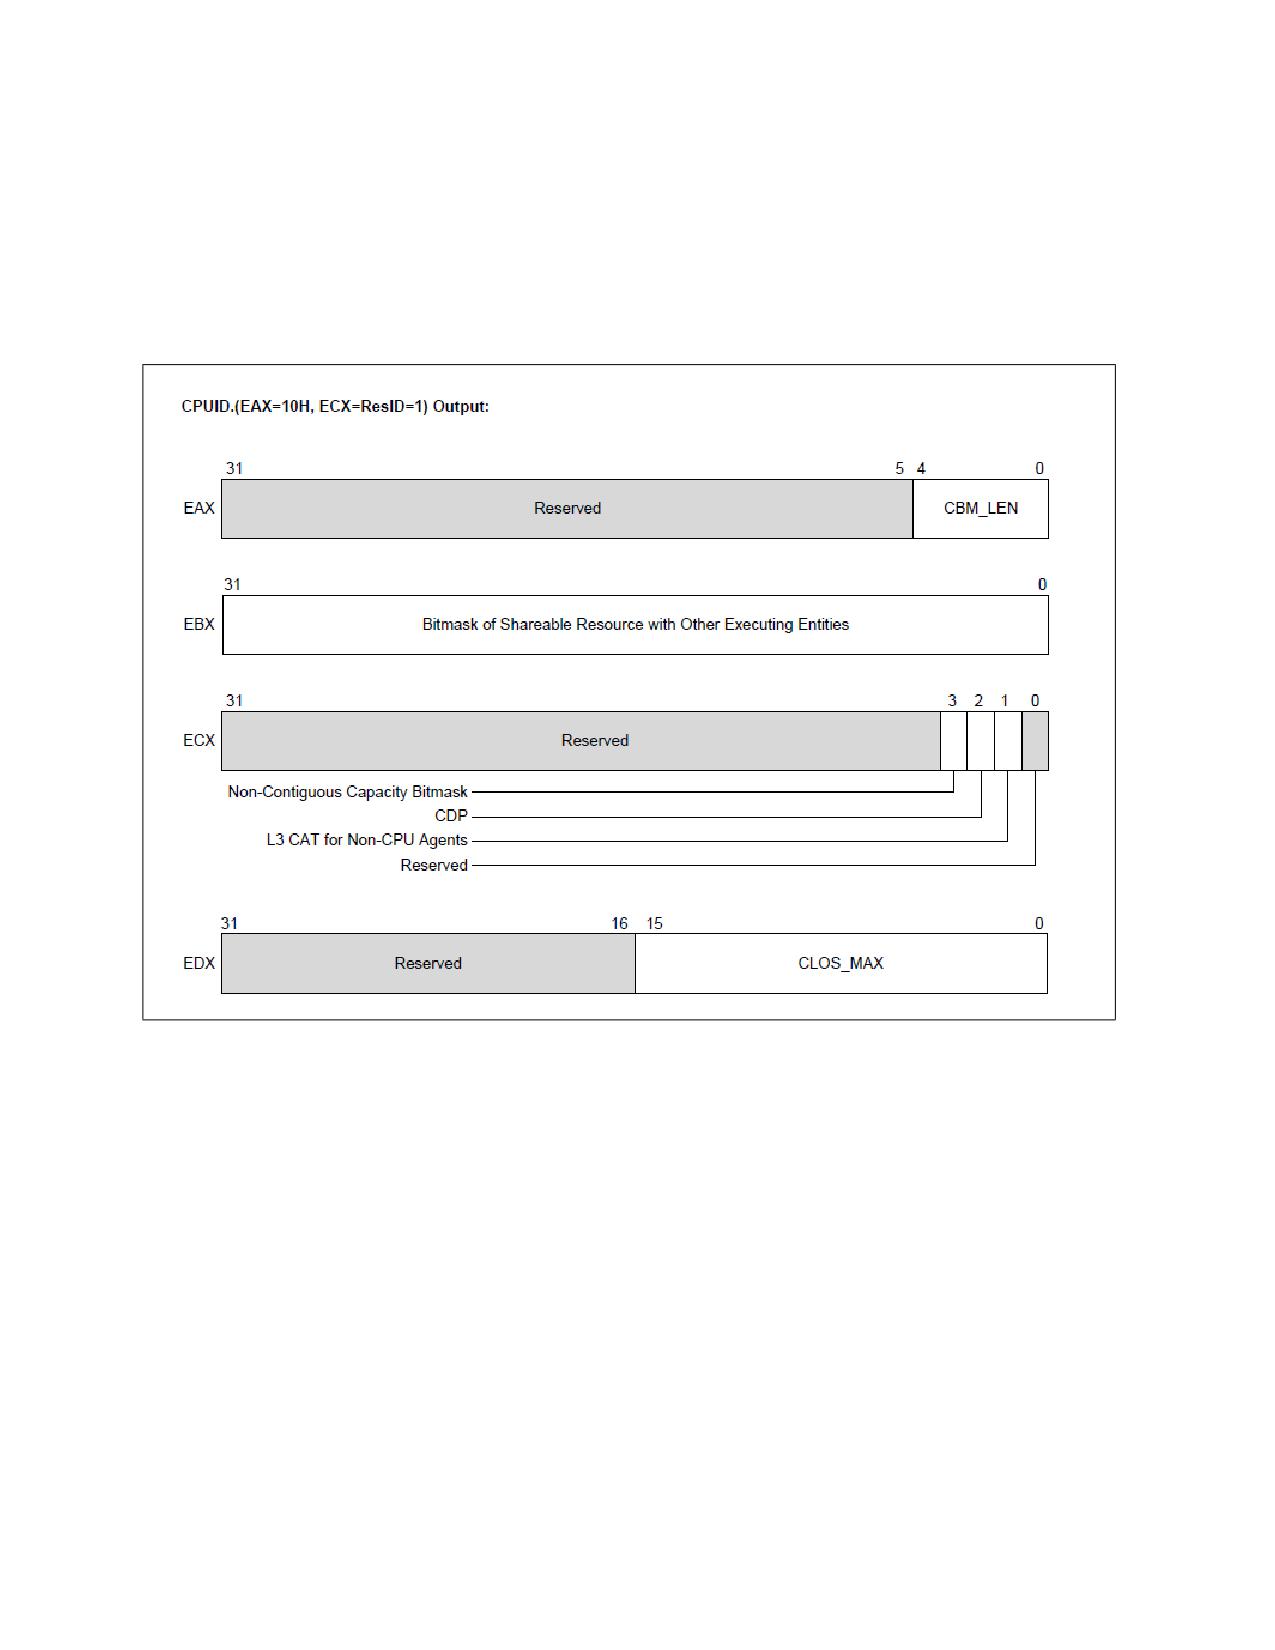
• CAT capability for L3 is enumerated by CPUID.10H.01H, see Figure 20-32. The specific CAT capabilities
reported by CPUID.10H.01H are:
- CPUID.10H.ResID=1:EAX[4:0] reports the length of the capacity bitmask. Add one to the return value to
get the result, e.g., a value of 15 corresponds to the capability bitmask having length of 16 bits. Bits 31:5
of EAX are reserved.
- CPUID.10H.01H:EBX[31:0] reports a bit mask. Each set bit within the length of the CBM indicates the
corresponding unit of the L3 allocation may be used by other entities in the platform (e.g., an integrated
graphics engine or hardware units outside the processor core and have direct access to L3). Each cleared
bit within the length of the CBM indicates the corresponding allocation unit can be configured to implement
a priority-based allocation scheme chosen by an OS/VMM without interference with other hardware agents
in the system. Bits outside the length of the CBM are reserved.
- CPUID.10H.01H:ECX[1]: If 1, indicates L3 CAT for non-CPU agents is supported. Bits 0 and 31:4 of ECX are
reserved. See section 18.20 for details.
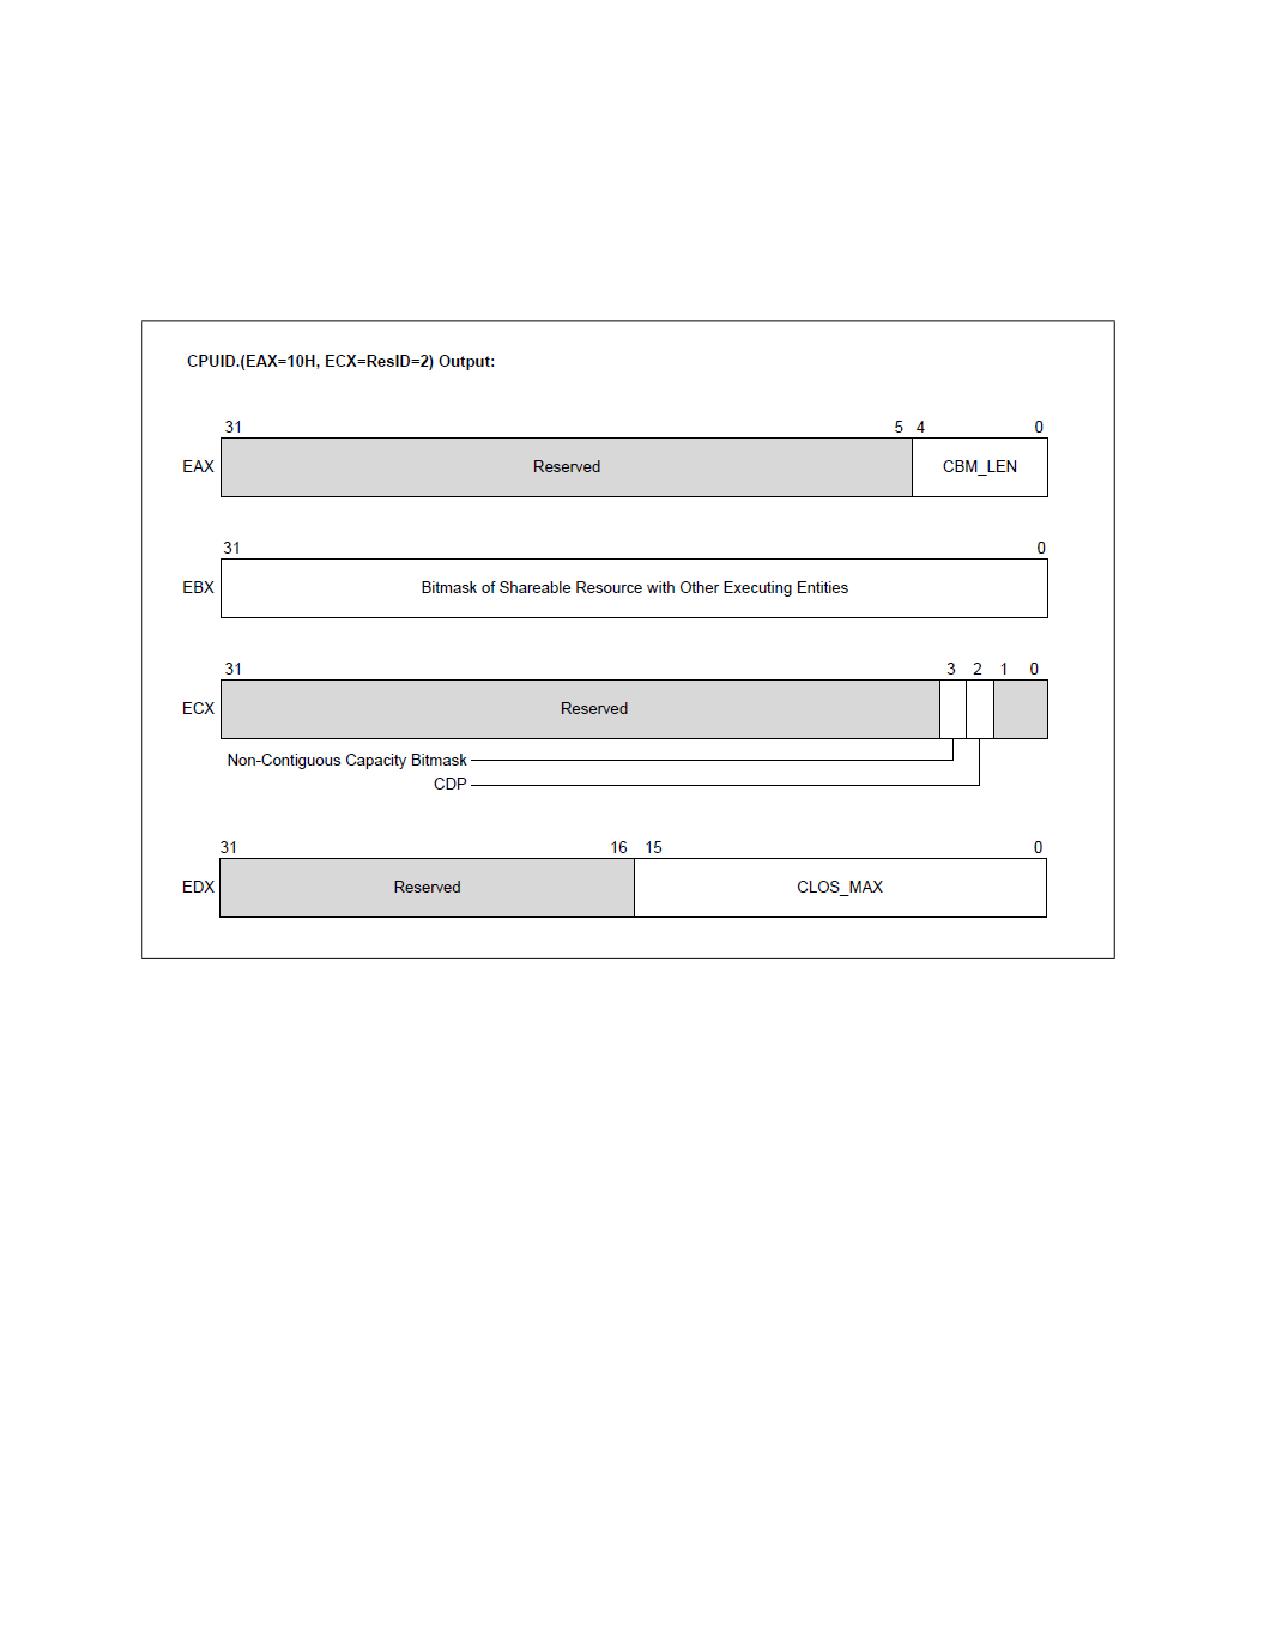
- CPUID.10H.01H:ECX.CDP[2]: If 1, indicates L3 Code and Data Prioritization Technology is supported (see
Section 20.19.5). Bits 0 and 31:4 of ECX are reserved.
Vol. 3B
20-59
DEBUG, BRANCH PROFILE, TSC, AND INTEL® RESOURCE DIRECTOR TECHNOLOGY (INTEL® RDT) FEATURES
- CPUID.10H.01H:ECX[3]: If 1, indicates non-contiguous capacity bitmask is supported. The bits that are set
in the various IA32_L3_MASK_n registers do not have to be contiguous. Bits 0 and 31:4 of ECX are
reserved.
- CPUID.10H.01H:EDX[15:0] reports the maximum CLOS supported for the resource (CLOS are zero-
referenced, meaning a reported value of '15' would indicate 16 total supported CLOS). Bits 31:16 are
reserved.
Figure 20-33. L2 Cache Allocation Technology
• CAT capability for L2 is enumerated by CPUID.10H.02H, see Figure 20-33. The specific CAT capabilities
reported by CPUID.10H.02H are:
- CPUID.10H.ResID=2:EAX[4:0] reports the length of the capacity bitmask. Add one to the return value to
get the result, e.g., a value of 15 corresponds to the capability bitmask having length of 16 bits. Bits 31:5
of EAX are reserved.
- CPUID.10H.02H:EBX[31:0] reports a bit mask. Each set bit within the length of the CBM indicates the
corresponding unit of the L2 allocation may be used by other entities in the platform. Each cleared bit within
the length of the CBM indicates the corresponding allocation unit can be configured to implement a priority-
based allocation scheme chosen by an OS/VMM without interference with other hardware agents in the
system. Bits outside the length of the CBM are reserved.
- CPUID.10H.02H:ECX.CDP[2]: If 1, indicates L2 Code and Data Prioritization Technology is supported (see
Section 17.19.6). Bits 1:0 and 31:4 of ECX are reserved.
- CPUID.10H.02H:ECX[3]: If 1, indicates non-contiguous capacity bitmask is supported. The bits which are
set in the various IA32_L2_MASK_n registers do not have to be contiguous. Bits 1:0 and 31:4 of ECX are
reserved.
20-60
Vol. 3B

DEBUG, BRANCH PROFILE, TSC, AND INTEL® RESOURCE DIRECTOR TECHNOLOGY (INTEL® RDT) FEATURES
- CPUID.10H.02H:EDX[15:0] reports the maximum CLOS supported for the resource (CLOS are zero-
referenced, meaning a reported value of '15' would indicate 16 total supported CLOS). Bits 31:16 are
reserved.
A note on migration of Classes of Service (CLOS): Software should minimize migrations of CLOS across logical
processors (across threads or cores), as a reduction in the performance of the Cache Allocation Technology feature
may result if CLOS are migrated frequently. This is aligned with the industry-standard practice of minimizing
unnecessary thread migrations across processor cores in order to avoid excessive time spent warming up
processor caches after a migration. In general, for best performance, minimize thread migration and CLOS migra-
tion across processor logical threads and processor cores.
20.19.4.3 Cache Allocation Technology: Cache Mask Configuration
After determining the length of the capacity bitmasks (CBM) and number of CLOS supported using CPUID (see
Section 20.19.4.2), each CLOS needs to be programmed with a CBM to dictate its available cache via a write to the
corresponding IA32_resourceType_MASK_n register, where 'n' corresponds to a number within the supported
range of CLOS, i.e., the range between 0 and CPUID.10H.ResID:EDX[15:0], inclusive, and 'resourceType' corre-
sponds to a specific resource as enumerated by the set bits of CPUID.10H.00H:EBX[31:1], for instance, ‘L2’ or ‘L3’
cache.
A hierarchy of MSRs is reserved for Cache Allocation Technology registers of the form IA32_resource-
Type_MASK_n:
• From 0C90H through 0D8FH (inclusive), providing support for multiple sub-ranges to support varying resource
types. The first supported resource type is 'L3', corresponding to the L3 cache in a platform. The MSRs range
from 0C90H through 0D0FH (inclusive), enables support for up to 128 L3 CAT Classes of Service.
63
31
10
9
0
CLOS
Reserved
RMID
IA32_PQR_ASSOC
63
32
31
0
Reserved
Bit_Mask
IA32_L3_MASK_0
63
32
31
0
Reserved
Bit_Mask
IA32_L3_MASK_n
Figure 20-34. IA32_PQR_ASSOC, IA32_L3_MASK_n MSRs
• Within the same CAT range hierarchy, another set of registers is defined for resourceType 'L2', corresponding
to the L2 cache in a platform, and MSRs IA32_L2_MASK_n are defined for n=[0,63] at addresses 0D10H
through 0D4FH (inclusive).
Figure 20-34 and Figure 20-35 provide an overview of the relevant registers.
63
32
31
0
Reserved
Bit_Mask
IA32_L2_MASK_0
63
32
31
0
Reserved
Bit_Mask
IA32_L2_MASK_n
Figure 20-35. IA32_L2_MASK_n MSRs
Vol. 3B
20-61
DEBUG, BRANCH PROFILE, TSC, AND INTEL® RESOURCE DIRECTOR TECHNOLOGY (INTEL® RDT) FEATURES
All CAT configuration registers can be accessed using the standard RDMSR / WRMSR instructions.
Note that once L3 or L2 CAT masks are configured, threads can be grouped into Classes of Service (CLOS) using
the IA32_PQR_ASSOC MSR as described in Section 20.19.4.4, “Class of Service to Cache Mask Association:
Common Across Allocation Features.”
20.19.4.4 Class of Service to Cache Mask Association: Common Across Allocation Features
After configuring the available classes of service with the preferred set of capacity bitmasks, the OS/VMM can set
the IA32_PQR_ASSOC.CLOS of a logical processor to the class of service with the desired CBM when a thread
context switch occurs. This allows the OS/VMM to indicate which class of service an executing thread/VM belongs
within. Each logical processor contains an instance of the IA32_PQR_ASSOC register at MSR location 0C8FH, and
Figure 20-34 shows the bit field layout for this register. Bits[M:32] contain the CLOS field for each logical processor,
where M can be determined by the following pseudo code:
CLOS_MAX = 0;
flags = CPUID.10H.00H:EBX;
for (ResID = 1; ResID <= 31; ++ResID){
if (flags & (1 << ResID)){
ResID_MAX = CPUID.10H.ResID:EDX & 0xFFFF;
CLOS_MAX = max(CLOS_MAX, ResID_MAX);
}
}
CLOS_WIDTH = Ceil(Log2(CLOS_MAX + 1));
M = (32 + CLOS_WIDTH - 1);
On platforms enumerating Resource Priority (Section 20.21.2) in CPUID as the only supported RDT Allocation
feature, software should consult ACPI as described in Section 20.21.2.1.2 to determine maximum supported
priority levels, which can be used (after subtracting one) as “CLOS_MAX” to determine CLOS field width.
Note that placing the RMID field within the same PQR register enables both RMID and CLOS to be swapped at
context swap time for simultaneous use of monitoring and allocation features with a single register write for effi-
ciency.
When CDP is enabled, Specifying a CLOS value in IA32_PQR_ASSOC.CLOS greater than MAX_CLOS_CDP
= (CPUID.10H.01H:EDX[15:0] >> 1) will cause undefined performance impact to code and data fetches. In all
cases, code and data masks for L2 and L3 CDP should be programmed with at least one bit set.
Note that if the IA32_PQR_ASSOC.CLOS is never written then the CAT capability defaults to using CLOS 0, which in
turn is set to the default mask in IA32_L3_MASK_0 - which is all “1”s (on reset). This essentially disables the
enforcement feature by default or for legacy operating systems and software.
See Section 20.19.7, “Introduction to Memory Bandwidth Allocation,” for important CLOS programming consider-
ations including maximum values when using CAT and CDP.
20.19.5 Code and Data Prioritization (CDP): Enumerating and Enabling L3 CDP Technology
L3 CDP is an extension of L3 CAT. The presence of the L3 CDP feature is enumerated via
CPUID.10H.01H:ECX.CDP[2] (see Figure 20-32). Most of the CPUID.10H.01H sub-leaf data that applies to CAT also
apply to CDP. However, CPUID.10H.01H:EDX.CAT_MAX_CLOS specifies the maximum CLOS applicable to CAT-only
operation. For CDP operations, CLOS_MAX_CDP is equal to (CPUID.10H.01H:EDX.CAT_MAX_CLOS >>1).
If CPUID.10H.01H:ECX.CDP[2] = 1, the processor supports CDP and provides a new MSR IA32_L3_QOS_CFG at
address 0C81H. The layout of IA32_L3_QOS_CFG is shown in Figure 20-36. The bit field definition of
IA32_L3_QOS_CFG are:
• Bit 0: L3 CDP Enable. If set, enables CDP, maps CAT mask MSRs into pairs of Data Mask and Code Mask MSRs.
The maximum allowed value to write into IA32_PQR_ASSOC.CLOS is CLOS_MAX_CDP.
• Bits 63:1: Reserved. Attempts to write to reserved bits result in a #GP(0).
20-62
Vol. 3B

DEBUG, BRANCH PROFILE, TSC, AND INTEL® RESOURCE DIRECTOR TECHNOLOGY (INTEL® RDT) FEATURES
IA32_L3_QOS_CFG
63
3
2 1
0
Reserved
L3 CDP Enable
Figure 20-36. Layout of IA32_L3_QOS_CFG
IA32_L3_QOS_CFG default values are all 0s at RESET, the mask MSRs are all 1s. Hence, all logical processors are
initialized in CLOS0 allocated with the entire L3 with CDP disabled, until software programs CAT and CDP. The scope
of the IA32_L3_QOS_CFG MSR is defined to be the same scope as the L3 cache (e.g., typically per processor
socket). Refer to Section 20.19.7 for software considerations while enabling or disabling L3 CDP.
20.19.5.1 Mapping Between L3 CDP Masks and CAT Masks
When CDP is enabled, the existing CAT mask MSR space is re-mapped to provide a code mask and a data mask per
CLOS. The re-mapping is shown in Table 20-19.
Table 20-19. Re-indexing of CLOS Numbers and Mapping to CAT/CDP Mask MSRs
Mask MSR
CAT-only Operation
CDP Operation
IA32_L3_QOS_Mask_0
CLOS0
CLOS0.Data
IA32_L3_QOS_Mask_1
CLOS1
CLOS0.Code
IA32_L3_QOS_Mask_2
CLOS2
CLOS1.Data
IA32_L3_QOS_Mask_3
CLOS3
CLOS1.Code
IA32_L3_QOS_Mask_4
CLOS4
CLOS2.Data
IA32_L3_QOS_Mask_5
CLOS5
CLOS2.Code
IA32_L3_QOS_Mask_’2n’
CLOS’2n’
CLOS’n’.Data
IA32_L3_QOS_Mask_’2n+1’
CLOS’2n+1’
CLOS’n’.Code
One can derive the MSR address for the data mask or code mask for a given CLOS number ‘n’ by:
• data_mask_address (n) = base + (n <<1), where base is the address of IA32_L3_QOS_MASK_0.
• code_mask_address (n) = base + (n <<1) +1.
When CDP is enabled, each CLOS is mapped 1:2 with mask MSRs, with one mask enabling programmatic control
over data fill location and one mask enabling control over code placement. A variety of overlapped and isolated
mask configurations are possible (see the example in Figure 20-29).
Mask MSR field definitions remain the same. Capacity masks must be formed of contiguous set bits, unless other-
wise non-contiguous capacity bitmask support is specified in CPUID enumeration for the resource type with a
length of 1 bit or longer and should not exceed the maximum mask length specified in CPUID. As examples, valid
masks on a cache with max bitmask length of 16b (from CPUID) include 0xFFFF, 0xFF00, 0x00FF, 0x00F0, 0x0001,
0x0003, and so on. Maximum valid mask lengths are unchanged whether CDP is enabled or disabled, and writes of
invalid mask values may lead to undefined behavior. Writes to reserved bits will generate #GP(0).
20.19.6 Code and Data Prioritization (CDP): Enumerating and Enabling L2 CDP Technology
L2 CDP is an extension of the L2 CAT feature. The presence of the L2 CDP feature is enumerated via
CPUID.10H.02H:ECX.CDP[2] (see Figure 17-33). Most of the CPUID.10H.02H sub-leaf data that applies to CAT also
Vol. 3B
20-63

DEBUG, BRANCH PROFILE, TSC, AND INTEL® RESOURCE DIRECTOR TECHNOLOGY (INTEL® RDT) FEATURES
apply to CDP. However, CPUID.10H.02H:EDX.CAT_MAX_CLOS specifies the maximum CLOS applicable to CAT-only
operation. For CDP operations, CLOS_MAX_CDP is equal to (CPUID.10H.02H:EDX.CAT_MAX_CLOS >>1).
If CPUID.10H.02H:ECX.CDP[2] = 1, the processor supports L2 CDP and provides a new MSR IA32_L2_QOS_CFG at
address 0C82H. The layout of IA32_L2_QOS_CFG is shown in Figure 20-37. The bit field definition of
IA32_L2_QOS_CFG are:
• Bit 0: L2 CDP Enable. If set, enables CDP, maps CAT mask MSRs into pairs of Data Mask and Code Mask MSRs.
The maximum allowed value to write into IA32_PQR_ASSOC.CLOS is CLOS_MAX_CDP.
• Bits 63:1: Reserved. Attempts to write to reserved bits result in a #GP(0).
IA32_L2_QOS_CFG
63
3
2 1
0
Reserved
L2 CDP Enable
Figure 20-37. Layout of IA32_L2_QOS_CFG
IA32_L2_QOS_CFG default values are all 0s at RESET, and the mask MSRs are all 1s. Hence all logical processors
are initialized in CLOS0 allocated with the entire L2 available and with CDP disabled, until software programs CAT
and CDP. The IA32_L2_QOS_CFG MSR is defined at the same scope as the L2 cache, typically at the module level
for Intel Atom processors for instance. In processors with multiple modules present it is recommended to program
the IA32_L2_QOS_CFG MSR consistently across all modules for simplicity.
20.19.6.1 Mapping Between L2 CDP Masks and L2 CAT Masks
When CDP is enabled, the existing CAT mask MSR space is re-mapped to provide a code mask and a data mask per
CLOS. This remapping is the same as the remapping shown in Table 20-19 for L3 CDP, but for the L2 MSR block
(IA32_L2_QOS_MASK_n) instead of the L3 MSR block (IA32_L3_QOS_MASK_n). The same code / data mask
mapping algorithm applies to remapping the MSR block between code and data masks.
As with L3 CDP, when L2 CDP is enabled, each CLOS is mapped 1:2 with mask MSRs, with one mask enabling
programmatic control over data fill location and one mask enabling control over code placement. A variety of over-
lapped and isolated mask configurations are possible (see the example in Figure 20-29).
Mask MSR field definitions for L2 CDP remain the same as for L2 CAT. Capacity masks must be formed of contiguous
set bits, unless otherwise non-contiguous capacity bitmask support is specified in CPUID enumeration for the
resource type with a length of 1 bit or longer and should not exceed the maximum mask length specified in CPUID.
As examples, valid masks on a cache with max bitmask length of 16b (from CPUID) include 0xFFFF, 0xFF00,
0x00FF, 0x00F0, 0x0001, 0x0003, and so on. Maximum valid mask lengths are unchanged whether CDP is enabled
or disabled, and writes of invalid mask values may lead to undefined behavior. Writes to reserved bits will generate
#GP(0).
20.19.6.2 Common L2 and L3 CDP Programming Considerations
Before enabling or disabling L2 or L3 CDP, software should write all 1's to all of the corresponding CAT/CDP masks
to ensure proper behavior (e.g., the IA32_L3_QOS_Mask_n set of MSRs for the L3 CAT feature). When enabling
CDP, software should also ensure that only CLOS number which are valid in CDP operation is used, otherwise unde-
fined behavior may result. For instance in a case with 16 CAT CLOS, since CLOS are reduced by half when CDP is
enabled, software should ensure that only CLOS 0-7 are in use before enabling CDP (along with writing 1's to all
mask bits before enabling or disabling CDP).
Software should also account for the fact that mask interpretations change when CDP is enabled or disabled,
meaning for instance that a CAT mask for a given CLOS may become a code mask for a different Class of Service
when CDP is enabled. In order to simplify this behavior and prevent unintended remapping software should
consider resetting all threads to CLOS[0] before enabling or disabling CDP.
20-64
Vol. 3B
DEBUG, BRANCH PROFILE, TSC, AND INTEL® RESOURCE DIRECTOR TECHNOLOGY (INTEL® RDT) FEATURES
20.19.6.3 Cache Allocation Technology Dynamic Configuration
All Intel Resource Director Technology (Intel RDT) interfaces including the IA32_PQR_ASSOC MSR, CAT/CDP
masks, MBA delay values, and CQM/MBM registers are accessible and modifiable at any time during execution
using RDMSR/WRMSR unless otherwise noted. When writing to these MSRs a #GP(0) will be generated if any of the
following conditions occur:
• A reserved bit is modified,
• Accessing a QOS mask register outside the supported CLOS (the max CLOS number is specified in
CPUID.10H.ResID:EDX[15:0]), or
• Writing a CLOS greater than the supported maximum (specified as the maximum value of
CPUID.10H.ResID:EDX[15:0] for all valid ResID values) is written to the IA32_PQR_ASSOC.CLOS field.
When CDP is enabled, specifying a CLOS value in IA32_PQR_ASSOC.CLOS outside of the lower half of the CLOS
space will cause undefined performance impact to code and data fetches due to MSR space re-indexing into
code/data masks when CDP is enabled.
When reading the IA32_PQR_ASSOC register the currently programmed CLOS on the core will be returned.
When reading an IA32_resourceType_MASK_n register the current capacity bit mask for CLOS 'n' will be returned.
As noted previously, software should minimize migrations of CLOS across logical processors (across threads or
cores), as a reduction in the accuracy of the Cache Allocation feature may result if CLOS are migrated frequently.
This is aligned with the industry standard practice of minimizing unnecessary thread migrations across processor
cores in order to avoid excessive time spent warming up processor caches after a migration. In general, for best
performance, minimize thread migration and CLOS migration across processor logical threads and processor cores.
20.19.6.4 Cache Allocation Technology Operation With Power Saving Features
Note that the Cache Allocation Technology feature cannot be used to enforce cache coherency, and that some
advanced power management features such as C-states which may shrink or power off various caches within the
system may interfere with CAT hints - in such cases the CAT bitmasks are ignored and the other features take
precedence. If the highest possible level of CAT differentiation or determinism is required, disable any power-
saving features which shrink the caches or power off caches. The details of the power management interfaces are
typically implementation-specific, but can be found at Intel® 64 and IA-32 Architectures Software Developer’s
Manual, Volume 3C.
If software requires differentiation between threads but not absolute determinism then in many cases it is possible
to leave power-saving cache shrink features enabled, which can provide substantial power savings and increase
battery life in mobile platforms. In such cases when the caches are powered off (e.g., package C-states) the entire
cache of a portion thereof may be powered off. Upon resuming an active state any new incoming data to the cache
will be filled subject to the cache capacity bitmasks. Any data in the cache prior to the cache shrink or power off
may have been flushed to memory during the process of entering the idle state, however, and is not guaranteed to
remain in the cache. If differentiation between threads is the goal of system software then this model allows
substantial power savings while continuing to deliver performance differentiation. If system software needs
optimal determinism then power saving modes which flush portions of the caches and power them off should be
disabled.
NOTE
IA32_PQR_ASSOC is saved and restored across C6 entry/exit. Similarly, the mask register contents
are saved across package C-state entry/exit and are not lost.
20.19.6.5 Cache Allocation Technology Operation with Other Operating Modes
The states in IA32_PQR_ASSOC and mask registers are unmodified across an SMI delivery. Thus, the execution of
SMM handler code can interact with the Cache Allocation Technology resource and manifest some degree of non-
determinism to the non-SMM software stack. An SMM handler may also perform certain system-level or power
management practices that affect CAT operation.
Vol. 3B
20-65
DEBUG, BRANCH PROFILE, TSC, AND INTEL® RESOURCE DIRECTOR TECHNOLOGY (INTEL® RDT) FEATURES
It is possible for an SMM handler to minimize the impact on data determinism in the cache by reserving a CLOS with
a dedicated partition in the cache. Such an SMM handler can switch to the dedicated CLOS immediately upon
entering SMM, and switching back to the previously running CLOS upon exit.
20.19.6.6 Associating Threads with CAT/CDP Classes of Service
Threads are associated with Classes of Service (CLOS) via the per-logical-processor IA32_PQR_ASSOC MSR. The
same CLOS concept applies to both CAT and CDP (for instance, CLOS[5] means the same thing whether CAT or CDP
is in use, and the CLOS has associated resource usage constraint attributes including cache capacity masks). The
mapping of CLOS to mask MSRs does change when CDP is enabled, according to the following guidelines:
• In CAT-only Mode - one set of bitmasks in one mask MSR control both code and data.
- Each CLOS number map 1:1 with a capacity mask on the applicable resource (e.g., L3 cache).
• When CDP is enabled:
- Two mask sets exist for each CLOS number, one for code, one for data.
- Masks for code/data are interleaved in the MSR address space (see Table 20-19).
20.19.7 Introduction to Memory Bandwidth Allocation
The Memory Bandwidth Allocation (MBA) feature provides indirect and approximate control over memory band-
width available per-core. It was introduced in the Intel Xeon Scalable Processor Family. This feature provides a
method to control applications that may be over-utilizing bandwidth relative to their priority in environments such
as the data-center.
The MBA feature uses existing constructs from the Intel RDT feature set, including Classes of Service (CLOS). A
given CLOS used for L3 CAT, for instance, means the same thing as a CLOS used for MBA. Infrastructure, such as
the MSR used to associate a thread with a CLOS (the IA32_PQR_ASSOC_MSR) and some elements of the CPUID
enumeration (such as CPUID.10H), are shared. Certain generations include advanced hardware controllers for effi-
ciency. For more information, refer to the “Intel® Resource Director Technology Architecture Specification.”
The following sections describe CPU interfaces to Memory Bandwidth Allocation, such as CPUID enumeration and
configuration interfaces (MSRs).
20.19.7.1 Memory Bandwidth Allocation Enumeration
Similar to other Intel RDT features, enumeration of the presence and details of the MBA feature is provided via a
sub-leaf of the CPUID instruction.
Key components of the enumeration are as follows.
• Support for the MBA feature on the processor, and if MBA is supported, the following details:
- Number of supported Classes of Service (CLOS) for the processor.
- The maximum MBA delay value supported (which also implicitly provides a definition of the granularity).
- An indication of whether the delay values which can be programmed are linearly spaced or not.
The presence of any of the Intel RDT features which enable control over shared platform resources is enumerated
by executing CPUID instruction with EAX = 07H, ECX = 0H as input. If CPUID.07H.00H:EBX.RDT_A[15] reports 1,
the processor supports software control over shared processor resources. Software may then use CPUID.10H to
enumerate additional details on the specific controls provided.
Through CPUID.10H software may determine whether MBA is supported on the platform. Specifically, as shown in
Figure 20-31, bit 3 of the EBX register indicates whether MBA is supported on the processor, and the bit position
(3) constitutes a Resource ID (ResID) which allows enumeration of MBA details. For instance, if bit 3 is supported
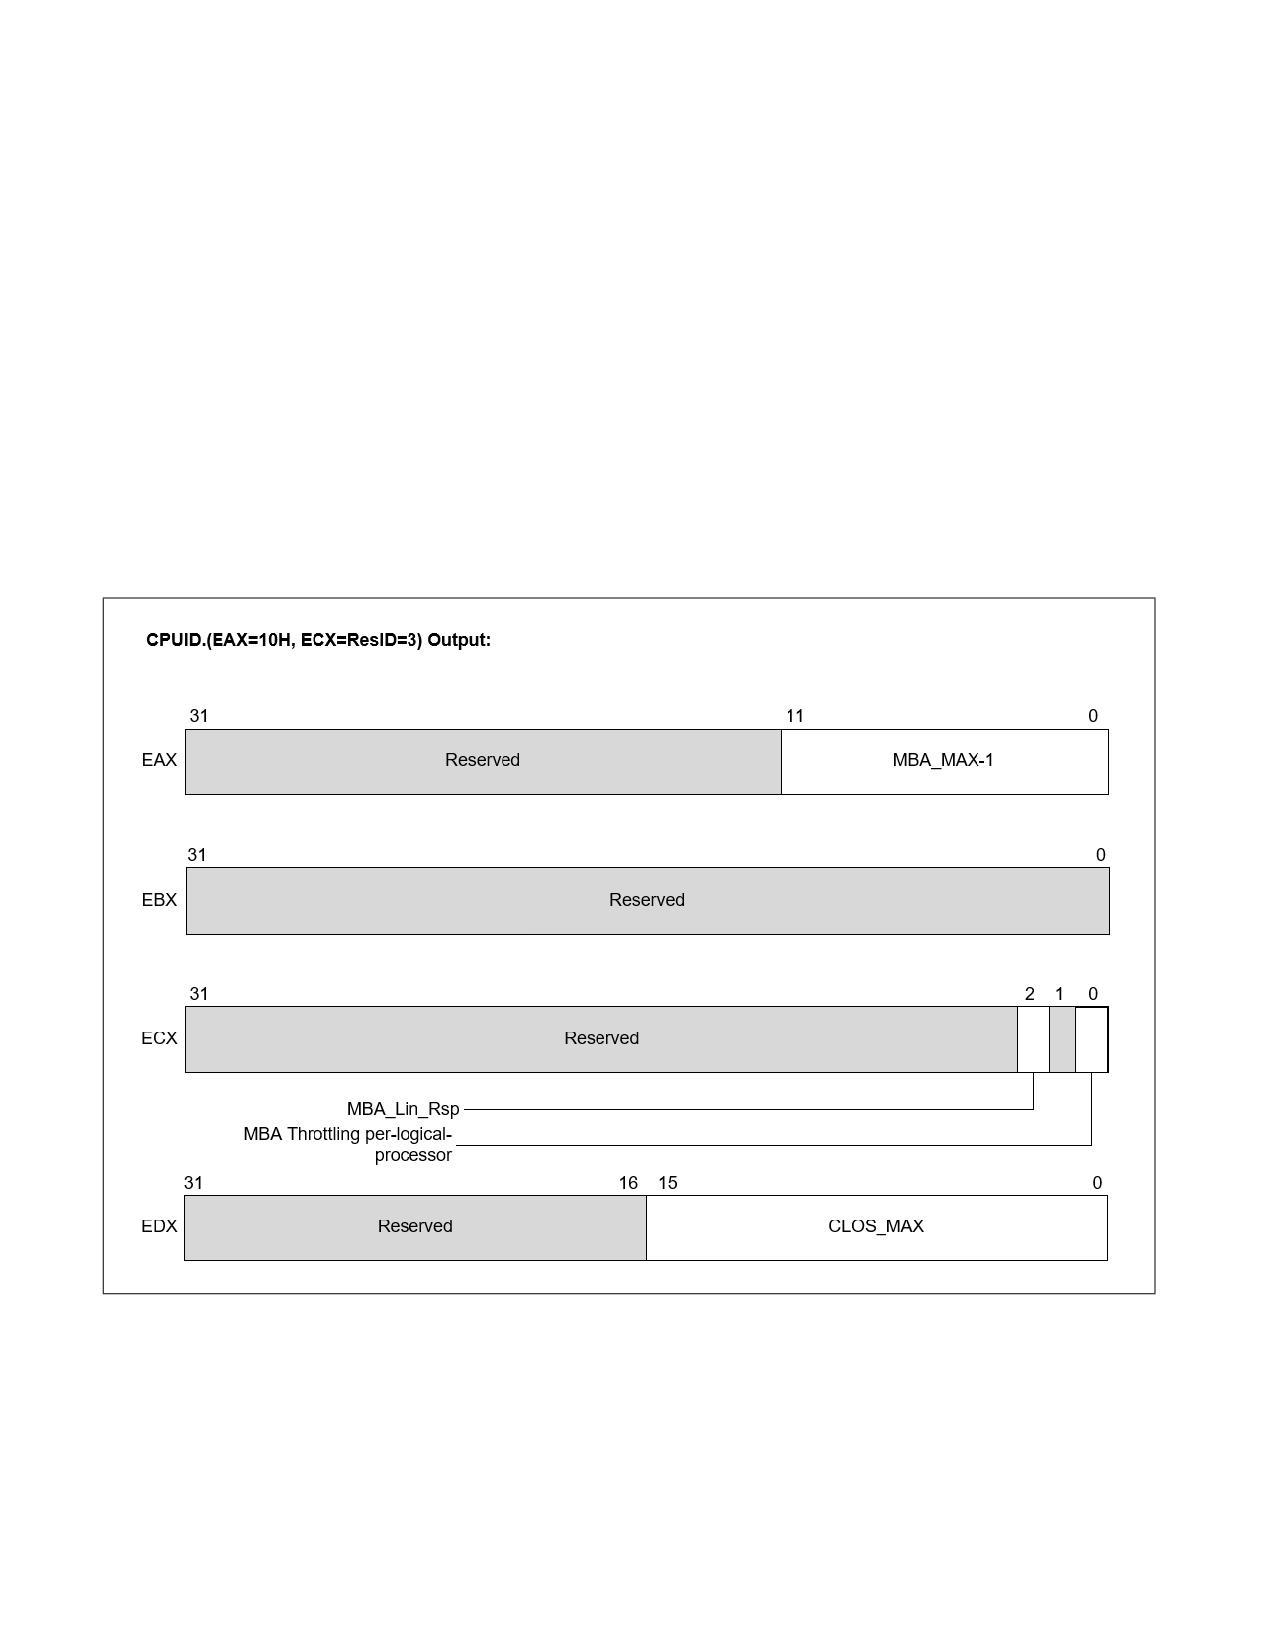
this implies the presence of CPUID.10H.[ResID=3] as shown in Figure 20-38 which provides the following details.
• CPUID.10H.ResID=3:EAX[11:0] reports the maximum MBA throttling value supported, minus one. For
instance, a value of 89 indicates that a maximum throttling value of 90 is supported. Additionally, in cases
where a linear interface (see below) is supported then one hundred minus the maximum throttling value
indicates the granularity, 10% in this example.
20-66
Vol. 3B
DEBUG, BRANCH PROFILE, TSC, AND INTEL® RESOURCE DIRECTOR TECHNOLOGY (INTEL® RDT) FEATURES
• CPUID.10H.ResID=3:EBX is reserved.
• CPUID.10H.ResID=3:ECX[0] indicates that the MBA throttling values are applied per-logical-processor
independently if set.
• CPUID.10H.ResID=3:ECX[2] reports whether the response of the delay values is linear (see text).
• CPUID.10H.ResID=3:EDX[15:0] reports the number of Classes of Service (CLOS) supported for the feature
(minus one). For instance, a reported value of 15 implies a maximum of 16 supported MBA CLOS.
The number of CLOS supported for the MBA feature may or may not align with other resources such as L3 CAT. In
cases where the Intel RDT features support different numbers of CLOS the lowest numerical CLOS support the
common set of features, while higher CLOS may support a subset. For instance, if L3 CAT supports 8 CLOS while
MBA supports 4 CLOS, all 8 CLOS would have L3 CAT masks available for cache control, but the upper 4 CLOS
would not offer MBA support. In this case the upper 4 CLOS would not be subject to any throttling control. Software
can manage supported resources / CLOS in order to either have consistent capabilities across CLOS by using the
common subset or enable more flexibility by selectively applying resource control where needed based on careful
CLOS and thread mapping. In all cases, CLOS[0] supports all Intel RDT resource control features present on the
platform.
Discussion on the interpretation and usage of the MBA delay values is provided in Section 20.19.7.2 on MBA config-
uration.
Figure 20-38. CPUID.10H.03H MBA Feature Details Identification
20.19.7.2 Memory Bandwidth Allocation Configuration
The configuration of MBA takes consists of two processes once enumeration is complete.
• Association of threads to Classes of Service (CLOS) - accomplished in a common fashion across Intel RDT
features as described in Section 20.19.7.1 via the IA32_PQR_ASSOC MSR. As with features such as L3 CAT,
Vol. 3B
20-67

DEBUG, BRANCH PROFILE, TSC, AND INTEL® RESOURCE DIRECTOR TECHNOLOGY (INTEL® RDT) FEATURES
software may update the CLOS field of the PQR MSR at context swap time in order to maintain the proper
association of software threads to Classes of Service on the hardware. While logical processors may each be
associated with independent CLOS, see Section 20.19.7.3 for important usage model considerations (initial
versions of the MBA feature select the maximum delay value across threads).
• Configuration of the per-CLOS delay values, accomplished via the IA32_L2_QoS_Ext_BW_Thrtl_n MSR set
shown in Table 20-20.
The MBA delay values which may be programmed range from zero (implying zero delay, and full bandwidth avail-
able) to the maximum (MBA_MAX) specified in CPUID as discussed in Section 20.19.7.1. The throttling values are
approximate and do not sum to 100% across CLOS, rather they should be viewed as a maximum bandwidth “cap”
per-CLOS.
Software may select an MBA delay value then write the value into one or more of the IA32_L2_QoS_Ext_B-
W_Thrtl_n MSRs to update the delay values applied for a specific CLOS. As shown in Table 20-20 the base address
of the MSRs is at D50H, and the range corresponds to the maximum supported CLOS from
CPUID.10H.ResID=1:EDX[15:0] as described in Section 20.19.7.1. For instance, if 16 CLOS are supported then the
valid MSR range will extend from D50H through D5F inclusive.
Table 20-20. MBA Delay Value MSRs
Delay Value MSR
Address
IA32_L2_QoS_Ext_BW_Thrtl_0
D50H
IA32_L2_QoS_Ext_BW_Thrtl_1
D51H
IA32_L2_QoS_Ext_BW_Thrtl_2
D52H
IA32_L2_QoS_Ext_BW_Thrtl_'CLOS_MAX'
D50H + CLOS_MAX from CPUID.10H.03H
The definition for the MBA delay value MSRs is provided in Figure 17.39. The lower 16 bits are used for MBA delay
values, and values from zero to the maximum from the CPUID MBA_MAX-1 value are supported. Values outside this
range will generate #GP(0).
If linear input throttling values are indicated by CPUID.10H.ResID=3:ECX[2] then values from zero through the
MBA_MAX field from CPUID.10H.ResID=3:EAX[11:0] are supported as inputs. In the linear mode the input preci-
sion is defined as 100-(MBA_MAX). For instance, if the MBA_MAX value is 90, the input precision is 10%. Values not
an even multiple of the precision (e.g., 12%) will be rounded down (e.g., to 10% delay applied).
• If linear values are not supported (CPUID.10H.ResID=3:ECX[2] = 0) then input delay values are powers-of-two
from zero to the MBA_MAX value from CPUID. In this case any values not a power of two will be rounded down
the next nearest power of two.
Base MSR Address = 0xD50
63
16
15
0
IA32_L2_QOS_Ext_BW_Thrtl_n MSR
Reserved
MBA Delay Value
Figure 20-39. IA32_L2_QoS_Ext_BW_Thrtl_n MSR Definition
Note that the throttling values provided to software are calibrated through specific traffic patterns, however as
workload characteristics may vary the response precision and linearity of the delay values will vary across products
and should be treated as approximate values only.
20-68
Vol. 3B
DEBUG, BRANCH PROFILE, TSC, AND INTEL® RESOURCE DIRECTOR TECHNOLOGY (INTEL® RDT) FEATURES
20.19.7.3 Memory Bandwidth Allocation Usage Considerations
Different versions of Memory Bandwidth Allocation have various usage considerations and improving efficiency
over time. See the “Intel® Resource Director Technology Architecture Specification” for additional details.
20.19.8 Cache Bandwidth Allocation (CBA)
20.19.8.1 Introduction to Cache Bandwidth Allocation
The Cache Bandwidth Allocation (CBA) feature provides control over bandwidth available between Level 1 (L1)
caches, Level 2 (L2) Caches, and Level 3 (L3) Caches (as applicable) for each of the logical processors. Since
reducing upstream bandwidth can also reduce bandwidth to external memory, this also provides an indirect control
of memory bandwidth. The CBA feature, along with the MBA, provides a mechanism to control the bandwidth of
different applications.
A given CLOS used for L3 CAT, for instance, means the same thing as a CLOS used for CBA. Infrastructure such as
the MSR used to associate a logical processor with a CLOS (the IA32_PQR_ASSOC_MSR) and some elements of the
CPUID enumeration (such as CPUID leaf 10H (Cache Allocation Technology Enumeration Leaf)) are shared. For
more information, refer to the “Intel® Resource Director Technology Architecture Specification.”
The following sections describe the CPUID enumeration and configuration interfaces (Model-Specific Registers)
applicable to the Cache Bandwidth Allocation feature.
20.19.8.2 Cache Bandwidth Allocation Enumeration
As with certain other Intel RDT features, enumeration of the presence and details of the CBA feature is provided via
a sub-leaf of the CPUID instruction.
Key components of the enumeration include support for the CBA feature on the processor, and if CBA is supported,
the following details:
• Number of supported Classes of Service for the processor.
• Scope of the CBA feature MSRs.
• The maximum CBA throttle Level supported.
• An indication of whether the throttle values that can be programmed are linearly spaced or not.
The presence of any of the Intel RDT features that enable control over shared platform resources is enumerated by
executing CPUID instruction with EAX = 07H and ECX = 0H as input. If CPUID.07H.00H:EBX.PQE[bit 15] reports 1,
the processor supports software control over shared processor resources. Software may then use CPUID leaf 10H
to enumerate additional details on the specific controls provided.
Using CPUID leaf 10H, software may determine whether CBA is supported on the platform. Specifically, as shown
in Figure 20-31, bit 5 of the EBX register indicates whether CBA is supported on the processor, and the bit position
(5) constitutes a Resource ID (ResID), which allows the enumeration of CBA details. For instance, if bit 5 is
supported, this implies the presence of CPUID.10H.05H as shown in Figure 20-40. "CPUID.10H.05H, CBA Feature
Details Identification," which provides the following details (this information can also be found in Chapter 21 of
Volume 1):
• CPUID.10H.05H:EAX
- EAX[7:0] reports the maximum CBA throttling value supported.
- EAX[11:8] reports the scope of CBA IA32_QoS_Core_BW_Thrtl_n MSRs. If EAX[11:8]=1, this indicates the
logical processor scope of the MSRs.
- EAX[31:12] is reserved.
• CPUID.10H.05H:EBX
- EBX[31:0] is reserved.
• CPUID.10H.05H:ECX
Vol. 3B
20-69

DEBUG, BRANCH PROFILE, TSC, AND INTEL® RESOURCE DIRECTOR TECHNOLOGY (INTEL® RDT) FEATURES
- ECX[3] reports whether the response of the bandwidth control is approximately linear. If ECX[3] is 1, the
response of the bandwidth control is approximately linear. If ECX[3] is 0, the response of the bandwidth
control is non-linear.
- ECX[2:0] and ECX[31:4] are reserved.
• CPUID.10H.05H:EDX
- EDX[15:0] reports the number of Classes of Service supported for the feature. Add one to the return value
to get the result. For instance, a reported value of 15 implies a maximum of 16 supported CBA CLOS.
- EDX[31:16] is reserved.
CPUID.(EAX = 10H, ECX = ResID = 5) Output:
31
12 11
8 7
0
Scope of
EAX
Reserved
CBA_MAX_Throttle_Level
CBA MSRs
31
0
EBX
Reserved
31
3
2
0
ECX
Reserved
CBA_Lin_Rsp
31
16 15
0
EDX
Reserved
CLOS_MAX
Figure 20-40. CPUID.10H.05H, CBA Feature Details Identification
20.19.8.3 Cache Bandwidth Allocation Configuration
The configuration of CBA consists of two processes once enumeration is complete:
• The association of logical processors to Classes of Service (CLOS) is accomplished commonly across Intel RDT
features through the IA32_PQR_ASSOC MSR. Software may update the CLOS field of the PQR MSR dynami-
cally, including at context swap time, to maintain the proper association of logical processors to Classes of
Service on the hardware.
• A new set of architectural MSRs is added to enable software to communicate the memory bandwidth QoS
requirements of the application running on the logical processor. The scope of these MSRs,
IA32_QoS_Core_BW_Thrtl_n, is per logical processor. Each MSR encodes packed 8-bit fields indexed by Class
of Service, which specify the Throttle Level for each CLOS.
20-70
Vol. 3B

DEBUG, BRANCH PROFILE, TSC, AND INTEL® RESOURCE DIRECTOR TECHNOLOGY (INTEL® RDT) FEATURES
The CLOS field value of the IA32_PQR_ASSOC MSR is used to index into the MSRs and select the software-specified
Throttle Level. Each logical processor uses this level to control the bandwidth across the cache hierarchy. The hard-
ware ensures coordination with the MBA feature (where present). The reset value of the CLOS[i].Level=0 indicates
unthrottled bandwidth. This field may be programmed from 0 to CBA_MAX_Throttle_Level (see Figure 20-40). Any
values outside this range will generate a #GP(0). A higher value of CLOS[i].Level implies a higher level of band-
width throttling, and a lower number indicates lesser throttling. The number of supported CLOS for a given logical
processor is enumerated in CPUID.10H.05H:EDX. In an example where a logical processor supports 16 CLOS, two
64-bit MSRs with packed Throttling Levels (TLs) are defined, IA32_QoS_Core_BW_Thrtl_0 (defining packed TLs for
CLOS[7:0]) and IA32_QoS_Core_BW_Thrtl_1 (defining TLs for CLOS[15:8]). For example, within the MSR
IA32_QoS_Core_BW_Thrtl_0, bits [7:0] define the TL field for CLOS 0 (see Figure 20-41).
Advanced versions of the MBA feature may manage the external memory bandwidth associated with the CLOS by
dynamically increasing or decreasing the bandwidth, under software guidance, to maintain throttling priorities
while maximizing system performance as described in the Intel Software Developer's Manual and the Intel RDT
Architecture Specification. The CBA feature, along with the MBA, provides a mechanism to control the bandwidth
of different applications. Software should understand that the effective throttling of an application may be which-
ever of the CBA or MBA specifies more throttling. Software may use CBA, MBA, or a combination to achieve band-
width and performance management goals if supported on a processor.
Table 20-21. Cache Bandwidth Allocation (CBA) MSRs
Delay Value MSR
Address
IA32_QoS_Core_BW_Thrtl_0
E00H
IA32_QoS_Core_BW_Thrtl_1
E01H
IA32_QoS_Core_BW_Thrtl_2
E02H
IA32_QoS_Core_BW_Thrtl _'(((COS_MAX+1)/8) - 1)'
E00H + ((COS_MAX from CPUID.10H.5 + 1)/8 - 1)
Base MSR Address = E00H
63
0
IA32_QoS_Core_BW_Thrtl_0 MSR
[63:56]
[55:48]
[47:40]
[39:32]
[31:24]
[23:16]
[15:8]
[7:0]
CLOS[7].Level
CLOS[6].Level
CLOS[5].Level
CLOS[4].Level
CLOS[3].Level
CLOS[2].Level
CLOS[1].Level
CLOS[0].Level
Base MSR Address = E01H
63
0
IA32_QoS_Core_BW_Thrtl_1 MSR
[63:56]
[55:48]
[47:40]
[39:32]
[31:24]
[23:16]
[15:8]
[7:0]
CLOS[15].Level
CLOS[14].Level
CLOS[13].Level
CLOS[12].Level
CLOS[11].Level
CLOS[10].Level
CLOS[9].Level
CLOS[8].Level
Figure 20-41. IA32_QoS_Core_BW_Thrtl_n MSR Definition
Note that the throttling values provided to the software are calibrated through specific traffic patterns; however, as
workload characteristics may vary, the response precision and linearity of the bandwidth threshold values will vary
across products and should be treated as approximate values only.
Vol. 3B
20-71
DEBUG, BRANCH PROFILE, TSC, AND INTEL® RESOURCE DIRECTOR TECHNOLOGY (INTEL® RDT) FEATURES
20.19.8.4 Cache Bandwidth Allocation Usage Considerations
Cache Bandwidth Allocation has various software usage considerations and improves efficiency over product gener-
ations. See the “Intel® Resource Director Technology Architecture Specification” for additional details.
20.20 INTEL® RESOURCE DIRECTOR TECHNOLOGY (INTEL® RDT) FOR NON-CPU
AGENTS
This section describes Intel RDT features for non-CPU agents. CPU agents are threads running on IA cores. Non-
CPU agents include PCIe and CXL devices and integrated accelerators, thus broadly encompassing the set of agents
that read from and write to either caches or memory, excluding IA cores. The non-CPU agent Intel RDT features
enable monitoring of I/O device shared cache and memory bandwidth and cache allocation control. This provides
features for I/O devices equivalent to the CPU agent Intel RDT capabilities CMT, MBM, and CAT (discussed in
Section 20.18 and Section 20.19). Refer to the “Intel® Resource Director Technology Architecture Specification”
regarding design goals, use cases, software architecture, ACPI enumeration, and MMIO register interfaces.
“Non-CPU agent Intel RDT” refers to capabilities that monitor and control non-CPU agents' resource utilization,
including PCIe and CXL devices and integrated accelerators. Non-CPU agent Intel RDT may be called I/O RDT in
some literature. In this document, the term “non-CPU agent Intel RDT” is used.
20.20.1 Non-CPU Agent Intel® RDT Features Enumeration Details
CPU agent Intel RDT features use the CPUID instruction to enumerate supported features and the level of support.
Architectural Model-Specific Registers (MSRs) are interfaces to the monitoring and allocation features, as described
in Sections 18.18 and 18.19.
Non-CPU agent Intel RDT builds on CPU agent Intel RDT by extending CPUID to indicate the presence and integra-
tion of non-CPU agent Intel RDT and by providing rich enumeration information in vendor-specific extensions to the
Advanced Configuration and Power Interface (ACPI), in particular in the I/O RDT (IRDT) table. The ACPI extensions
detailed in the “Intel® Resource Director Technology Architecture Specification” provide mechanisms to compre-
hend the structure of devices attached behind I/O blocks to particular links and what forms of tagging are
supported on a per-link basis.
It is recommended that software parse CPUID and ACPI to obtain a detailed understanding of platform support and
capabilities before attempting to use non-CPU agent Intel RDT.
20.20.1.1 CPUID-Based Enumeration for Non-CPU Agent Intel® RDT Feature
CPUID-based enumeration provides a method by which all architectural Intel RDT features may be enumerated.
For CPU agent Intel RDT, monitoring details are enumerated in a CPUID sub-leaf denoted as CPUID.0FH.ResID,
where ResID corresponds to a resource ID bit index from the CPUID.0FH.00H sub-leaf. Similarly, Intel RDT alloca-
tion features are described in CPUID.10H.ResID. (Note that the ResID bit positions are not guaranteed to be
symmetric or have the same encodings.)
No CPUID leaves or sub-leaves are created for non-CPU agent Intel RDT. Rather, non-CPU agent Intel RDT extends
the existing Intel RDT CPUID sub-leaves with a bit per resource type, indicating whether non-CPU agent Intel RDT
monitoring or control is present. CPUID.0FH.ResID=1:EAX[10:9] represents the presence of CMT and MBM
features for non-CPU agents. CPUID.10H.ResID=1:ECX[1] represents the presence of the CAT feature for non-CPU
agents.
Specifically, for non-CPU Agent Intel RDT Monitoring (see Figure 20-21):
• Bits are added in the CPU Agent Intel RDT CMT/MBM leaf: CPUID.0FH.ResID=1:EAX[10:9].
- EAX[bit 9]: If set, indicates the presence of non-CPU Agent Cache Occupancy Monitoring (the equivalent of
CPU Agent Intel RDT's CMT feature).
20-72
Vol. 3B
DEBUG, BRANCH PROFILE, TSC, AND INTEL® RESOURCE DIRECTOR TECHNOLOGY (INTEL® RDT) FEATURES
- EAX[bit 10]: If set, indicates the presence of non-CPU Agent memory L3 external BW monitoring (the
equivalent of CPU Agent Intel RDT's MBM feature).
For non-CPU Agent Intel RDT Allocation (see Figure 20-32):
• New bit in L3 CAT leaf: CPUID.10H.ResID=1:ECX[1].
- ECX[bit 1]: If set, indicates the presence of non-CPU Agent Cache Allocation Technology (the equivalent of
CPU Agent Intel RDT's L3 CAT feature).
• As before, ECX[bit 2] indicates that L3 CDP is supported if set.
Note that no equivalent bits are defined in CPUID.10H.ResID=2 as there is no ability for devices to fill into core L2
caches.
If any of these non-CPU agent Intel RDT enumeration bits are set, indicating that a monitoring feature or allocation
feature is present, it also indicates the presence of the IA32_L3_IO_RDT_CFG architectural MSR. This MSR may be
used to enable the non-CPU agent Intel RDT features. See Section 20.20.2 for MSR details.
The presence of Intel RDT is a prerequisite for using the equivalent non-CPU agent Intel RDT feature. If a particular
CPU agent Intel RDT feature is absent, any attempt to use non-CPU agent Intel RDT equivalents will result in
general protection faults in the MSR interface. Attempts to enable unsupported features in the I/O complex will
result in writes to the corresponding MMIO enable or configuration interfaces being ignored.
Software may use the existing CPUID leaves to gather the maximum number of RMID and CLOS tags for each
resource level (e.g., L3 cache), and non-CPU agent Intel RDT is also subject to these limits.
Some platforms may support a mix of features, for instance, supporting L3 CAT architectural controls and the non-
CPU agent Intel RDT equivalent, but no CMT/MBM monitoring or non-CPU agent monitoring equivalent, and these
capabilities should be enumerated on a per-platform basis.
20.20.1.2 ACPI Enumeration
When support for non-CPU agent Intel RDT features is detected using CPUID, ACPI may be consulted for further
details on the level of feature support, device structures behind various I/O ports, and the specific MMIO interfaces
used to control a given device.
Non-CPU agent Intel RDT enumeration is via the “IRDT” ACPI table. For more information, refer to the “Intel®
Resource Director Technology Architecture Specification.”
20.20.2 Non-CPU Agent Intel® RDT Feature Enable MSR
Before configuring non-CPU agent Intel RDT through MMIO, the feature should be enabled using the non-CPU
agent Intel RDT Feature Enable MSR, IA32_L3_IO_RDT_CFG (MSR address 0C83H). As described in Section
20.20.1.1, the presence of one or more CPUID bits indicating support for one or more non-CPU agent Intel RDT
features also indicates the presence of this MSR. This MSR may be used to enable the non-CPU agent Intel RDT
features.
Two bits are defined in this MSR. Bit 0, when set, enables non-CPU agent RDT resource allocation features. Bit 1,
when set, enables non-CPU agent Intel RDT monitoring features.
The L3 Non-CPU agent Intel RDT Monitoring Enable bit is supported if CPUID indicates that one or more non-CPU
agent Intel RDT resource monitoring features are present.
The L3 Non-CPU agent Intel RDT Allocation Enable bit is supported if CPUID indicates that one or more non-CPU
agent Intel RDT resource allocation features are present.
The default value is 0x0, so both classes of features are disabled by default. All bits not defined are reserved.
Writing a non-zero value to any reserved bit will generate a General Protection Fault (#GP(0)).
This MSR is scoped at the L3 cache level and is cleared on system reset. It is expected that the software will
configure this MSR consistently across all L3 caches that may be present on that package.
The definition of the IA32_L3_IO_RDT_CFG MSR is shown in Figure 20-42.
Vol. 3B
20-73

DEBUG, BRANCH PROFILE, TSC, AND INTEL® RESOURCE DIRECTOR TECHNOLOGY (INTEL® RDT) FEATURES
63
2
1
0
Reserved
M
A
IRME = L3 Non-CPU Agent Intel® RDT Monitoring Enable
IRAE = L3 Non-CPU Agent Intel® RDT Allocation Enable
Figure 20-42. Layout of the IA32_L3_IO_RDT_CFG MSR for Enabling Non-CPU Agent Intel® RDT
20.20.3 Asymmetrical Enumeration of Intel® RDT Features
The enumeration of RDT has been extended to platforms that enumerate asymmetrical resources. For example,
hybrid platforms (supporting multiple processor types) may contain multiple last-level caches (LLCs) with different
capabilities, or some processors may not include an LLC at the same enumeration level. Software should consider
the following changes to RDT enumeration to enable full RDT capabilities across all platforms. Asymmetrical RDT
CPUID leaves 27H and 28H may enumerate distinct capabilities between logical processors on the platform, while
CPUID RDT leaves 0FH and 10H may enumerate the common set of capabilities to ensure software compatibility.
Asymmetrical RDT CPUID leaves should be enumerated per logical processor to identify differences in capabilities.
The enumeration of RDT technologies first consists of the following four CPUID leaf 07H bits in Table 20-22 and the
corresponding CPUID leaves in Table 20-23.
Table 20-22. Asymmetrical Enumeration
CPUID Enumeration
Field Name
Description
CPUID.07H.00H:EBX.RDT_M[12]
RDT_M
Specifies that the RDT-M symmetrical enumeration is available on all
logical processors.
CPUID.07H.00H:EBX.RDT_A[15]
RDT_A
Specifies that the RDT-A symmetrical enumeration is available on all
logical processors.
CPUID.07H.01H:ECX.RDT_M_
Asymmetric RDT-M
Specifies that logical processors on this platform may support RDT-M;
ASYM[0]
but is not guaranteed.
CPUID.07H.01H:ECX.RDT_A_
Asymmetric RDT-A
Specifies that logical processors on this platform may support RDT-A;
ASYM[1]
but is not guaranteed.
Table 20-23. Asymmetrical CPUID Leaves
CPUID Enumeration
CPUID Leaf
Description
CPUID.07H.00H:EBX.RDT_M[12]
Leaf 0FH
This leaf provides the same values regardless of the logical processor
querying leaf 0FH.
CPUID.07H.00H:EBX.RDT_A[15]
Leaf 10H
This leaf provides the same values regardless of the logical processor
querying leaf 10H.
CPUID.07H.01H:ECX.RDT_M_
Leaf 27H
This leaf can return different values between logical processors
ASYM[0]
querying leaf 27H.
CPUID.07H.01H:ECX.RDT_A_
Leaf 28H
This leaf can return different values between logical processors
ASYM[1]
querying leaf 28H.
20-74
Vol. 3B
DEBUG, BRANCH PROFILE, TSC, AND INTEL® RESOURCE DIRECTOR TECHNOLOGY (INTEL® RDT) FEATURES
The Asymmetrical RDT-M leaf 27H and subleaves have the same definitions as RDT-M leaf 0FH. The Asymmetrical
RDT-A leaf 28H and subleaves have the same definitions as RDT-A leaf 10H. Symmetrical platforms may enumerate
the existence of asymmetrical leaves, and therefore cannot be used to determine a system is asymmetrical.
The data provided in the asymmetrical leaves 27H and 28H are supersets of leaves 0FH and 10H. The enumeration
and capabilities returned through these leaves can be any of the following:
• Enumerating either leaves 27H or 28H is not indicative that leaves 0FH or 10H would be supported.
• Leaves 0FH and/or 10H may return a smaller subset than the intersection of features across resources where
either leaves 27H or 28H exist on a platform.
• Leaves 0FH and/or 10H may return the intersection of features across resources where either leaves 27H or
28H exist on a platform.
• Leaves 0FH and/or 10H may be enumerated but contain no information where either leaves 27H or 28H exist
on a platform.
The enumeration provided in leaves 0FH and 10H do not have a requirement to provide resource feature informa-
tion on a platform where leaves 27H or 28H exist.
Software should use the following algorithm to detect support of Intel® RDT Monitoring:
IF CPUID.(EAX=07H,ECX=01H):ECX.Asymmetrical RDT-M[Bit 0] = 1 THEN
// Perform asymmetrical enumeration using leaf 27H
ELSE IF CPUID.(EAX=07H,ECX=01H):EBX.RDT-M[Bit 12] = 1 THEN
// Perform symmetrical enumeration using leaf 0FH
ELSE
// Intel® Resource Directory Technology Monitoring is not supported.
ENDIF
ENDIF
Software should use the algorithm below to detect support of Intel® RDT Allocation:
IF CPUID.(EAX=07H,ECX=01H):ECX.Asymmetrical RDT-A[Bit 1] = 1 THEN
// Perform asymmetrical enumeration using leaf 28H
ELSE IF CPUID.(EAX=07H,ECX=01H):EBX.RDT-A[Bit 15] = 1 THEN
// Perform symmetrical enumeration using leaf 10H
ELSE
// Intel® Resource Directory Technology Allocation is not supported.
ENDIF
ENDIF
The asymmetrical leaves are required to be read on each logical processor. Software may determine the intersec-
tion of features across all logical processors, or software may group logical processors with matching feature sets.
Logical processors that share a resource will report the same feature support for that resource. An example would
be to enumerate each set of logical processors sharing an L3 cache, reading CPUID leaf 28H for L3 CAT on one
logical processor sharing each L3 cache and applying those settings to all logical processors sharing the same L3
cache.
Vol. 3B
20-75
DEBUG, BRANCH PROFILE, TSC, AND INTEL® RESOURCE DIRECTOR TECHNOLOGY (INTEL® RDT) FEATURES
20.21 INTEL® RDT DERIVATIVE TECHNOLOGIES
This section describes Intel RDT derivative technologies. These technologies are based on RDT technologies and
may provide simplified hardware/software interfaces. See following sections for multiple technologies which build
atop RDT.
20.21.1 Core Telemetry for Intel® Platform Monitoring Technology (PMT)
Core telemetry is part of the Intel® Platform Monitoring Technology (Intel® PMT) feature set. Processors that
support core telemetry collect per-core telemetry during core execution (including the execution context of the
core - e.g., Resource Monitoring ID or RMID), aggregate the data internally, and report them to external agents,
enabling workload-level tracking. This telemetry may be used by external agents to monitor processor behavior, to
improve placement of workloads in data centers, increase resource utilization, monitor energy consumption, etc.
The telemetry collected is processor-specific. For information about Intel® PMT refer to the Intel® Platform Moni-
toring Technology External Specification.
To avoid creating a side channel that might leak information from trusted execution environments (TEEs), core
telemetry collected during TEE execution is discarded by the processor. Specifically, out-of-band core telemetry is
discarded if it was collected while the core was running in any of the following situations:
• During execution of an enclave supported by Intel® Software Guard Extensions (Intel® SGX). This is true even
for enclave debug following an opt-in entry.
• During execution of an authenticated code module.
• During execution in SEAM root operation.
• During execution in SEAM non-root operation, unless the “allow SEAM-guest telemetry” VM-entry control is 1.
For information about SEAM (secure arbitration mode), see Chapter 35.
20.21.2 Resource Priority
Resource priority (RP) is a priority-based architectural interface that allows for biasing resource allocation of shared
resources to higher priority threads.
RP provides software with a simplified means to indicate priority to RP-capable hardware without the need to
manage specific allocation configurations that may vary with each generation of hardware, such as how much L3
cache is relevant.
The Resource Priority control logic in hardware evaluates per-thread priority values that are targeting a shared
resource and applies work conserving algorithm to ensure resource is optimally allocated if higher priority thread is
not using the shared resource.
20.21.2.1 Resource Priority Enumeration Details
As an RDT derivative technology, Resource Priority requires an enumeration flow which combines information from
CPUID and the Advanced Configuration and Power Interface (ACPI) specification. Before using RP, it is recom-
mended to consult both this documentation and the RDT Architecture Specification, version 1.4 or newer.
Resource Priority uses the CPUID instruction to enumerate supported hardware feature details and the level of
support. Architectural Model-Specific Registers (MSRs) are used as part of the enable interface, as described in
Section 20.21.2.2.
Resource Priority also requires firmware support in the form of BIOS pre-configuration of the mapping of amounts
of resources to priority levels, in order to simplify OS usage. Firmware support on a given platform may be
confirmed through ACPI, as described in detail in the RDT Architecture Specification, version 1.4 or newer.
Resource Priority builds on Intel RDT’s architectural constructs by extending CPUID to indicate the presence and
integration of RP and by providing rich enumeration information in vendor-specific extensions to the Advanced
Configuration and Power Interface (ACPI), in particular in the Collaborative Processor Performance Control (CPPC)
table, documented in the Advanced Configuration and Power Interface (ACPI) Specification, version 6.6 or newer.
20-76
Vol. 3B

DEBUG, BRANCH PROFILE, TSC, AND INTEL® RESOURCE DIRECTOR TECHNOLOGY (INTEL® RDT) FEATURES
Usage details including the required flow that software should follow to first enumerate, verify pre-configuration of
resource associations, then use the RP feature are described in the RDT Architecture Specification, version 1.4 or
newer.
20.21.2.1.1 CPUID-Based Enumeration
Resource Priority is an RDT allocation technology enumerated by CPUID. The technology is present when all of the
following are true.
• If CPUID.07H.00H:EBX.RDT_A[15] is 1, the processor supports software control over shared processor
resources.
• If CPUID.10H.00H:EBX[6] is 1, the processor supports RP baseline capabilities and enumerates them in
CPUID.10.06H.
The RP baseline capabilities and requirements are reported by CPUID.10H.06H as follows. (Note the MSR defini-
tions are described in a following section.)
• When CPUID.10H.06H:EAX.THREAD_ENABLE[0] is 1, software should enable RP in each logical processor’s
IA32_RESOURCE_PRIORITY MSR.
• When CPUID.10H.06H:EAX.PACKAGE_ENABLE[1] is 1, software should enable RP in the
IA32_RESOURCE_PRIORITY_PKG MSR of each physical processor package.
The processor will provide uniform RP support across all logical processors in a platform. Thus, the contents of the
CPUID.10H.06H and CPUID.28H.06H CPUID sub-leaves, if supported, will be identical.
Figure 20-43. CPUID.10H.06H, RP Feature Details Identification
Vol. 3B
20-77

DEBUG, BRANCH PROFILE, TSC, AND INTEL® RESOURCE DIRECTOR TECHNOLOGY (INTEL® RDT) FEATURES
CPUID.10H.06H:EDX[15:0] will remain reserved and return zeroes to support the operation of the CLOS width
formula in Section 20.19.4.4.
20.21.2.1.2 ACPI Enumeration
After support for RP is detected using CPUID, the Continuous Performance Control (“_CPC”) object method defined
by the ACPI CPPC feature should be consulted to confirm BIOS support is present and that BIOS has preconfigured
RP resource mappings. The “_CPC” object method then enumerates the number of priority levels and priority MSR
which is used to set priority level for the thread. On Intel platforms, the priority MSR field contains the address of
the IA32_PQR_ASSOC MSR.
RP firmware support enumeration is through ACPI (see ACPI Specification version 6.6 or newer for the definition of
Collaborative Processor Performance Control (CPPC) and its component objects and data entries). See the Intel®
Resource Director Technology Architecture Specification for additional details including ACPI usage flow.
The fields above are described in the Continuous Performance Control (“_CPC”) section of the ACPI specification,
within the “Resource Priority Register Descriptor” field.
20.21.2.2 Resource Priority Feature Enable MSRs
When enumerated by CPUID.10H.06H as described previously, the per-thread IA32_RESOURCE_PRIORITY MSR
controls the operation of RP for its associated logical processor. For each logical processor, software sets the MSR’s
ENABLE field (bit 0) to 1 to enable RP.
In a similar manner, when enumerated by CPUID.10H.06H, the per-package IA32_RESOURCE_PRIORITY_PKG
MSR controls the operation of RP for the associated physical processor package. All logical processors within a
package share the same MSR. For each physical processor package, software sets the MSR’s ENABLE field (bit 0) to
1 to enable RP.
Before using RP, software should set the per-package enable bits in the IA32_RESOURCE_PRIORITY_PKG MSR, if
supported, and then the per-logical-processor enable bits in IA32_RESOURCE_PRIORITY MSR, if supported.
While an overview of the CPUID, MSR, ACPI definitions are described in this section, more details including enable
and disable flows are in the Intel® Resource Director Technology (Intel® RDT) Architecture Specification, version
1.4 or newer.
63
0
Reserved
EN
IA32_RESOURCE_PRIORITY
63
0
Reserved
EN
IA32_RESOURCE_PRIORITY_PKG
Figure 20-44. IA32_RESOURCE_PRIORITY and IA32_RESOURCE_PRIORITY_PKG Layouts
20-78
Vol. 3B
CHAPTER 21
LAST BRANCH RECORDS
NOTE
This chapter defines a last-branch recording (LBR) facility that is architectural and part of the Intel
64 architecture. This facility is an enhancement of but distinct from earlier LBR facilities that were
not architectural. Those earlier facilities are documented in Chapter 20.
Support of the architectural LBR feature in a logical processor is reported in CPUID.07H.00H:EDX[19]=1. When the
architectural LBR feature is supported, capability details like the number of LBR records that are available is indi-
cated in CPUID.1CH:EAX[7:0]. The number of LBR records available varies across processor generations, so soft-
ware should only access the available LBR records indicated by CPUID.1CH:EAX[7:0].
Last Branch Records (LBRs) enable recording of software path history by logging taken branches and other control
flow transfers within processor registers. Each LBR record or entry is comprised of three MSRs:
• IA32_LBR_x_FROM_IP - Holds the source IP of the operation.
• IA32_LBR_x_TO_IP - Holds the destination IP of the operation.
• IA32_LBR_x_INFO - Holds metadata for the operation, including mispredict, TSX, and elapsed cycle time infor-
mation.
LBR records are stored in age order. The most recent LBR entry is stored in IA32_LBR_0_*, the next youngest in
IA32_LBR_1_*, and so on. When an operation to be recorded completes (retires) with LBRs enabled
(IA32_LBR_CTL.LBREn=1), older LBR entries are shifted in the LBR array by one entry, then a record of the new
operation is written into entry 0. See Section 21.1.1 for the list of recorded operations.
The number of LBR entries available for recording operations is dictated by the value in IA32_LBR_DEPTH.DEPTH.
By default, the DEPTH value matches the maximum number of LBRs supported by the processor, but software may
opt to use fewer in order to achieve reduced context switch latency.
In addition to the LBRs, there is a single Last Event Record (LER). It records the last taken branch preceding the
last exception, hardware interrupt, or software interrupt. Like LBRs, the LER is comprised of three MSRs
(IA32_LER_FROM_IP, IA32_LER_TO_IP, IA32_LER_INFO), and is subject to the same dependencies on enabling
and filtering.
Which operations are recorded in LBRs depends upon a series of factors:
• Branch Type Filtering - Software must opt in to the types of branches to be logged; see Section 21.1.2.3.
• Current Privilege Level (CPL) - LBRs can be filtered based on CPL; see Section 21.1.2.5.
• LBR Freeze - LBR and LER recording can be suspended by setting IA32_PERF_GLOBAL_STATUS.LBR_FRZ to 1.
See Section 20.4.7 for details on LBR_FRZ.
On some implementations, recording LBRs may require constraining the number of operations that can complete in
a cycle. As a result, on these implementations, enabling LBRs may have some performance overhead.
21.1
BEHAVIOR
21.1.1 Logged Operations
LBRs can log most control flow transfer operations.
The source IP recorded for a branch instruction is the IP of that instruction. For events that take place between
instructions, the source IP recorded is the IP of the next sequential instruction.
The destination IP recorded is always the target of the branch or event, the next instruction that will execute.
The full list of operations and the respective IPs recorded is shown in Table 21-1.
Vol. 3B
21-1

LAST BRANCH RECORDS
Table 21-1. LBR IP Values for Various Operations
Operation
FROM_IP
TO_IP
Taken Branch1, Exception, INT3, INTn,
Current IP
Target IP
INTO, TSX Abort
Interrupt
Next IP
Target IP
INIT (BSP)
Next IP
Reset Vector
INIT (AP) + SIPI
Next IP
SIPI Vector
EENTER/ERESUME + EEXIT/AEX
Current IP
Target or Trampoline IP
RSM2
Target IP
Target IP
#DB, #SMI, VM exit, VM entry
None
None
NOTES:
1. Direct CALLs with displacement zero, for which the target is typically the next sequential IP, are not treated as
taken branches by LBRs.
2. RSM is only recorded in LBRs when IA32_DEBUGCTL.FREEZE_WHILE_SMM is set to 0.
21.1.2 Configuration
21.1.2.1 Enabling and Disabling
LBRs are enabled by setting IA32_LBR_CTL.LBREn to 1.
Some operations, such as entry to a secure mode like SMM or Intel SGX, can cause LBRs to be temporarily
disabled. Other operations, such as debug exceptions or some SMX operations, disable LBRs and require software
to re-enable them. Details on these interactions can be found in Section 21.1.4.
21.1.2.2 LBR Depth
The number of LBRs used by the processor can be constrained by modifying the IA32_LBR_DEPTH.DEPTH value.
DEPTH defaults to the maximum number of LBRs supported by the processor. Allowed DEPTH values can be found
in CPUID.1CH:EAX[7:0].
Reducing the LBR depth can result in improved performance, by reducing the number of LBRs that need to be read
and/or context switched.
On a software write to IA32_LBR_DEPTH, all LBR entries are reset to 0. LERs are not impacted.
A RDMSR or WRMSR to any IA32_LBR_x_* MSRs, such that x ≥ DEPTH, will generate a #GP exception. Note that
the XSAVES and XRSTORS instructions access only the LBRs associated with entries 0 to DEPTH-1.
By clearing the LBR entries on writes to IA32_LBR_DEPTH, and forbidding any software writes to LBRs ≥ DEPTH, it
is thereby guaranteed that any LBR entries equal to or above DEPTH will have value 0.
21.1.2.3 Branch Type Enabling and Filtering
Software must opt in to the types of branches that are desired to be recorded. These elections are made in
IA32_LBR_CTL; see Section 21.2. Branch type options are listed in Table 21-2; only those enabled will be recorded.
21-2
Vol. 3B

LAST BRANCH RECORDS
Table 21-2. Branch Type Filtering Details
Branch Type
Operations Recorded
COND
Jcc, J*CXZ, and LOOP*
NEAR_IND_JMP
JMP r/m*
NEAR_REL_JMP
JMP rel*
NEAR_IND_CALL
CALL r/m*
NEAR_REL_CALL
CALL rel* (excluding CALLs to the next sequential IP)
NEAR_RET
RET (0C3H)
OTHER_BRANCH
JMP/CALL ptr*, JMP/CALL m*, RET (0C8H), SYS*, interrupts, exceptions (other than debug
exceptions), IRET, INT3, INTn, INTO, TSX Abort, EENTER, ERESUME, EEXIT, AEX, INIT, SIPI, RSM
These encodings match those in IA32_LBR_x_INFO.BR_TYPE.
Control flow transfers that are not recorded include #DB, VM exit, VM entry, and #SMI.
21.1.2.4 Call-Stack Mode
The LBR array is, by default, treated as a ring buffer that captures control flow transitions. However, the finite
depth of the LBR array can be limiting when profiling certain high-level languages (e.g., C++), where a transition
of the execution flow is accompanied by a large number of leaf function calls. These calls to leaf functions, and their
returns, are likely to displace the main execution context from the LBRs.
When call-stack mode is enabled, the LBR array can capture unfiltered call data normally, but as return instructions
are executed the last captured branch (call) record is flushed from the LBRs in a last-in first-out (LIFO) manner.
Thus, branch information pertaining to completed leaf functions will not be retained, while preserving the call stack
information of the main line execution path.
Call-stack mode is enabled by setting IA32_LBR_CTL.CALL_STACK to 1. When enabled, near RET instructions
receive special treatment. Rather than adding a new record in LBR_0, a near RET will instead “pop” the CALL entry
at LBR_0 by shifting entries LBR_1..LBR_[DEPTH-1] up to LBR_0..LBR_[DEPTH-2], and clearing LBR_[DEPTH-1] to
0. Thus, LBR processing software can consume only valid call-stack entries by reading until finding an entry that is
all zeros.
Call-stack mode should be used with branch type enabling configured to capture only CALLs (NEAR_REL_CALL and
NEAR_IND_CALL) and RETs (NEAR_RET). When configured in this manner, the LBR array emulates a call stack,
where CALLs are “pushed” and RETs “pop” them off the stack. If other branch types (JCC, NEAR_*_JMP, or
OTHER_BRANCH) are enabled for recording with call-stack mode, LBR behavior may be undefined.
It is recommended that call-stack mode be used along with CPL filtering, by setting at most one of the OS and USR
bits in the IA32_LBR_CTL MSR. Call-stack mode does not emulate the stack switch that can occur on CPL transi-
tions, and hence monitoring all CPLs may result in a corrupted LBR call stack.
Call-Stack Mode and LBR Freeze
When IA32_DEBUGCTL.FREEZE_LBRS_ON_PMI=1, IA32_PERF_GLOBAL_STATUS.LBR_FRZ will be set to 1 when a
PMI is pended. That will cause LBRs and LERs to cease recording branches until LBR_FRZ is cleared. Because there
may be some “skid”, or instructions retiring, in between the PMI being pended and the PMI being taken, it is
possible that some branches may be missing from the LBRs. In the case of call-stack mode, if a CALL or RET is
missed, that can lead to confusing results where CALL entries fail to get “popped” off the stack, and RETs “pop” the
wrong CALLs.
An alternative is to utilize CPL filtering to limit LBR recording to less privileged modes only (CPL>3) instead of using
the FREEZE_LBRS_ON_PMI=1 feature. This will record branches in the “skid”, but avoid recording any branches in
the privilege level 0 handler.
Vol. 3B
21-3

LAST BRANCH RECORDS
21.1.2.5 CPL Filtering
Software must opt in to which CPL(s) will have branches recorded. If IA32_LBR_CTL.OS=1, then branches in
CPL=0 can be recorded. If IA32_LBR_CTL.USR=1, then branches in CPL>0 can be recorded. For operations which
change the CPL, the operation is recorded in LBRs only if the CPL at the end of the operation is enabled for LBR
recording. In cases where the CPL transitions from a value that is filtered out to a value that is enabled for LBR
recording, the FROM_IP address for the recorded CPL transition branch or event will be 0FFFFFFFFFFFFFFFFH.
21.1.3 Record Data
21.1.3.1 IP Fields
The source and destination IP values in IA32_LBR_x_[FROM|TO]_IP and IA32_LER_x_[FROM|TO]_IP may hold
effective IPs or linear IPs (LIPs), depending on the processor generation. The effective IP is the offset from the CS
base address, while LIP includes the CS base address. Which IP type is used is indicated in CPUID.1CH:EAX[31].
The value read from this field will always be canonical. Note that this includes the case where a canonical violation
(#GP) results from executing sequential code that runs precisely to the end of the lower canonical address space
(where IP[63:MAXLINADDR-1] is 0, but IP[MAXLINADDR-2:0] is all ones). In this case, the FROM_IP will hold the
lowest canonical address in the upper canonical space, such that IP[63:MAXLINADDR-1] is all ones, and
IP[MAXLINADDR-2:0] is 0.
In some cases, due to CPL filtering, the FROM_IP of the recorded operation may be filtered out. In this case
0FFFFFFFFFFFFFFFFH will be recorded. See Section 21.1.2.5 for details.
Writes of these fields will be forced canonical, such that the processor ignores the value written to the upper bits
(IP[63:MAXLINADDR-1]).
21.1.3.2 Branch Types
The IA32_LBR_x_INFO.BR_TYPE and IA32_LER_INFO.BR_TYPE fields encode the branch types as shown in Table
21-3.
Table 21-3. IA32_LBR_x_INFO and IA32_LER_INFO Branch Type Encodings
Encoding
Branch Type
0000B
COND
0001B
NEAR_IND_JMP
0010B
NEAR_REL_JMP
0011B
NEAR_IND_CALL
0100B
NEAR_REL_CALL
0101B
NEAR_RET
011xB
Reserved
1xxxB
OTHER_BRANCH
For a list of branch operations that fall into the categories above, see Table 21-2. In future generations, BR_TYPE
bits 2:0 may be used to distinguish between differing types of OTHER_BRANCH.
21.1.3.3 Cycle Time
Each time an operation is recorded in an LBR, the value of the LBR cycle timer is recorded in
IA32_LBR_x_INFO.CYC_CNT. The LBR cycle timer is a saturating counter that counts at the processor clock rate.
Each time an operation is recorded in an LBR, the counter is reset but continues counting.
21-4
Vol. 3B
LAST BRANCH RECORDS
There is an LBR cycle counter valid bit, IA32_LBR_x_INFO.CYC_CNT_VALID. When set, the CYC_CNT field holds a
valid value, the number of elapsed cycles since the last operation recorded in an LBR (up to 0FFFFH).
Some implementations may opt to reduce the granularity of the CYC_CNT field for larger values. The implication of
this is that the least significant bits may be forced to 1 in cases where the count has reached some minimum
threshold. It is guaranteed that this reduced granularity will never result in an inaccuracy of more than 10%.
21.1.3.4 Mispredict Information
IA32_LBR_x_INFO.MISPRED provides an indication of whether the recorded branch was predicted incorrectly by
the processor. The bit is set if either the taken/not-taken direction of a conditional branch was mispredicted, or if
the target of an indirect branch was mispredicted.
21.1.3.5 Intel® TSX Information
IA32_LBR_x_INFO.IN_TSX indicates whether the operation recorded retired during a TSX transaction.
IA32_LBR_x_INFO.TSX_ABORT indicates that the operation is a TSX Abort.
21.1.3.6 LBR Event Logging
LBR Event Logging provides a means to log PMU event data in LBRs. This event data can be used to provide some
causality information for the Cycle Time metadata currently recorded in the LBRs' IA32_LBR_x_INFO.CYC_CNT
field (also known as Timed LBR).
When a programmable counter is enabled for a precise event and LBR is enabled, setting EN_LBR_LOG (bit 35) in
the associated IA32_PERFEVTSELx MSR enables occurrences of the chosen event to be additionally logged in a new
IA32_LBR_INFO.PMCx_CNT field. This two-bit field represents the number of occurrences of the event since retire-
ment of the operation that last recorded an LBR entry, saturating at a value of 3. For example, this field is called
PMC0_CNT at bits 33:32 of the IA32_LBR_x_INFO MSR for general-purpose counter 0. The same bits in the
IA32_LER_x_INFO MSRs continue to be reserved.
If the event chosen in the IA32_PERFEVTSELx is MSR not precise, no counts will be logged in LBRs. The events that
are precise on a given platform can be found in the online event list: https://perfmon-events.intel.com/.
When using LBR Event Logging, software should keep consistent CPL filtering settings between LBR and PerfMon.
Keeping the OS/USR bits in the IA32_LBR_CTL MSR and in the IA32_PERFEVTSELx MSR consistent ensures that
only events that occur in one or more chosen modes are logged. Similarly, software should keep
FREEZE_LBRS_ON_PMI and FREEZE_PERFMON_ON_PMI in the IA32_DEBUGCTL MSR consistent. Other counter
filtering in the IA32_PERFEVTSELx MSRs (e.g., INV, CMASK, EDGE, and IN_TX) should be cleared; otherwise the
behavior and PMCx_CNT values are undefined.
Per-counter support for LBR Event Logging is indicated by the “Event Logging Supported” bitmap in
CPUID.1CH.00H:ECX[19:16].
21.1.4 Interaction with Other Processor Features
21.1.4.1 SMM
IA32_LBR_CTL.LBREn is saved and cleared on #SMI, and restored on RSM. As a result of disabling LBRs, the #SMI
is not recorded. RSM is recorded only if IA32_DEBUGCTL.FREEZE_WHILE_SMM is set to 0, and the FROM_IP will be
set to the same value as the TO_IP.
21.1.4.2 SMM Transfer Monitor (STM)
LBREn is not cleared on #SMI when it causes SMM VM exit. Instead, the STM should use the VMCS controls
described in Section 21.1.4.3 to disable LBRs while in SMM, and to restore them on VM entries that exit SMM.
On VMCALL to configure STM, IA32_LBR_CTL is cleared.
Vol. 3B
21-5

LAST BRANCH RECORDS
21.1.4.3 VMX
By default, LBR operation persists across VMX transitions. However, VMCS fields have been added to enable
constraining LBR usage to within non-root operation only. See details in Table 21-4.
Table 21-4. LBR VMCS Fields
Name
Type
Bit Position
Behavior
Guest IA32_LBR_CTL
Guest State Field
NA
The guest value of IA32_LBR_CTL is written to this field on all
VM exits.
Load Guest IA32_LBR_CTL
Entry Control
21
When set, VM entry will write the value from the “Guest
IA32_LBR_CTL” guest state field to IA32_LBR_CTL.
Clear IA32_LBR_CTL
Exit Control
26
When set, VM exit will clear IA32_LBR_CTL after the value has
been saved to the “Guest IA32_LBR_CTL” guest state field.
To enable “guest-only” LBR use, a VMM should set both the “Load Guest IA32_LBR_CTL” entry control and the
“Clear IA32_LBR_CTL” exit control. For “system-wide” LBR use, where LBRs remain enabled across host and
guest(s), a VMM should keep both new VMCS controls clear.
VM entry checks that, if the “Load Guest IA32_LBR_CTL” entry control is 1, bits reserved in the IA32_LBR_CTL MSR
must be 0 in the field for that register.
For additional information relating to VMX transitions, see Chapter 27, Chapter 29, and Chapter 30 in the Intel® 64
and IA-32 Architectures Software Developer’s Manual, Volume 3C.
21.1.4.4 Intel® SGX
On entry to an enclave, via EENTER or ERESUME, logging of LBR entries is suspended. On enclave exit, via EEXIT
or AEX, logging resumes. The cycle counter will continue to run during enclave execution.
An exception to the above is made for opt-in debug enclaves. For such enclaves, LBR logging is not impacted.
21.1.4.5 Debug Exceptions
When a branch happens because of a #DB exception, IA32_LBR_CTL.LBREn is cleared. As a result, the operation is
not recorded.
21.1.4.6 SMX
On GETSEC leaves SENTER or ENTERACCS, IA32_LBR_CTL is cleared. As a result, the operation is not recorded.
21.1.4.7 MWAIT
On an MWAIT that requests a C-state deeper than C1, IA32_LBR_x_* MSRs may be cleared to 0. IA32_LBR_CTL,
IA32_LBR_DEPTH, and IA32_LER_* MSRs will be preserved.
For an MWAIT that enters a C-state equal to or less deep than C1, and all C-states that enter as a result of Hard-
ware Duty Cycling (HDC), all LBR MSRs are preserved.
21.1.4.8 Processor Event-Based Sampling (PEBS)
PEBS records can be configured to include LBRs, by setting PEBS_DATA_CFG.LBREn[3]=1. The number of LBRs to
include in the record is also configurable, via PEBS_DATA_CFG.NUM_LBRS[28:24]. For details on PEBS, see Section
22.9 of the Intel® 64 and IA-32 Architectures Software Developer’s Manual, Volume 3B.
If NUM_LBRS is set to a value greater than LBR_DEPTH, then only LBR_DEPTH entries will be written into the PEBS
record. Further, the Record Size field will be decreased to match the actual size of the record to be written, and the
21-6
Vol. 3B
LAST BRANCH RECORDS
Record Format field will replace the value of NUM_LBRS with the value of LBR_DEPTH. These adjustments ensure
that software is able to properly interpret the PEBS record.
21.2
MSRS
The MSRs that represent the LBR entries (IA32_LBR_x_[TO|FROM|INFO]) and the LER entry
(IA32_LER_[TO|FROM|INFO]) do not fault on writes. Any address field written will force sign-extension based on
the maximum linear address width supported by the processor, and any non-zero value written to undefined bits
may be ignored such that subsequent reads return 0.
On a warm reset, all LBR MSRs, including IA32_LBR_DEPTH, have their values preserved. However, IA32_L-
BR_CTL.LBREn is cleared to 0, disabling LBRs. If a warm reset is triggered while the processor is in the C6 idle
state, also known as warm init, all LBR MSRs will be reset to their initial values.
See Table 2-2 in the Intel® 64 and IA-32 Architectures Software Developer’s Manual, Volume 4, for details on LBR
MSRs.
21.3
FAST LBR READ ACCESS
XSAVES provides a faster means than RDMSR for software to read all LBRs. When using XSAVES for reading LBRs
rather than for context switch, software should take care to ensure that XSAVES does not write LBR state to an
area of memory that has been or will be used by XRSTORS. This could corrupt INIT tracking.
21.4
OTHER IMPACTS
21.4.1 Branch Trace Store on Intel Atom® Processors
Branch Trace Store (BTS) on Intel Atom processors that support the architectural form of the LBR feature has
dependencies on the LBR configuration. BTS will store out the LBR_0 (TOS) record each time a taken branch or
event retires. If any filtering of LBRs is employed, or if LBRs are disabled, some duplicate entries may be stored by
BTS. Like LBRs and LERs, BTS is suspended when IA32_PERF_GLOBAL_STATUS.LBR_FRZ is set to 1.
BTS will change to cease issuing branch records for direct near CALLs with displacement zero to align with LBR
behavior.
21.4.2 IA32_DEBUGCTL
On processors that do not support model-specific LBRs, IA32_DEBUGCTL[bit 0] has no meaning. It can be written
to 0 or 1, but reads will always return 0.
21.4.3 IA32_PERF_CAPABILITIES
On processors that do not support model-specific LBRs, IA32_PERF_CAPABILITIES.LBR_FMT will have the value
03FH.
Vol. 3B
21-7
LAST BRANCH RECORDS
21-8
Vol. 3B
CHAPTER 22
PERFORMANCE MONITORING
Intel 64 and IA-32 architectures provide facilities for monitoring performance via a PMU (Performance Monitoring
Unit).
NOTE
Performance monitoring events can be found here: https://perfmon-events.intel.com/.
Additionally, performance monitoring event files for Intel processors are maintained by Intel. These
files can be downloaded here: https://github.com/intel/perfmon.
22.1
PERFORMANCE MONITORING OVERVIEW
Performance monitoring was introduced in the Pentium processor with a set of model-specific performance-moni-
toring counter MSRs. These counters permit selection of processor performance parameters to be monitored and
measured. The information obtained from these counters can be used for tuning system and compiler perfor-
mance.
In Intel P6 family of processors, the performance monitoring mechanism was enhanced to permit a wider selection
of events to be monitored and to allow greater control events to be monitored. Next, Intel processors based on
Intel NetBurst microarchitecture introduced a distributed style of performance monitoring mechanism and perfor-
mance events.
The performance monitoring mechanisms and performance events defined for the Pentium, P6 family, and Intel
processors based on Intel NetBurst microarchitecture are not architectural. They are all model specific (not
compatible among processor families). Intel Core Solo and Intel Core Duo processors support a set of architectural
performance events and a set of non-architectural performance events. Newer Intel processor generations support
enhanced architectural performance events and non-architectural performance events.
Starting with Intel Core Solo and Intel Core Duo processors, there are two classes of performance monitoring capa-
bilities. The first class supports events for monitoring performance using counting or interrupt-based event
sampling usage. These events are non-architectural and vary from one processor model to another. They are
similar to those available in Pentium M processors. These non-architectural performance monitoring events are
specific to the microarchitecture and may change with enhancements. They are discussed in Section 22.6.3,
“Performance Monitoring (Processors Based on Intel NetBurst® Microarchitecture).” Non-architectural events for a
given microarchitecture cannot be enumerated using CPUID; and they can be found at:
The second class of performance monitoring capabilities is referred to as architectural performance monitoring.
This class supports the same counting and Interrupt-based event sampling usages, with a smaller set of available
events. The visible behavior of architectural performance events is consistent across processor implementations.
Availability of architectural performance monitoring capabilities is enumerated using the CPUID.0AH. These events
are discussed in Section 22.2.
See also:
- Section 22.2, “Architectural Performance Monitoring.”
- Section 22.3, “Performance Monitoring (Intel® Core™ Processors and Intel® Xeon® Processors).”
• Section 22.3.1, “Performance Monitoring for Processors Based on Nehalem Microarchitecture.”
• Section 22.3.2, “Performance Monitoring for Processors Based on Westmere Microarchitecture.”
• Section 22.3.3, “Intel® Xeon® Processor E7 Family Performance Monitoring Facility.”
• Section 22.3.4, “Performance Monitoring for Processors Based on Sandy Bridge Microarchitecture.”
• Section 22.3.5, “3rd Generation Intel® Core™ Processor Performance Monitoring Facility.”
• Section 22.3.6, “4th Generation Intel® Core™ Processor Performance Monitoring Facility.”
Vol. 3B
22-1
PERFORMANCE MONITORING
• Section 22.3.7, “5th Generation Intel® Core™ Processor and Intel® Core™ M Processor Performance
Monitoring Facility.”
• Section 22.3.8, “6th Generation, 7th Generation and 8th Generation Intel® Core™ Processor
Performance Monitoring Facility.”
• Section 22.3.9, “10th Generation Intel® Core™ Processor Performance Monitoring Facility.”
• Section 22.3.10, “12th and 13th Generation Intel® Core™ Processors, and 4th and 5th Generation
Intel® Xeon® Scalable Processor Family Performance Monitoring Facility.”
• Section 22.3.11, “Intel® Series 2 Core™ Ultra Processor Performance Monitoring Facility.”
- Section 22.4, “Performance monitoring (Intel® Xeon™ Phi Processors).”
• Section 22.4.1, “Intel® Xeon Phi™ Processor 7200/5200/3200 Performance Monitoring.”
- Section 22.5, “Performance Monitoring (Intel Atom® Processors).”
• Section 22.5.1, “Performance Monitoring (45 nm and 32 nm Intel Atom® Processors).”
• Section 22.5.2, “Performance Monitoring for Silvermont Microarchitecture.”
• Section 22.5.3, “Performance Monitoring for Goldmont Microarchitecture.”
• Section 22.5.4, “Performance Monitoring for Goldmont Plus Microarchitecture.”
• Section 22.5.5, “Performance Monitoring for Tremont Microarchitecture.”
- Section 22.6, “Performance Monitoring (Legacy Intel Processors).”
• Section 22.6.1, “Performance Monitoring (Intel® Core™ Solo and Intel® Core™ Duo Processors).”
• Section 22.6.2, “Performance Monitoring (Processors Based on Intel® Core™ Microarchitecture).”
• Section 22.6.3, “Performance Monitoring (Processors Based on Intel NetBurst® Microarchitecture).”
• Section 22.6.4, “Performance Monitoring and Intel® Hyper-Threading Technology in Processors Based
on Intel NetBurst® Microarchitecture.”
• Section 22.6.4.5, “Counting Clocks on systems with Intel® Hyper-Threading Technology in Processors
Based on Intel NetBurst® Microarchitecture.”
• Section 22.6.5, “Performance Monitoring and Dual-Core Technology.”
• Section 22.6.6, “Performance Monitoring on 64-bit Intel® Xeon® Processor MP with Up to 8-MByte L3
Cache.”
• Section 22.6.7, “Performance Monitoring on L3 and Caching Bus Controller Sub-Systems.”
• Section 22.6.8, “Performance Monitoring (P6 Family Processor).”
• Section 22.6.9, “Performance Monitoring (Pentium Processors).”
- Section 22.7, “Counting Clocks.”
- Section 22.8, “IA32_PERF_CAPABILITIES MSR Enumeration.”
- Section 22.9, “PEBS Facility.”
- Section 22.10, “Architectural PEBS.”
22.2
ARCHITECTURAL PERFORMANCE MONITORING
Performance monitoring events are architectural when they behave consistently across microarchitectures. Intel
Core Solo and Intel Core Duo processors introduced architectural performance monitoring. The feature provides a
mechanism for software to enumerate performance events and provides configuration and counting facilities for
events.
Architectural performance monitoring does allow for enhancement across processor implementations. The
CPUID.0AH leaf provides version ID for each enhancement. Intel Core Solo and Intel Core Duo processors support
base level functionality identified by version ID of 1. Processors based on Intel Core microarchitecture support, at
a minimum, the base level functionality of architectural performance monitoring. Intel Core 2 Duo processor T
22-2
Vol. 3B
PERFORMANCE MONITORING
7700 and newer processors based on Intel Core microarchitecture support both the base level functionality and
enhanced architectural performance monitoring identified by version ID of 2.
45 nm and 32 nm Intel Atom processors and Intel Atom processors based on the Silvermont microarchitecture
support the functionality provided by versionID 1, 2, and 3; CPUID.0AH:EAX[7:0] reports versionID = 3 to indicate
the aggregate of architectural performance monitoring capabilities. Intel Atom processors based on the Airmont
microarchitecture support the same performance monitoring capabilities as those based on the Silvermont
microarchitecture. Intel Atom processors based on the Goldmont and Goldmont Plus microarchitectures support
versionID 4. Intel Atom processors starting with processors based on the Tremont microarchitecture support
versionID 5.
Intel Core processors and related Intel Xeon processor families based on the Nehalem through Broadwell microar-
chitectures support version ID 3. Intel processors based on the Skylake through Coffee Lake microarchitectures
support versionID 4. Intel processors starting with processors based on the Ice Lake microarchitecture support
versionID 5.
22.2.1 Architectural Performance Monitoring Version 1
Configuring an architectural performance monitoring event involves programming performance event select regis-
ters. There are a finite number of performance event select MSRs (IA32_PERFEVTSELx MSRs). The result of a
performance monitoring event is reported in a performance monitoring counter (IA32_PMCx MSR). Performance
monitoring counters are paired with performance monitoring select registers.
Performance monitoring select registers and counters are architectural in the following respects:
• The bit field layout of IA32_PERFEVTSELx is consistent across microarchitectures. A non-zero write of a field
that is introduced after the initial implementation of architectural performance monitoring (Version 1) results in
#GP if that field is not supported.
• Addresses of IA32_PERFEVTSELx MSRs remain the same across microarchitectures.
• Addresses of IA32_PMC MSRs remain the same across microarchitectures.
• Each logical processor has its own set of IA32_PERFEVTSELx and IA32_PMCx MSRs. Configuration facilities and
counters are not shared between logical processors sharing a processor core.
Architectural performance monitoring provides a CPUID mechanism for enumerating the following information:
• Number of performance monitoring counters available to software in a logical processor (each
IA32_PERFEVTSELx MSR is paired to the corresponding IA32_PMCx MSR).
• Number of bits supported in each IA32_PMCx.
• Number of architectural performance monitoring events supported in a logical processor.
Software can use CPUID to discover architectural performance monitoring availability (CPUID.0AH). The architec-
tural performance monitoring leaf provides an identifier corresponding to the version number of architectural
performance monitoring available in the processor.
The version identifier is retrieved by querying CPUID.0AH:EAX[7:0] (see Chapter 3, “Instruction Set Reference, A-
L,” in the Intel® 64 and IA-32 Architectures Software Developer’s Manual, Volume 2A). If the version identifier is
greater than zero, architectural performance monitoring capability is supported. Software queries the CPUID.0AH
for the version identifier first; it then analyzes the value returned in CPUID.0AH:EAX, CPUID.0AH:EBX to determine
the facilities available.
In the initial implementation of architectural performance monitoring; software can determine how many
IA32_PERFEVTSELx/ IA32_PMCx MSR pairs are supported per core, the bit-width of PMC, and the number of archi-
tectural performance monitoring events available.
Architectural performance monitoring facilities include a set of performance monitoring counters and performance
event select registers. These MSRs have the following properties:
• IA32_PMCx MSRs start at address 0C1H and occupy a contiguous block of MSR address space; the number of
MSRs per logical processor is reported using CPUID.0AH:EAX[15:8]. Note that this may vary from the number
of physical counters present on the hardware, because an agent running at a higher privilege level (e.g., a
VMM) may not expose all counters.
Vol. 3B
22-3
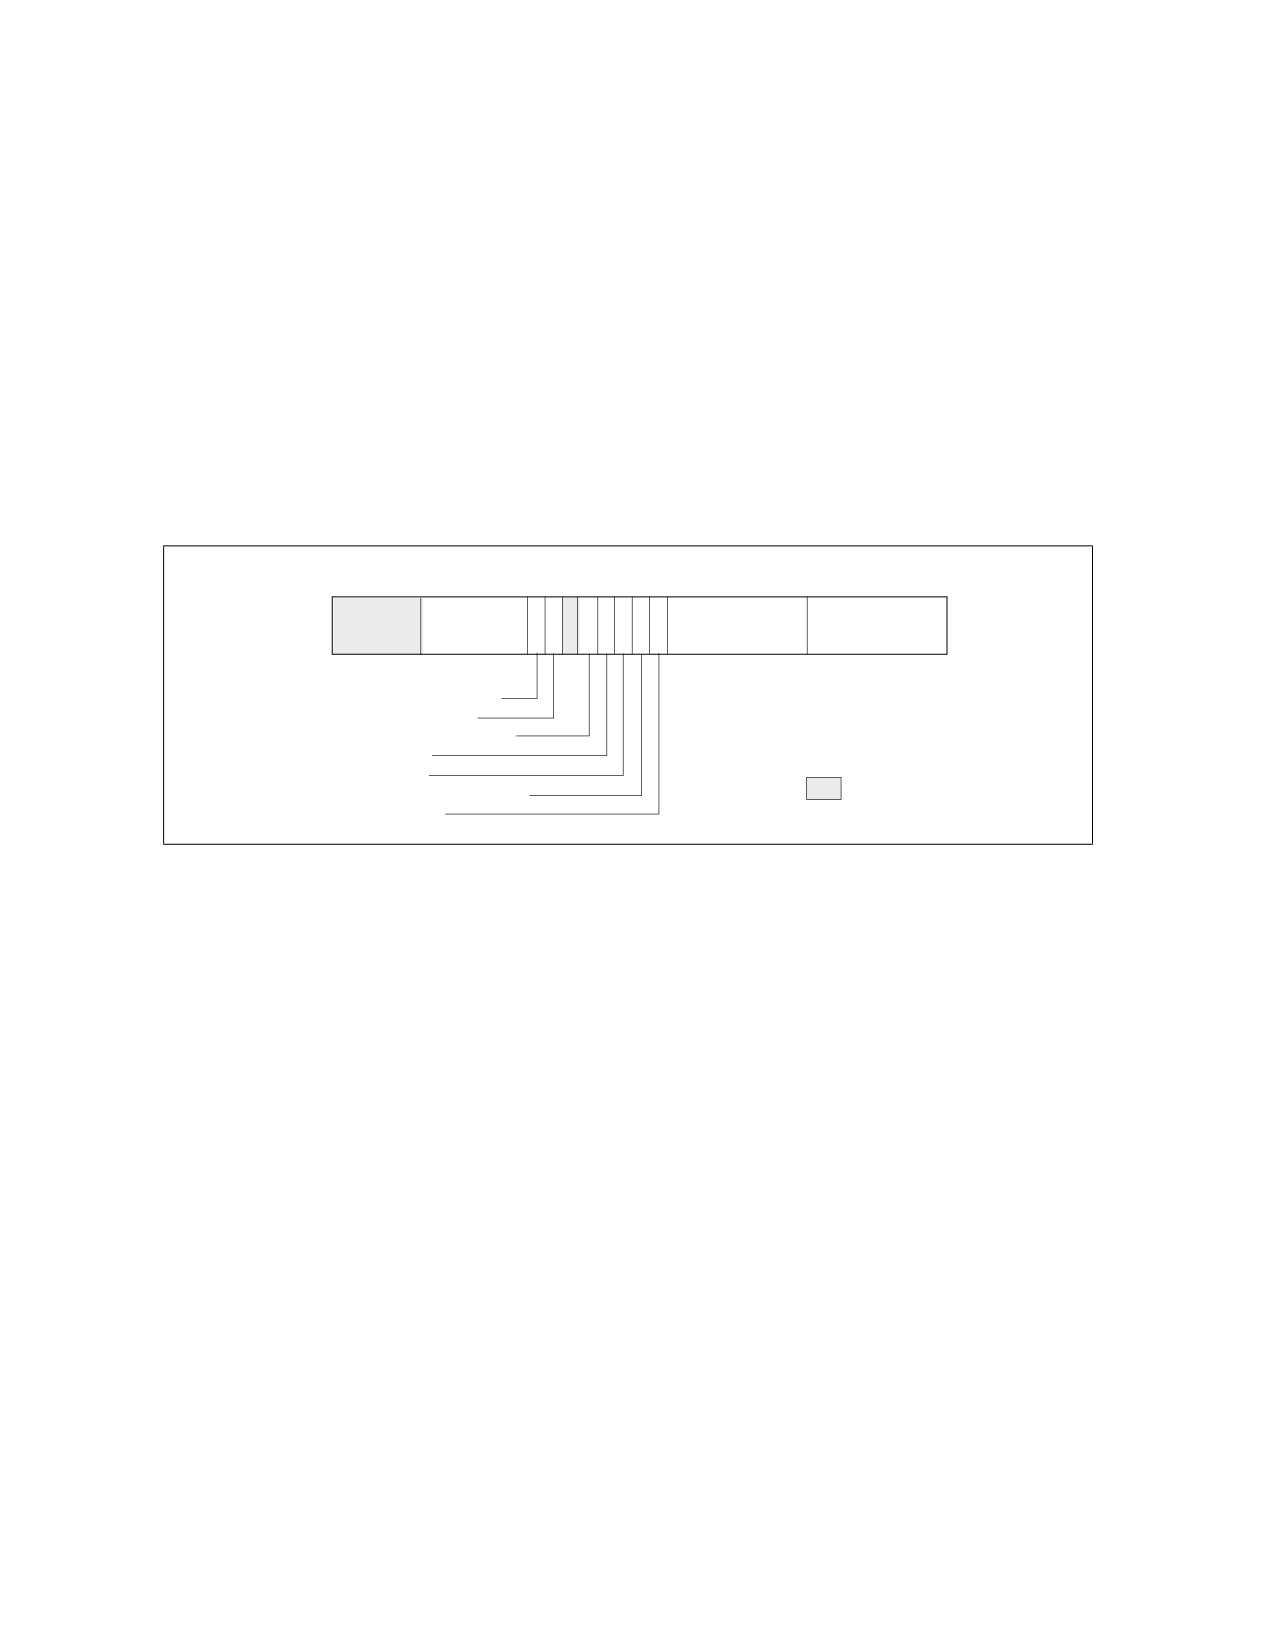
PERFORMANCE MONITORING
• IA32_PERFEVTSELx MSRs start at address 186H and occupy a contiguous block of MSR address space. Each
performance event select register is paired with a corresponding performance counter in the 0C1H address
block. Note the number of IA32_PERFEVTSELx MSRs may vary from the number of physical counters present
on the hardware, because an agent running at a higher privilege level (e.g., a VMM) may not expose all
counters.
• The bit width of an IA32_PMCx MSR is reported using the CPUID.0AH:EAX[23:16]. This the number of valid bits
for read operation. On write operations, the lower-order 32 bits of the MSR may be written with any value, and
the high-order bits are sign-extended from the value of bit 31.
• Bit field layout of IA32_PERFEVTSELx MSRs is defined architecturally.
See Figure 22-1 for the bit field layout of IA32_PERFEVTSELx MSRs. The bit fields are:
•
Event select field (bits 0 through 7) - Selects the event logic unit used to detect microarchitectural
conditions (see Table 22-3, for a list of architectural events and their 8-bit codes). The set of values for this field
is defined architecturally; each value corresponds to an event logic unit for use with an architectural
performance event. The number of architectural events is queried using CPUID.0AH:EAX. A processor may
support only a subset of pre-defined values.
63
31
242322212019181716 15
8 7
0
Counter Mask
I
I
U
N
E
N
P
E
O
S
Unit Mask (UMASK)
Event Select
(CMASK)
N
C
S
V
T
R
INV-Invert counter mask
EN-Enable counters
INT-APIC interrupt enable
PC-Pin control
E-Edge detect
OS-Operating system mode
Reserved
USR-User Mode
Figure 22-1. Layout of IA32_PERFEVTSELx MSRs
•
Unit mask (UMASK) field (bits 8 through 15) - These bits qualify the condition that the selected event
logic unit detects. Valid UMASK values for each event logic unit are specific to the unit. For each architectural
performance event, its corresponding UMASK value defines a specific microarchitectural condition.
A pre-defined microarchitectural condition associated with an architectural event may not be applicable to a
given processor. The processor then reports only a subset of pre-defined architectural events. Pre-defined
architectural events are listed in Table 22-3; support for pre-defined architectural events is enumerated using
CPUID.0AH:EBX.
•
USR (user mode) flag (bit 16) - Specifies that the selected microarchitectural condition is counted when
the logical processor is operating at privilege levels 1, 2 or 3. This flag can be used with the OS flag.
•
OS (operating system mode) flag (bit 17) - Specifies that the selected microarchitectural condition is
counted when the logical processor is operating at privilege level 0. This flag can be used with the USR flag.
•
E (edge detect) flag (bit 18) - Enables (when set) edge detection of the selected microarchitectural
condition. The logical processor counts the number of deasserted to asserted transitions for any condition that
can be expressed by the other fields. The mechanism does not permit back-to-back assertions to be distin-
guished.
This mechanism allows software to measure not only the fraction of time spent in a particular state, but also the
average length of time spent in such a state (for example, the time spent waiting for an interrupt to be
serviced).
•
PC (pin control) flag (bit 19) - Beginning with Sandy Bridge microarchitecture, this bit is reserved (not
writeable). On processors based on previous microarchitectures, the logical processor toggles the PMi pins and
increments the counter when performance-monitoring events occur; when clear, the processor toggles the PMi
pins when the counter overflows. The toggling of a pin is defined as assertion of the pin for a single bus clock
followed by deassertion.
22-4
Vol. 3B
PERFORMANCE MONITORING
• INT (APIC interrupt enable) flag (bit 20) - When set, the logical processor generates an exception
through its local APIC on counter overflow.
• EN (Enable Counters) Flag (bit 22) - When set, performance counting is enabled in the corresponding
performance-monitoring counter; when clear, the corresponding counter is disabled. The event logic unit for a
UMASK must be disabled by setting IA32_PERFEVTSELx[bit 22] = 0, before writing to IA32_PMCx.
• INV (invert) flag (bit 23) - When set, inverts the counter-mask (CMASK) comparison, so that both greater
than or equal to and less than comparisons can be made (0: greater than or equal; 1: less than). Note if
counter-mask is programmed to zero, INV flag is ignored.
• Counter mask (CMASK) field (bits 24 through 31) - When this field is not zero, a logical processor
compares this mask to the events count of the detected microarchitectural condition during a single cycle. If
the event count is greater than or equal to this mask, the counter is incremented by one. Otherwise the counter
is not incremented.
This mask is intended for software to characterize microarchitectural conditions that can count multiple
occurrences per cycle (for example, two or more instructions retired per clock; or bus queue occupations). If
the counter-mask field is 0, then the counter is incremented each cycle by the event count associated with
multiple occurrences.
NOTE
A non-zero write of a field that is introduced in a later architectural performance monitoring version
results in a general-protection (#GP) exception if that field is not supported by prior versions.
22.2.2 Architectural Performance Monitoring Version 2
The enhanced features provided by architectural performance monitoring version 2 include the following:
• Fixed-function performance counter register and associated control register - Three of the architec-
tural performance events are counted using three fixed-function MSRs (IA32_FIXED_CTR0 through IA32_-
FIXED_CTR2). Each of the fixed-function PMC can count only one architectural performance event.
Configuring the fixed-function PMCs is done by writing to bit fields in the MSR (IA32_FIXED_CTR_CTRL) located
at address 38DH. Unlike configuring performance events for general-purpose PMCs (IA32_PMCx) via UMASK
field in (IA32_PERFEVTSELx), configuring, programming IA32_FIXED_CTR_CTRL for fixed-function PMCs do
not require any UMASK.
• Simplified event programming - Most frequent operation in programming performance events are
enabling/disabling event counting and checking the status of counter overflows. Architectural performance
event version 2 provides three architectural MSRs:
- IA32_PERF_GLOBAL_CTRL allows software to enable/disable event counting of all or any combination of
fixed-function PMCs (IA32_FIXED_CTRx) or any general-purpose PMCs via a single WRMSR.
- IA32_PERF_GLOBAL_STATUS allows software to query counter overflow conditions on any combination of
fixed-function PMCs or general-purpose PMCs via a single RDMSR.
- IA32_PERF_GLOBAL_OVF_CTRL allows software to clear counter overflow conditions on any combination of
fixed-function PMCs or general-purpose PMCs via a single WRMSR.
• PMI Overhead Mitigation - Architectural performance monitoring version 2 introduces two bit field interface
in IA32_DEBUGCTL for PMI service routine to accumulate performance monitoring data and LBR records with
reduced perturbation from servicing the PMI. The two bit fields are:
- IA32_DEBUGCTL.Freeze_LBR_On_PMI(bit 11). In architectural performance monitoring version 2, only the
legacy semantic behavior is supported. See Section 20.4.7 for details of the legacy Freeze LBRs on PMI
control.
- IA32_DEBUGCTL.Freeze_PerfMon_On_PMI(bit 12). In architectural performance monitoring version 2,
only the legacy semantic behavior is supported. See Section 20.4.7 for details of the legacy Freeze LBRs on
PMI control.
The facilities provided by architectural performance monitoring version 2 can be queried from CPUID.0AH by
examining the content of register EDX:
Vol. 3B
22-5

PERFORMANCE MONITORING
•
Bits 0 through 4 of CPUID.0AH:EDX indicates the number of fixed-function performance counters available per
core,
•
Bits 5 through 12 of CPUID.0AH:EDX indicates the bit-width of fixed-function performance counters. Bits
beyond the width of the fixed-function counter are reserved and must be written as zeros.
NOTE
Early generation of processors based on Intel Core microarchitecture may report in
CPUID.0AH:EDX of support for version 2 but indicating incorrect information of version 2 facilities.
The IA32_FIXED_CTR_CTRL MSR include multiple sets of 4-bit field, each 4 bit field controls the operation of a
fixed-function performance counter. Figure 22-2 shows the layout of 4-bit controls for each fixed-function PMC.
Two sub-fields are currently defined within each control. The definitions of the bit fields are:
63
12 11
9
8 7
5
4
3
2
1
0
P
P
P
E
E
E
M
M
M
N
N
N
I
I
I
Cntr2 - Controls for IA32_FIXED_CTR2
Cntr1 - Controls for IA32_FIXED_CTR1
PMI - Enable PMI on overflow
Cntr0 - Controls for IA32_FIXED_CTR0
ENABLE - 0: disable; 1: OS; 2: User; 3: All ring levels
Reserved
Figure 22-2. Layout of IA32_FIXED_CTR_CTRL MSR
•
Enable field (lowest 2 bits within each 4-bit control) - When bit 0 is set, performance counting is
enabled in the corresponding fixed-function performance counter to increment while the target condition
associated with the architecture performance event occurred at ring 0. When bit 1 is set, performance counting
is enabled in the corresponding fixed-function performance counter to increment while the target condition
associated with the architecture performance event occurred at ring greater than 0. Writing 0 to both bits stops
the performance counter. Writing a value of 11B enables the counter to increment irrespective of privilege
levels.
•
PMI field (the fourth bit within each 4-bit control) - When set, the logical processor generates an
exception through its local APIC on overflow condition of the respective fixed-function counter.
IA32_PERF_GLOBAL_CTRL MSR provides single-bit controls to enable counting of each performance counter.
Figure 22-3 shows the layout of IA32_PERF_GLOBAL_CTRL. Each enable bit in IA32_PERF_GLOBAL_CTRL is ANDed
with the enable bits for all privilege levels in the respective IA32_PERFEVTSELx or IA32_PERF_FIXED_CTR_CTRL
MSRs to start/stop the counting of respective counters. Counting is enabled if the ANDed results is true; counting
is disabled when the result is false.
22-6
Vol. 3B

PERFORMANCE MONITORING
63
3534333231
2 10
IA32_FIXED_CTR2 enable
IA32_FIXED_CTR1 enable
IA32_FIXED_CTR0 enable
IA32_PMC1 enable
IA32_PMC0 enable
Reserved
Figure 22-3. Layout of IA32_PERF_GLOBAL_CTRL MSR
The behavior of the fixed function performance counters supported by architectural performance version 2 is
expected to be consistent on all processors that support those counters, and is defined as follows.
Table 22-1. Association of Fixed-Function Performance Counters with Architectural Performance Events
Fixed-Function
Address
Event Mask Mnemonic
Description
Performance Counter
IA32_FIXED_CTR0
309H
INST_RETIRED.ANY
This event counts the number of instructions that retire
execution. For instructions that consist of multiple uops,
this event counts the retirement of the last uop of the
instruction. The counter continues counting during
hardware interrupts, traps, and in-side interrupt handlers.
IA32_FIXED_CTR1
30AH
CPU_CLK_UNHALTED.THREAD
The CPU_CLK_UNHALTED.THREAD event counts the
number of core cycles while the logical processor is not in a
CPU_CLK_UNHALTED.CORE
halt state.
If there is only one logical processor in a processor core,
CPU_CLK_UNHALTED.CORE counts the unhalted cycles of
the processor core.
The core frequency may change from time to time due to
transitions associated with Enhanced Intel SpeedStep
Technology or TM2. For this reason this event may have a
changing ratio with regards to time.
IA32_FIXED_CTR2
30BH
CPU_CLK_UNHALTED.REF_TSC
This event counts the number of reference cycles at the
TSC rate when the core is not in a halt state and not in a TM
stop-clock state. The core enters the halt state when it is
running the HLT instruction or the MWAIT instruction. This
event is not affected by core frequency changes (e.g., P
states) but counts at the same frequency as the time stamp
counter. This event can approximate elapsed time while the
core was not in a halt state and not in a TM stopclock state.
IA32_FIXED_CTR3
30CH
TOPDOWN.SLOTS
This event counts the number of available slots for an
unhalted logical processor. The event increments by
machine-width of the narrowest pipeline as employed by
the Top-down Microarchitecture Analysis method. The
count is distributed among unhalted logical processors
(hyper-threads) who share the same physical core.
Software can use this event as the denominator for the
top-level metrics of the Top-down Microarchitecture
Analysis method.
Vol. 3B
22-7
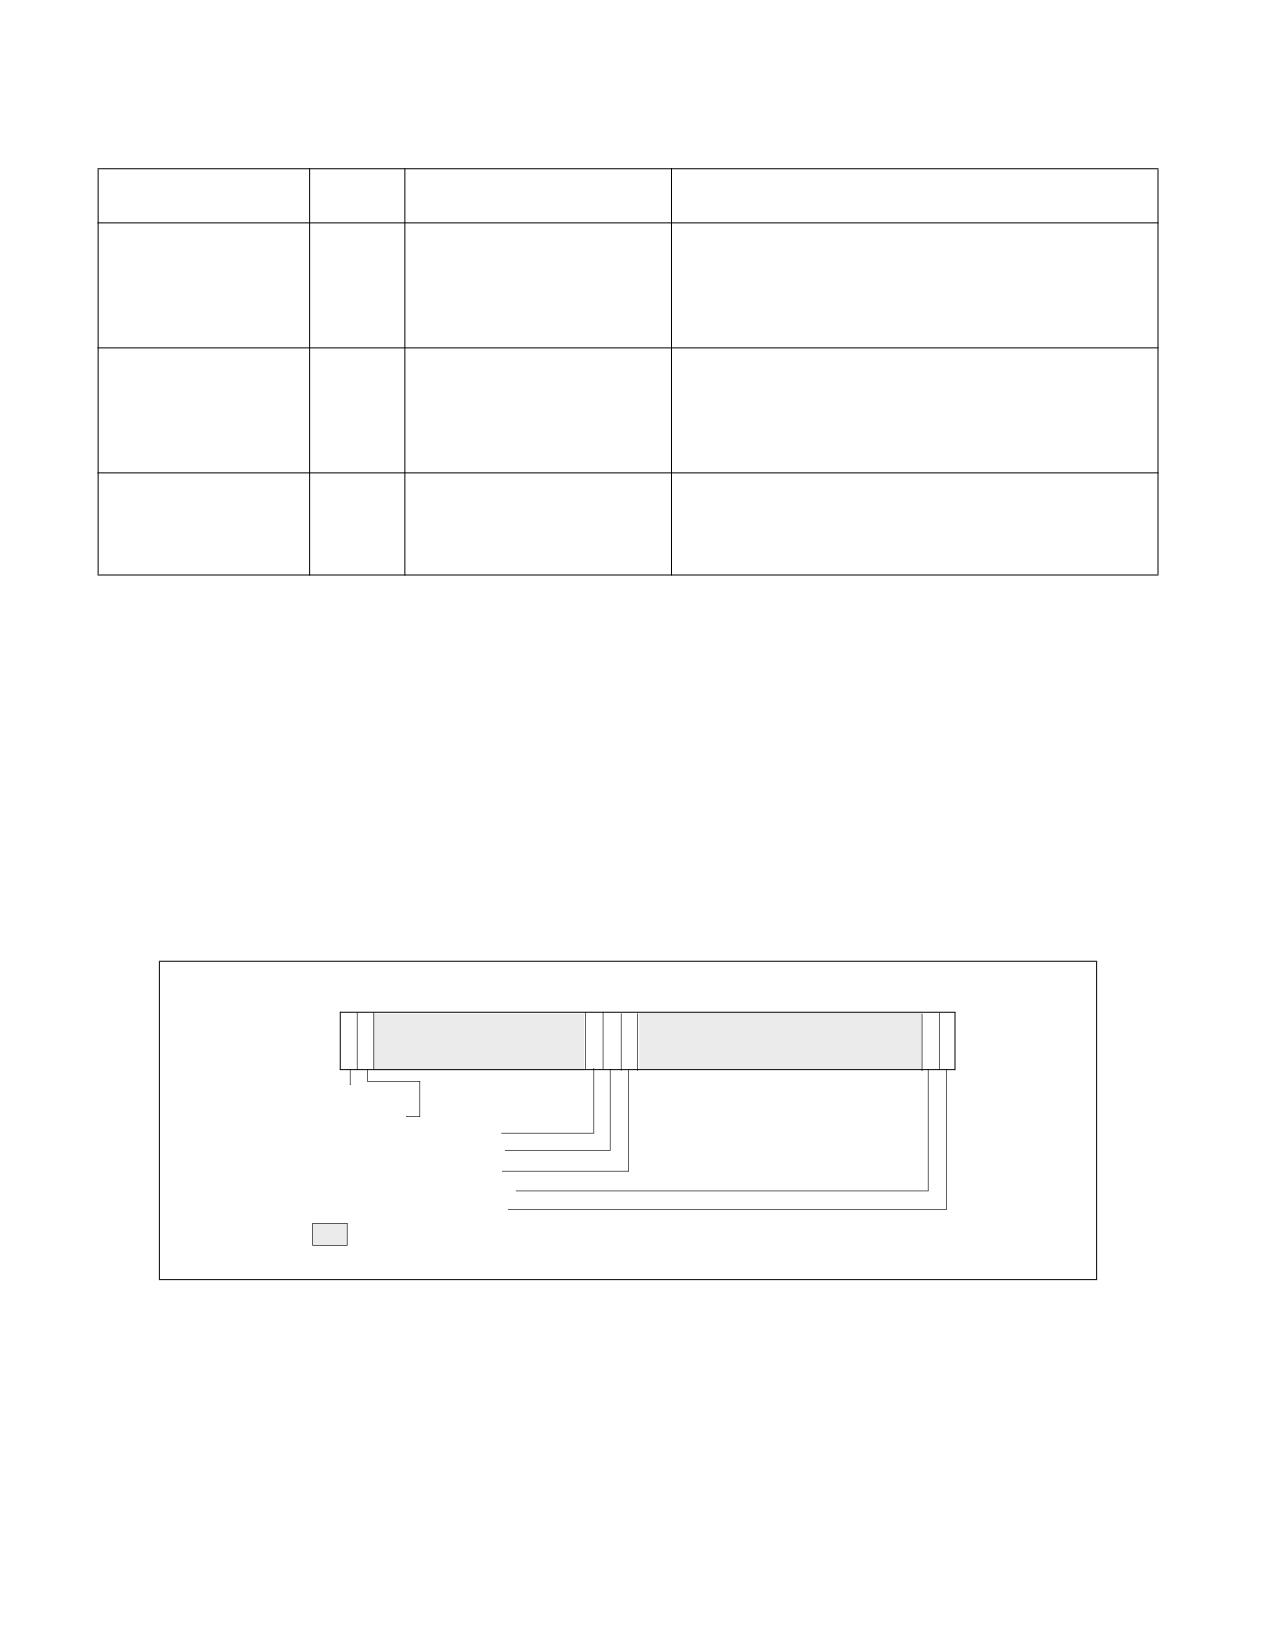
PERFORMANCE MONITORING
Table 22-1. Association of Fixed-Function Performance Counters with Architectural Performance Events
Fixed-Function
Address
Event Mask Mnemonic
Description
Performance Counter
IA32_FIXED_CTR41
30DH
TOPDOWN_BAD_SPECULATION
This event counts Topdown slots that were not consumed
by the backend due to a pipeline flush, such as a
mispredicted branch or a machine clear. It provides a value
equivalent to a general-purpose counter configured with
UMask=00H and EventSelect=73H.
IA32_FIXED_CTR51
30EH
TOPDOWN_FE_BOUND
This event counts Topdown slots where uops were not
provided to the backend due to frontend limitations, such as
instruction cache/TLB miss delays or decoder limitations. It
provides a value equivalent to a general purpose counter
configured with UMask=01H and EventSelect=9CH.
IA32_FIXED_CTR61
30FH
TOPDOWN_RETIRING
This event counts Topdown slots that were committed
(retired) by the backend. It provides a value equivalent to a
general purpose counter configured with UMask=02H and
EventSelect=C2H.
NOTES:
1. If this counter is supported, it will be accessible in the following MSRs: IA32_PERF_GLOBAL_STATUS (38EH),
IA32_PERF_GLOBAL_CTRL (38FH), IA32_PERF_GLOBAL_STATUS_RESET (390H), and
IA32_PERF_GLOBAL_STATUS_SET (391H).
IA32_PERF_GLOBAL_STATUS MSR provides single-bit status for software to query the overflow condition of each
performance counter. IA32_PERF_GLOBAL_STATUS[bit 62] indicates overflow conditions of the DS area data
buffer. IA32_PERF_GLOBAL_STATUS[bit 63] provides a CondChgd bit to indicate changes to the state of perfor-
mance monitoring hardware. Figure 22-4 shows the layout of IA32_PERF_GLOBAL_STATUS. A value of 1 in bits 0,
1, 32 through 34 indicates a counter overflow condition has occurred in the associated counter.
When a performance counter is configured for PEBS, overflow condition in the counter generates a performance-
monitoring interrupt signaling a PEBS event. On a PEBS event, the processor stores data records into the buffer
area, clears the counter overflow status., and sets the “OvfBuffer” bit in IA32_PERF_GLOBAL_STATUS.
6362
3534333231
2 10
CondChgd
OvfDSBuffer
IA32_FIXED_CTR2 Overflow
IA32_FIXED_CTR1 Overflow
IA32_FIXED_CTR0 Overflow
IA32_PMC1 Overflow
IA32_PMC0 Overflow
Reserved
Figure 22-4. Layout of IA32_PERF_GLOBAL_STATUS MSR
IA32_PERF_GLOBAL_OVF_CTL MSR allows software to clear overflow indicator(s) of any general-purpose or fixed-
function counters via a single WRMSR. Software should clear overflow indications when
• Setting up new values in the event select and/or UMASK field for counting or interrupt-based event sampling.
• Reloading counter values to continue collecting next sample.
• Disabling event counting or interrupt-based event sampling.
22-8
Vol. 3B
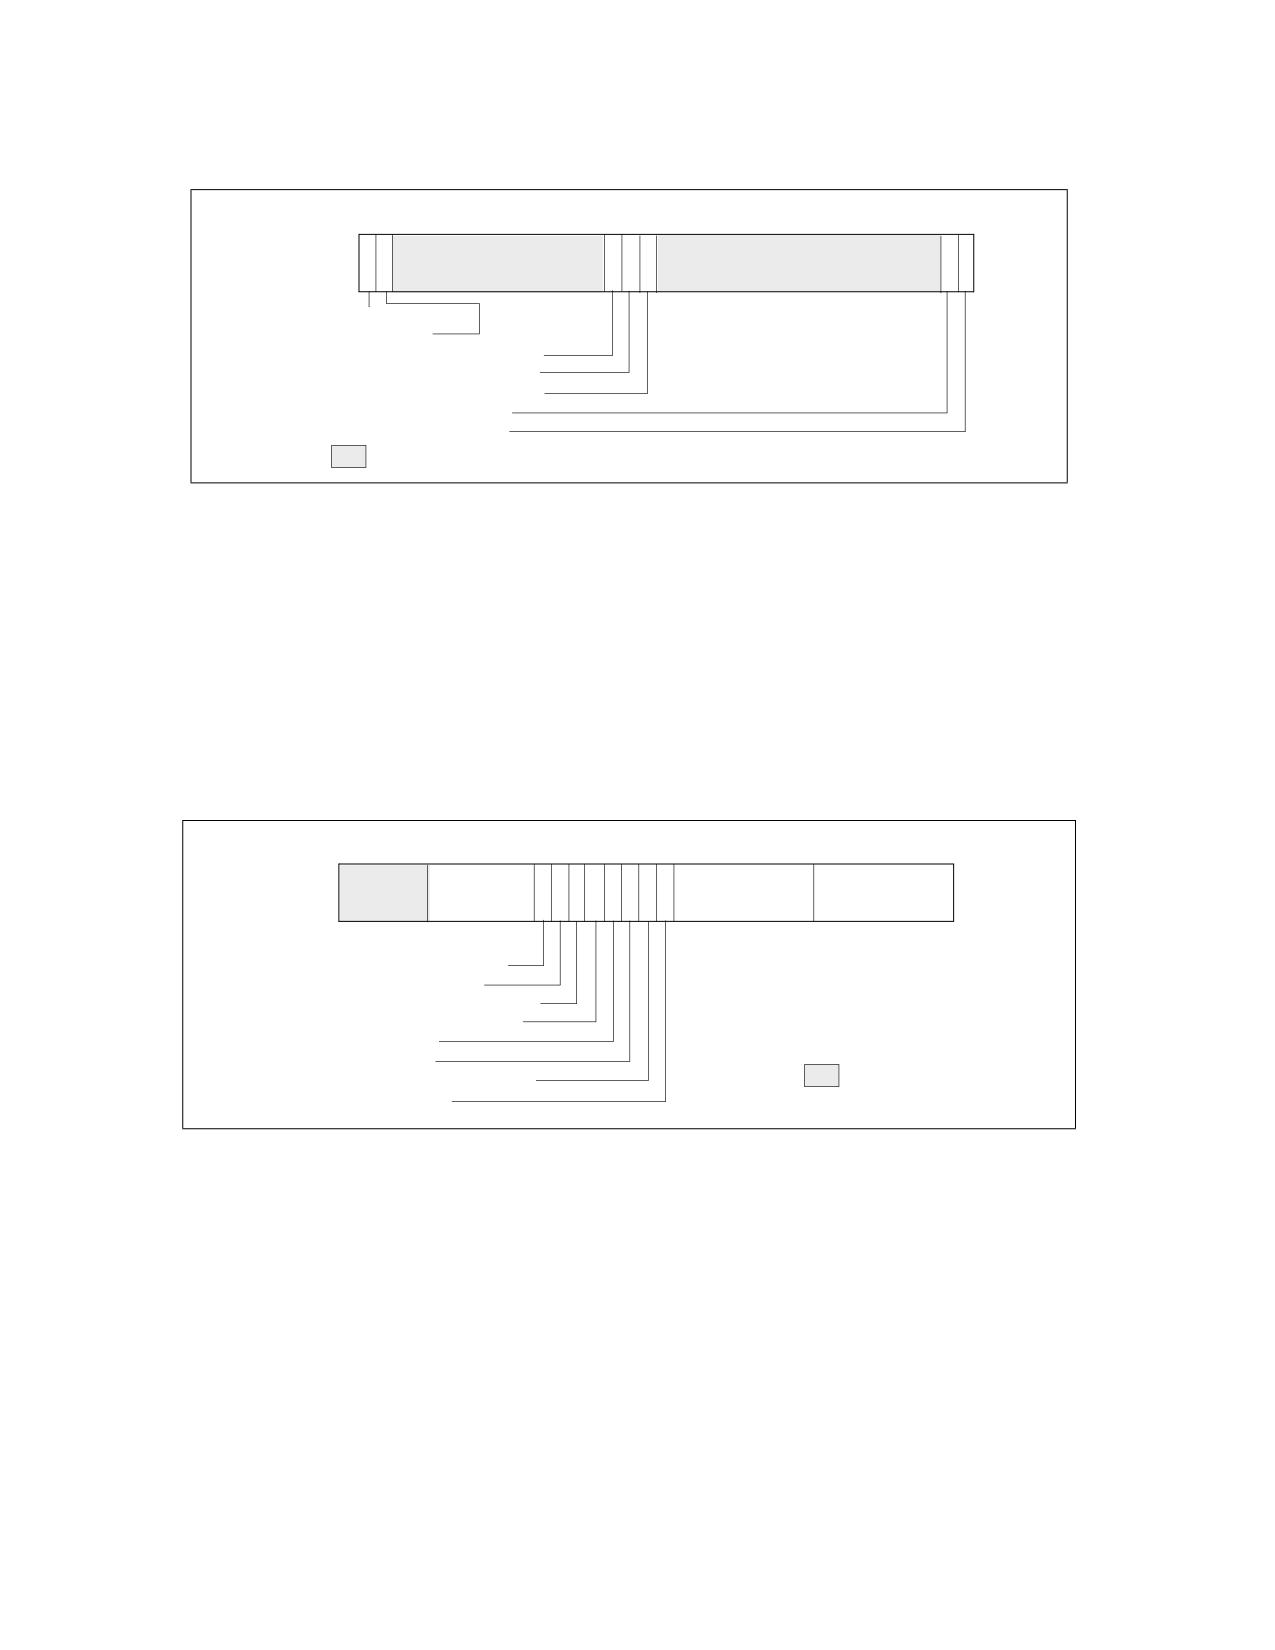
PERFORMANCE MONITORING
The layout of IA32_PERF_GLOBAL_OVF_CTL is shown in Figure 22-5.
6362
3534333231
2 10
ClrCondChgd
ClrOvfDSBuffer
IA32_FIXED_CTR2 ClrOverflow
IA32_FIXED_CTR1 ClrOverflow
IA32_FIXED_CTR0 ClrOverflow
IA32_PMC1 ClrOverflow
IA32_PMC0 ClrOverflow
Reserved
Figure 22-5. Layout of IA32_PERF_GLOBAL_OVF_CTRL MSR
22.2.3 Architectural Performance Monitoring Version 3
Processors supporting architectural performance monitoring version 3 also supports version 1 and 2, as well as
capability enumerated by CPUID.0AH. Specifically, version 3 provides the following enhancement in performance
monitoring facilities if a processor core comprising of more than one logical processor, i.e., a processor core
supporting Intel Hyper-Threading Technology or simultaneous multi-threading capability:
• AnyThread counting for processor core supporting two or more logical processors. The interface that supports
AnyThread counting include:
- Each IA32_PERFEVTSELx MSR (starting at MSR address 186H) support the bit field layout defined in Figure
22-6.
63
31
242322212019181716 15
8 7
0
Counter Mask
I
A
I
U
N
E
N
N
P
E
O
S
Unit Mask (UMASK)
Event Select
(CMASK)
N
C
S
V
Y
T
R
INV-Invert counter mask
EN-Enable counters
ANY-Any Thread
INT-APIC interrupt enable
PC-Pin control
E-Edge detect
OS-Operating system mode
Reserved
USR-User Mode
Figure 22-6. Layout of IA32_PERFEVTSELx MSRs Supporting Architectural Performance Monitoring Version 3
Bit 21 (AnyThread) of IA32_PERFEVTSELx is supported in architectural performance monitoring version 3 for
processor core comprising of two or more logical processors. When set to 1, it enables counting the associated
event conditions (including matching the thread’s CPL with the OS/USR setting of IA32_PERFEVTSELx)
occurring across all logical processors sharing a processor core. When bit 21 is 0, the counter only increments
the associated event conditions (including matching the thread’s CPL with the OS/USR setting of IA32_PERFE-
VTSELx) occurring in the logical processor which programmed the IA32_PERFEVTSELx MSR.
- Each fixed-function performance counter IA32_FIXED_CTRx (starting at MSR address 309H) is configured
by a 4-bit control block in the IA32_PERF_FIXED_CTR_CTRL MSR. The control block also allows thread-
specificity configuration using an AnyThread bit for fixed-function counters 0, 1, and 2. The layout of
IA32_PERF_FIXED_CTR_CTRL MSR is shown.
Vol. 3B
22-9
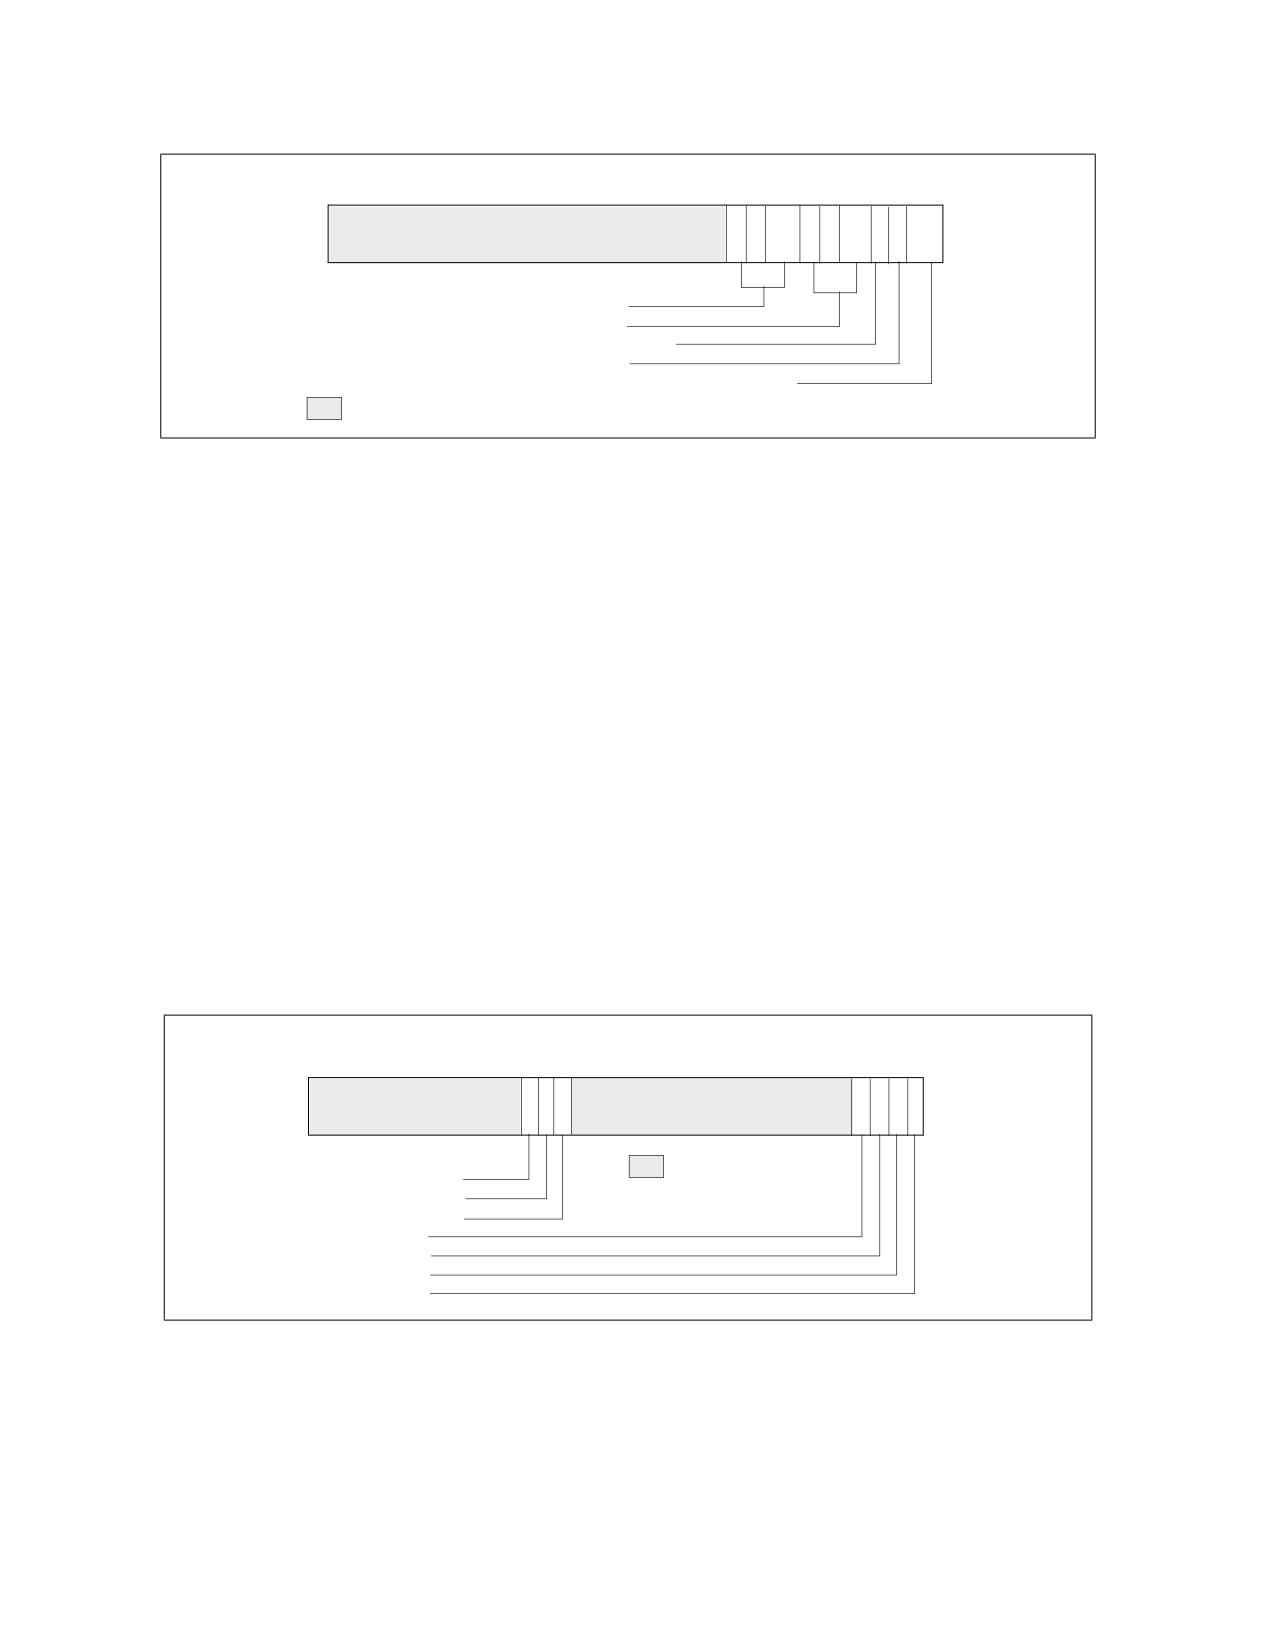
PERFORMANCE MONITORING
63
12 11
9
8 7
5
4
3
2
1
0
P
A
P
A
P
A
E
E
E
M
N
M
N
M
N
N
N
N
I
Y
I
Y
I
Y
Cntr2 - Controls for IA32_FIXED_CTR2
Cntr1 - Controls for IA32_FIXED_CTR1
PMI - Enable PMI on overflow on IA32_FIXED_CTR0
AnyThread - AnyThread for IA32_FIXED_CTR0
ENABLE - IA32_FIXED_CTR0. 0: disable; 1: OS; 2: User; 3: All ring levels
Reserved
Figure 22-7. IA32_FIXED_CTR_CTRL MSR Supporting Architectural Performance Monitoring Version 3
Each control block for a fixed-function performance counter provides an AnyThread (bit position 2 + 4*N, N=
0, 1, etc.) bit. When set to 1, it enables counting the associated event conditions (including matching the
thread’s CPL with the ENABLE setting of the corresponding control block of IA32_PERF_FIXED_CTR_CTRL)
occurring across all logical processors sharing a processor core. When an AnyThread bit is 0 in
IA32_PERF_FIXED_CTR_CTRL, the corresponding fixed-function counter only increments the associated event
conditions occurring in the logical processor which programmed the IA32_PERF_FIXED_CTR_CTRL MSR.
• The IA32_PERF_GLOBAL_CTRL, IA32_PERF_GLOBAL_STATUS, IA32_PERF_GLOBAL_OVF_CTRL MSRs provide
single-bit controls/status for each general-purpose and fixed-function performance counter. Figure 22-8 and
Figure 22-9 show the layout of these MSRs for N general-purpose performance counters (where N is reported
by CPUID.0AH:EAX[15:8]) and three fixed-function counters.
NOTE
The number of general-purpose performance monitoring counters (i.e., N in Figure 22-9) can vary
across processor generations within a processor family, across processor families, or could be
different depending on the configuration chosen at boot time in the BIOS regarding Intel Hyper
Threading Technology, (e.g., N=2 for 45 nm Intel Atom processors; N =4 for processors based on
the Nehalem microarchitecture; for processors based on the Sandy Bridge microarchitecture, N =
4 if Intel Hyper Threading Technology is active and N=8 if not active). In addition, the number of
counters may vary from the number of physical counters present on the hardware, because an
agent running at a higher privilege level (e.g., a VMM) may not expose all counters.
Global Enable Controls IA32_PERF_GLOBAL_CTRL
63
3534333231
N ..
10
Reserved
IA32_FIXED_CTR2 enable
IA32_FIXED_CTR1 enable
IA32_FIXED_CTR0 enable
IA32_PMC(N-1) enable
.................... enable
IA32_PMC1 enable
IA32_PMC0 enable
Figure 22-8. Layout of Global Performance Monitoring Control MSR
22-10
Vol. 3B

PERFORMANCE MONITORING
Global Overflow Status IA32_PERF_GLOBAL_STATUS
636261
3534333231
N ..
10
CondChgd
OvfDSBuffer
OvfUncore
IA32_PMC(N-1) Overflow
IA32_FIXED_CTR2 Overflow
...................... Overflow
IA32_FIXED_CTR1 Overflow
IA32_FIXED_CTR0 Overflow
IA32_PMC1 Overflow
IA32_PMC0 Overflow
Global Overflow Status IA32_PERF_GLOBAL_OVF_CTRL
6362
3534333231
N ..
10
ClrCondChgd
ClrOvfDSBuffer
ClrOvfUncore
IA32_FIXED_CTR2 ClrOverflow
IA32_PMC(N-1) ClrOverflow
IA32_FIXED_CTR1 ClrOverflow
........................ ClrOverflow
IA32_FIXED_CTR0 ClrOverflow
IA32_PMC1 ClrOverflow
IA32_PMC0 ClrOverflow
Figure 22-9. Global Performance Monitoring Overflow Status and Control MSRs
22.2.3.1 AnyThread Counting and Software Evolution
The motivation for characterizing software workload over multiple software threads running on multiple logical
processors of the same processor core originates from a time earlier than the introduction of the AnyThread inter-
face in IA32_PERFEVTSELx and IA32_FIXED_CTR_CTRL. While AnyThread counting provides some benefits in
simple software environments of an earlier era, the evolution contemporary software environments introduce
certain concepts and pre-requisites that AnyThread counting does not comply with.
One example is the proliferation of software environments that support multiple virtual machines (VM) under VMX
(see Chapter 26, “Introduction to Virtual Machine Extensions”) where each VM represents a domain separated
from one another.
A Virtual Machine Monitor (VMM) that manages the VMs may allow an individual VM to employ performance moni-
toring facilities to profiles the performance characteristics of a workload. The use of the Anythread interface in
IA32_PERFEVTSELx and IA32_FIXED_CTR_CTRL is discouraged with software environments supporting virtualiza-
tion or requiring domain separation.
Specifically, Intel recommends VMM:
• Configure the MSR bitmap to cause VM-exits for WRMSR to IA32_PERFEVTSELx and IA32_FIXED_CTR_CTRL in
VMX non-Root operation (see Chapter 27 for additional information),
• Clear the AnyThread bit of IA32_PERFEVTSELx and IA32_FIXED_CTR_CTRL in the MSR-load lists for VM exits
and VM entries (see Chapter 27, Chapter 29, and Chapter 30).
Even when operating in simpler legacy software environments which might not emphasize the pre-requisites of a
virtualized software environment, the use of the AnyThread interface should be moderated and follow any event-
specific guidance where explicitly noted.
Vol. 3B
22-11
PERFORMANCE MONITORING
22.2.4 Architectural Performance Monitoring Version 4
Processors supporting architectural performance monitoring version 4 also supports version 1, 2, and 3, as well as
capability enumerated by CPUID.0AH. Version 4 introduced a streamlined PMI overhead mitigation interface that
replaces the legacy semantic behavior but retains the same control interface in IA32_DEBUGCTL.Freeze_L-
BRs_On_PMI and Freeze_PerfMon_On_PMI. Specifically version 4 provides the following enhancements:
• New indicators (LBR_FRZ, CTR_FRZ) in IA32_PERF_GLOBAL_STATUS, see Section 22.2.4.1.
• Streamlined Freeze/PMI Overhead management interfaces to use IA32_DEBUGCTL.Freeze_LBRs_On_PMI and
IA32_DEBUGCTL.Freeze_PerfMon_On_PMI: see Section 22.2.4.1. Legacy semantics of Freeze_LBRs_On_PMI
and Freeze_PerfMon_On_PMI (applicable to version 2 and 3) are not supported with version 4 or higher.
• Fine-grain separation of control interface to manage overflow/status of IA32_PERF_GLOBAL_STATUS and read-
only performance counter enabling interface in IA32_PERF_GLOBAL_STATUS: see Section 22.2.4.2.
• Performance monitoring resource in-use MSR to facilitate cooperative sharing protocol between perfmon-
managing privilege agents.
22.2.4.1 Enhancement in IA32_PERF_GLOBAL_STATUS
The IA32_PERF_GLOBAL_STATUS MSR provides the following indicators with architectural performance monitoring
version 4:
• IA32_PERF_GLOBAL_STATUS.LBR_FRZ[bit 58]: This bit is set due to the following conditions:
- IA32_DEBUGCTL.FREEZE_LBR_ON_PMI has been set by the profiling agent, and
- A performance counter, configured to generate PMI, has overflowed to signal a PMI. Consequently the LBR
stack is frozen.
Effectively, the IA32_PERF_GLOBAL_STATUS.LBR_FRZ bit also serves as a control to enable capturing data in
the LBR stack. To enable capturing LBR records, the following expression must hold with architectural PerfMon
version 4 or higher:
- (IA32_DEBUGCTL.LBR & (!IA32_PERF_GLOBAL_STATUS.LBR_FRZ) ) =1
• IA32_PERF_GLOBAL_STATUS.CTR_FRZ[bit 59]: This bit is set due to the following conditions:
- IA32_DEBUGCTL.FREEZE_PERFMON_ON_PMI has been set by the profiling agent, and
- A performance counter, configured to generate PMI, has overflowed to signal a PMI. Consequently, all the
performance counters are frozen.
Effectively, the IA32_PERF_GLOBAL_STATUS.CTR_FRZ bit also serve as an read-only control to enable
programmable performance counters and fixed counters in the core PMU. To enable counting with the
performance counters, the following expression must hold with architectural PerfMon version 4 or higher:
• (IA32_PERFEVTSELn.EN & IA32_PERF_GLOBAL_CTRL.PMCn & (!IA32_PERF_-
GLOBAL_STATUS.CTR_FRZ) ) = 1 for programmable counter ‘n’, or
• (IA32_PERF_FIXED_CRTL.ENi & IA32_PERF_GLOBAL_CTRL.FCi & (!IA32_PERF_-
GLOBAL_STATUS.CTR_FRZ) ) = 1 for fixed counter ‘i’
The read-only enable interface IA32_PERF_GLOBAL_STATUS.CTR_FRZ provides a more efficient flow for a PMI
handler to use IA32_DEBUGCTL.Freeze_PerfMon_On_PMI to filter out data that may distort target workload anal-
ysis, see Table 20-3. It should be noted the IA32_PERF_GLOBAL_CTRL register continue to serve as the primary
interface to control all performance counters of the logical processor.
For example, when the Freeze-On-PMI mode is not being used, a PMI handler would be setting IA32_PERF_-
GLOBAL_CTRL as the very last step to commence the overall operation after configuring the individual counter
registers, controls, and PEBS facility. This does not only assure atomic monitoring but also avoids unnecessary
complications (e.g., race conditions) when software attempts to change the core PMU configuration while some
counters are kept enabled.
Additionally, IA32_PERF_GLOBAL_STATUS.TraceToPAPMI[bit 55]: On processors that support Intel Processor Trace
and configured to store trace output packets to physical memory using the ToPA scheme, bit 55 is set when a PMI
occurred due to a ToPA entry memory buffer was completely filled.
22-12
Vol. 3B
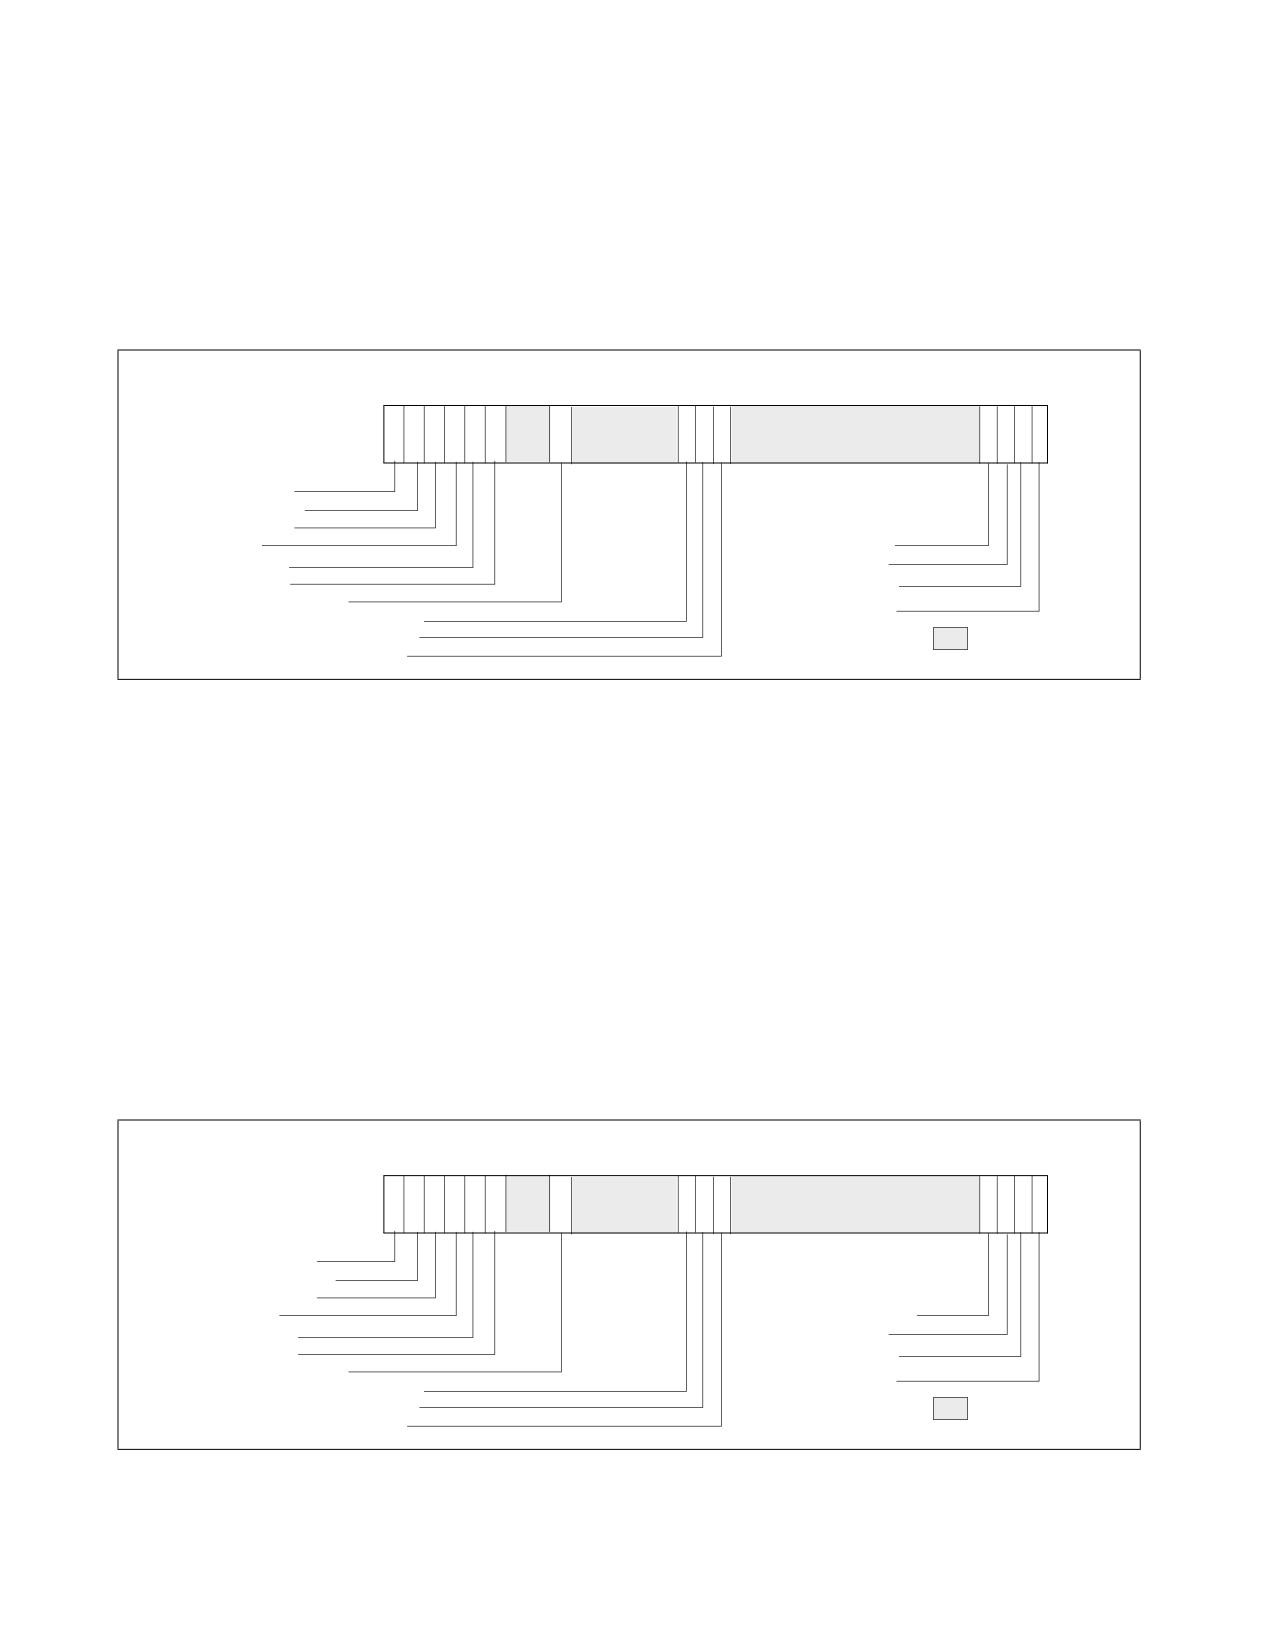
PERFORMANCE MONITORING
IA32_PERF_GLOBAL_STATUS also provides an indicator to distinguish interaction of performance monitoring oper-
ations with other side-band activities, which apply Intel SGX on processors that support it (for additional informa-
tion about Intel SGX, see the Intel® 64 and IA-32 Architectures Software Developer’s Manual, Volume 3D):
• IA32_PERF_GLOBAL_STATUS.ASCI[bit 60]: This bit is set when data accumulated in any of the configured
performance counters (i.e., IA32_PMCx or IA32_FIXED_CTRx) may include contributions from direct or indirect
operation of Intel SGX to protect an enclave (since the last time IA32_PERF_GLOBAL_STATUS.ASCI was
cleared).
6362
61
60 59 58
55
3534333231
N ..
10
CondChgd
OvfDSBuffer
OvfUncore
ASCI
IA32_PMC(N-1) Overflow
CTR_Frz
...................... Overflow
LBR_Frz
IA32_PMC1 Overflow
TraceToPAPMI
IA32_PMC0 Overflow
IA32_FIXED_CTR2 Overflow
IA32_FIXED_CTR1 Overflow
Reserved
IA32_FIXED_CTR0 Overflow
Figure 22-10. IA32_PERF_GLOBAL_STATUS MSR and Architectural PerfMon Version 4
Note, a processor’s support for IA32_PERF_GLOBAL_STATUS.TraceToPAPMI[bit 55] is enumerated as a result of
CPUID enumerated capability of Intel Processor Trace and the use of the ToPA buffer scheme. Support of
IA32_PERF_GLOBAL_STATUS.ASCI[bit 60] is enumerated by the CPUID enumeration of Intel SGX.
22.2.4.2 IA32_PERF_GLOBAL_STATUS_RESET and IA32_PERF_GLOBAL_STATUS_SET MSRS
With architectural performance monitoring version 3 and lower, clearing of the set bits in IA32_PERF_-
GLOBAL_STATUS MSR by software is done via IA32_PERF_GLOBAL_OVF_CTRL MSR. Starting with architectural
performance monitoring version 4, software can manage the overflow and other indicators in IA32_PERF_-
GLOBAL_STATUS using separate interfaces to set or clear individual bits.
The address and the architecturally-defined bits of IA32_PERF_GLOBAL_OVF_CTRL is inherited by IA32_PERF_-
GLOBAL_STATUS_RESET (see Figure 22-11). Further, IA32_PERF_GLOBAL_STATUS_RESET provides additional bit
fields to clear the new indicators in IA32_PERF_GLOBAL_STATUS described in Section 22.2.4.1.
6362
61 60 59 58
55
3534333231
N ..
10
Clr CondChgd
Clr OvfDSBuffer
Clr OvfUncore
Clr ASCI
Clr IA32_PMC(N-1) Ovf
Clr CTR_Frz
Clr
Ovf
Clr LBR_Frz
Clr IA32_PMC1 Ovf
Clr TraceToPAPMI
Clr IA32_PMC0 Ovf
Clr IA32_FIXED_CTR2 Ovf
Clr IA32_FIXED_CTR1 Ovf
Reserved
Clr IA32_FIXED_CTR0 Ovf
Figure 22-11. IA32_PERF_GLOBAL_STATUS_RESET MSR and Architectural PerfMon Version 4
Vol. 3B
22-13
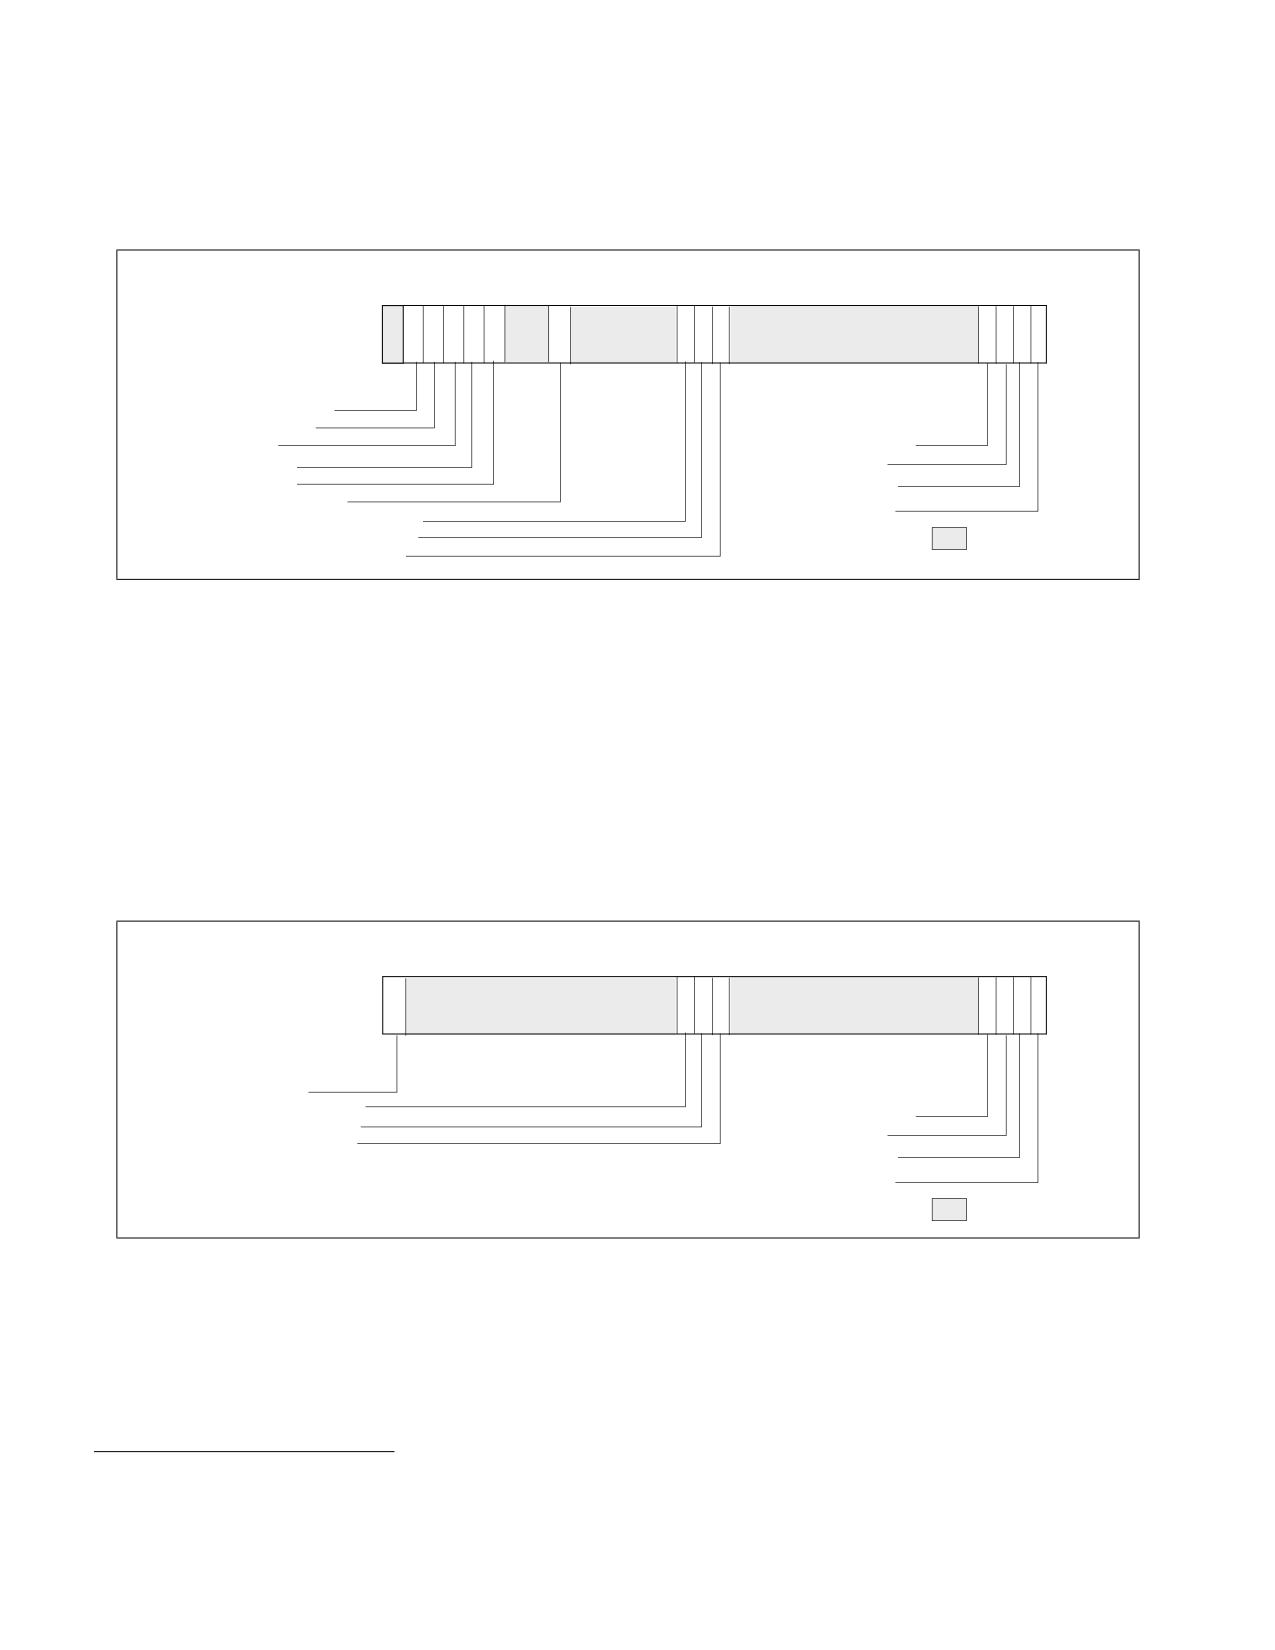
PERFORMANCE MONITORING
The IA32_PERF_GLOBAL_STATUS_SET MSR is introduced with architectural performance monitoring version 4. It
allows software to set individual bits in IA32_PERF_GLOBAL_STATUS. The IA32_PERF_GLOBAL_STATUS_SET
interface can be used by a VMM to virtualize the state of IA32_PERF_GLOBAL_STATUS across VMs.
63 62 61 60 59 58
55
3534333231
N ..
10
Set OvfDSBuffer
Set OvfUncore
Set ASCI
Set IA32_PMC(N-1) Ovf
Set CTR_Frz
Set
Ovf
Set LBR_Frz
Set IA32_PMC1 Ovf
Set TraceToPAPMI
Set IA32_PMC0 Ovf
Set IA32_FIXED_CTR2 Ovf
Set IA32_FIXED_CTR1 Ovf
Reserved
Set IA32_FIXED_CTR0 Ovf
Figure 22-12. IA32_PERF_GLOBAL_STATUS_SET MSR and Architectural PerfMon Version 4
22.2.4.3 IA32_PERF_GLOBAL_INUSE MSR
In a contemporary software environment, multiple privileged service agents may wish to employ the processor’s
performance monitoring facilities. The IA32_MISC_ENABLE.PERFMON_AVAILABLE[bit 7] interface could not serve
the need of multiple agent adequately. A white paper, “Performance Monitoring Unit Sharing Guideline”1, proposed
a cooperative sharing protocol that is voluntary for participating software agents.
Architectural performance monitoring version 4 introduces a new MSR, IA32_PERF_GLOBAL_INUSE, that simplifies
the task of multiple cooperating agents to implement the sharing protocol.
The layout of IA32_PERF_GLOBAL_INUSE is shown in Figure 22-13.
63
3534333231
N ..
10
PMI InUse
FIXED_CTR2 InUse
PERFEVTSEL(N-1) InUse
FIXED_CTR1 InUse
....................... InUse
FIXED_CTR0 InUse
PERFEVTSEL1 InUse
PERFEVTSEL0 InUse
N = CPUID.0AH:EAX[15:8]
Reserved
Figure 22-13. IA32_PERF_GLOBAL_INUSE MSR and Architectural PerfMon Version 4
The IA32_PERF_GLOBAL_INUSE MSR provides an “InUse” bit for each programmable performance counter and
fixed counter in the processor. Additionally, it includes an indicator if the PMI mechanism has been configured by a
profiling agent.
• IA32_PERF_GLOBAL_INUSE.PERFEVTSEL0_InUse[bit 0]: This bit reflects the logical state of
(IA32_PERFEVTSEL0[7:0] != 0).
1. Available at http://www.intel.com/sdm
22-14
Vol. 3B
PERFORMANCE MONITORING
• IA32_PERF_GLOBAL_INUSE.PERFEVTSEL1_InUse[bit 1]: This bit reflects the logical state of
(IA32_PERFEVTSEL1[7:0] != 0).
• IA32_PERF_GLOBAL_INUSE.PERFEVTSEL2_InUse[bit 2]: This bit reflects the logical state of
(IA32_PERFEVTSEL2[7:0] != 0).
• IA32_PERF_GLOBAL_INUSE.PERFEVTSELn_InUse[bit n]: This bit reflects the logical state of
(IA32_PERFEVTSELn[7:0] != 0), n < CPUID.0AH:EAX[15:8].
• IA32_PERF_GLOBAL_INUSE.FC0_InUse[bit 32]: This bit reflects the logical state of
(IA32_FIXED_CTR_CTRL[1:0] != 0).
• IA32_PERF_GLOBAL_INUSE.FC1_InUse[bit 33]: This bit reflects the logical state of
(IA32_FIXED_CTR_CTRL[5:4] != 0).
• IA32_PERF_GLOBAL_INUSE.FC2_InUse[bit 34]: This bit reflects the logical state of
(IA32_FIXED_CTR_CTRL[9:8] != 0).
• IA32_PERF_GLOBAL_INUSE.PMI_InUse[bit 63]: This bit is set if any one of the following bit is set:
- IA32_PERFEVTSELn.INT[bit 20], n < CPUID.0AH:EAX[15:8].
- IA32_FIXED_CTR_CTRL.ENi_PMI, i = 0, 1, 2.
- Any IA32_PEBS_ENABLES bit which enables PEBS for a general-purpose or fixed-function performance
counter.
22.2.5 Architectural Performance Monitoring Version 5
Processors supporting architectural performance monitoring version 5 also support versions 1, 2, 3, and 4, as well
as capability enumerated by CPUID.0AH. Specifically, version 5 provides the following enhancements:
• Deprecation of AnyThread mode, see Section 22.2.5.1.
• Individual enumeration of Fixed counters in CPUID.0AH, see Section 22.2.5.2.
• Domain separation, see Section 22.2.5.3.
22.2.5.1 AnyThread Mode Deprecation
With Architectural Performance Monitoring Version 5, a processor that supports AnyThread mode deprecation is
enumerated by CPUID.0AH:EDX[15]. If set, software will not have to follow guidelines in Section 22.2.3.1.
22.2.5.2 Fixed Counter Enumeration
With Architectural Performance Monitoring Version 5, register CPUID.0AH:ECX indicates Fixed Counter enumera-
tion. It is a bit mask which enumerates the supported Fixed Counters in a processor. If bit 'i' is set, it implies that
Fixed Counter 'i' is supported. Software is recommended to use the following logic to check if a Fixed Counter is
supported on a given processor:
FxCtr[i]_is_supported := ECX[i] || (EDX[4:0] > i);
22.2.5.3 Domain Separation
When the INV flag in IA32_PERFEVTSELx is used, a counter stops counting when the logical processor exits the C0
ACPI C-state.
22.2.6 Architectural Performance Monitoring Version 6
Processors supporting architectural performance monitoring version 6 also support versions 1, 2, 3, 4, and 5, as
well as the capabilities enumerated by CPUID leaves 0AH and 23H. Specifically, version 6 provides the following
enhancements:
• PerfMon MSRs Aliasing, see Section 22.2.6.1.
Vol. 3B
22-15

PERFORMANCE MONITORING
• UnitMask2, see Section 22.2.6.2.
• Equal flag, see Section 22.2.6.3.
22.2.6.1 Performance Monitoring MSR Aliasing
Architectural performance monitoring version 6 includes a new range for the counters' MSRs in the 19xxH address
range1. The new MSR range allows for scaling the number of general-purpose and fixed-function counters beyond
the quantities in current products. Additionally, it banks registers of the same counter closer to each other.
All legacy and new counters, i.e., those enumerated in CPUID.23H.01H, will be supported in this new address
range. Moving forward, newer counters may be supported in the new address range, but not in the legacy one.
Table 22-2. New Performance Monitoring MSR Naming Details
Register
General Counter n
Fixed Counter m
Counter
IA32_PMC_GPn_CTR
IA32_PMC_FXm_CTR
Event-Select
IA32_PMC_GPn_CFG_A
N/A
Reload Config
IA32_PMC_GPn_CFG_B
IA32_PMC_FXm_CFG_B
Event-Select Extended
IA32_PMC_GPn_CFG_C
IA32_PMC_FXm_CFG_C
An IA32_PMC_GPn_CTR MSR can be used to access the counter value for a GP (general-purpose) counter ‘n.’ On
processors that support CPUID.23H, a general-purpose (GP) counter ‘n’ that is enumerated in both CPUID.23H and
CPUID.0AH can be accessed through either IA32_PMC_GPn_CTR or the legacy MSR addresses (IA32_PMCn,
IA32_A_PMCn). In contrast, a counter ‘n’ that is only enumerated in CPUID.23H can only be accessed through
IA32_PMC_GPn_CTR. This guideline also applies to the other MSR aliases described in this section (i.e.,
IA32_PMC_GPn_CFG_A and IA32_PERFEVTSELn, IA32_PMC_FXm_CTR and IA32_FIXED_CTRm). The
IA32_PMC_GPn_CTR MSR address2 for counter ‘n’ is 1900H + 4 * n, and this MSR has full-width write support.
The IA32_PMC_GPn_CFG_A MSR can be used to access the performance event select register for a GP counter ‘n’
and is at address3 1901H + 4 * n. The reload configuration MSRs for GP counter ‘n,’ IA32_PMC_GPn_CFG_B, is at
MSR address 1902H + 4 * n. There is no legacy MSR alias to this reload configuration register. Thus, the register
only exists when enumerated in CPUID.23H. Similarly, no legacy MSR alias exists for the event-select extended
registers, IA32_PMC_GPn_CFG_C, which are at MSR address 1903H + 4 * n for GP counter ‘n.’
An IA32_PMC_FXm_CTR MSR can be used to access the counter value for a fixed-function counter ‘m’ if that
counter is enumerated in CPUID.23H. The IA32_PMC_FXm_CTR MSR address for fixed-function counter ‘m’ is
1980H + 4 * m. There is no alias for the fixed-function counters' reload configuration or event select extended
registers (IA32_PMC_FXm_CFG_B at MSR addresses 1982H + 4 * m and IA32_PMC_FXm_CFG_C at MSR address
1983H + 4 * m, respectively).
The available general-purpose and fixed-function counters are reported by CPUID.23H.01H:EAX and
CPUID.23H.01H:EBX, respectively.4 Note that not all counters enumerated in CPUID.23H may have corresponding
IA32_PMC_GPn_CFG_B, IA32_PMC_GPn_CFG_C, IA32_PMC_FXm_CFG_B, or IA32_PMC_FXm_CFG_C MSRs. The
enumeration and usage of these MSRs are described in Section 22.11, “Auto Counter Reload.” The enumeration in
CPUID.23H is true-view, and thus, the enumeration may only be set on (and the MSRs/counters they enumerate
only supported on) a subset of the logical processors of the system.
The architectural performance monitoring version 6 enhanced layout of the IA32_PERFEVTSELx MSR is shown in
Figure 22-14.
1. This feature is also available in a subset of processors with a CPUID signature value of DisplayFamily_DisplayModel 06_C5H or
06_C6H (though they report IA32_PERF_CAPABILITIES.PEBS_FMT as 5).
2. As an example, the IA32_PMC_GP1_CTR MSR has MSR address 1904H. Note that the legacy full-width MSR addresses for the
counters, IA32_A_PMCn MSRs, remains at MSR address 4C1H + n.
3. As an example, the IA32_PMC_GP1_CFG_A MSR has MSR address 1905H. Note that the legacy MSR address for the event select
registers, IA32_PERFEVTSELn MSRs, remain at MSR address 186H + n.
4. The valid range of fixed-function counters is 0 through 15.
22-16
Vol. 3B
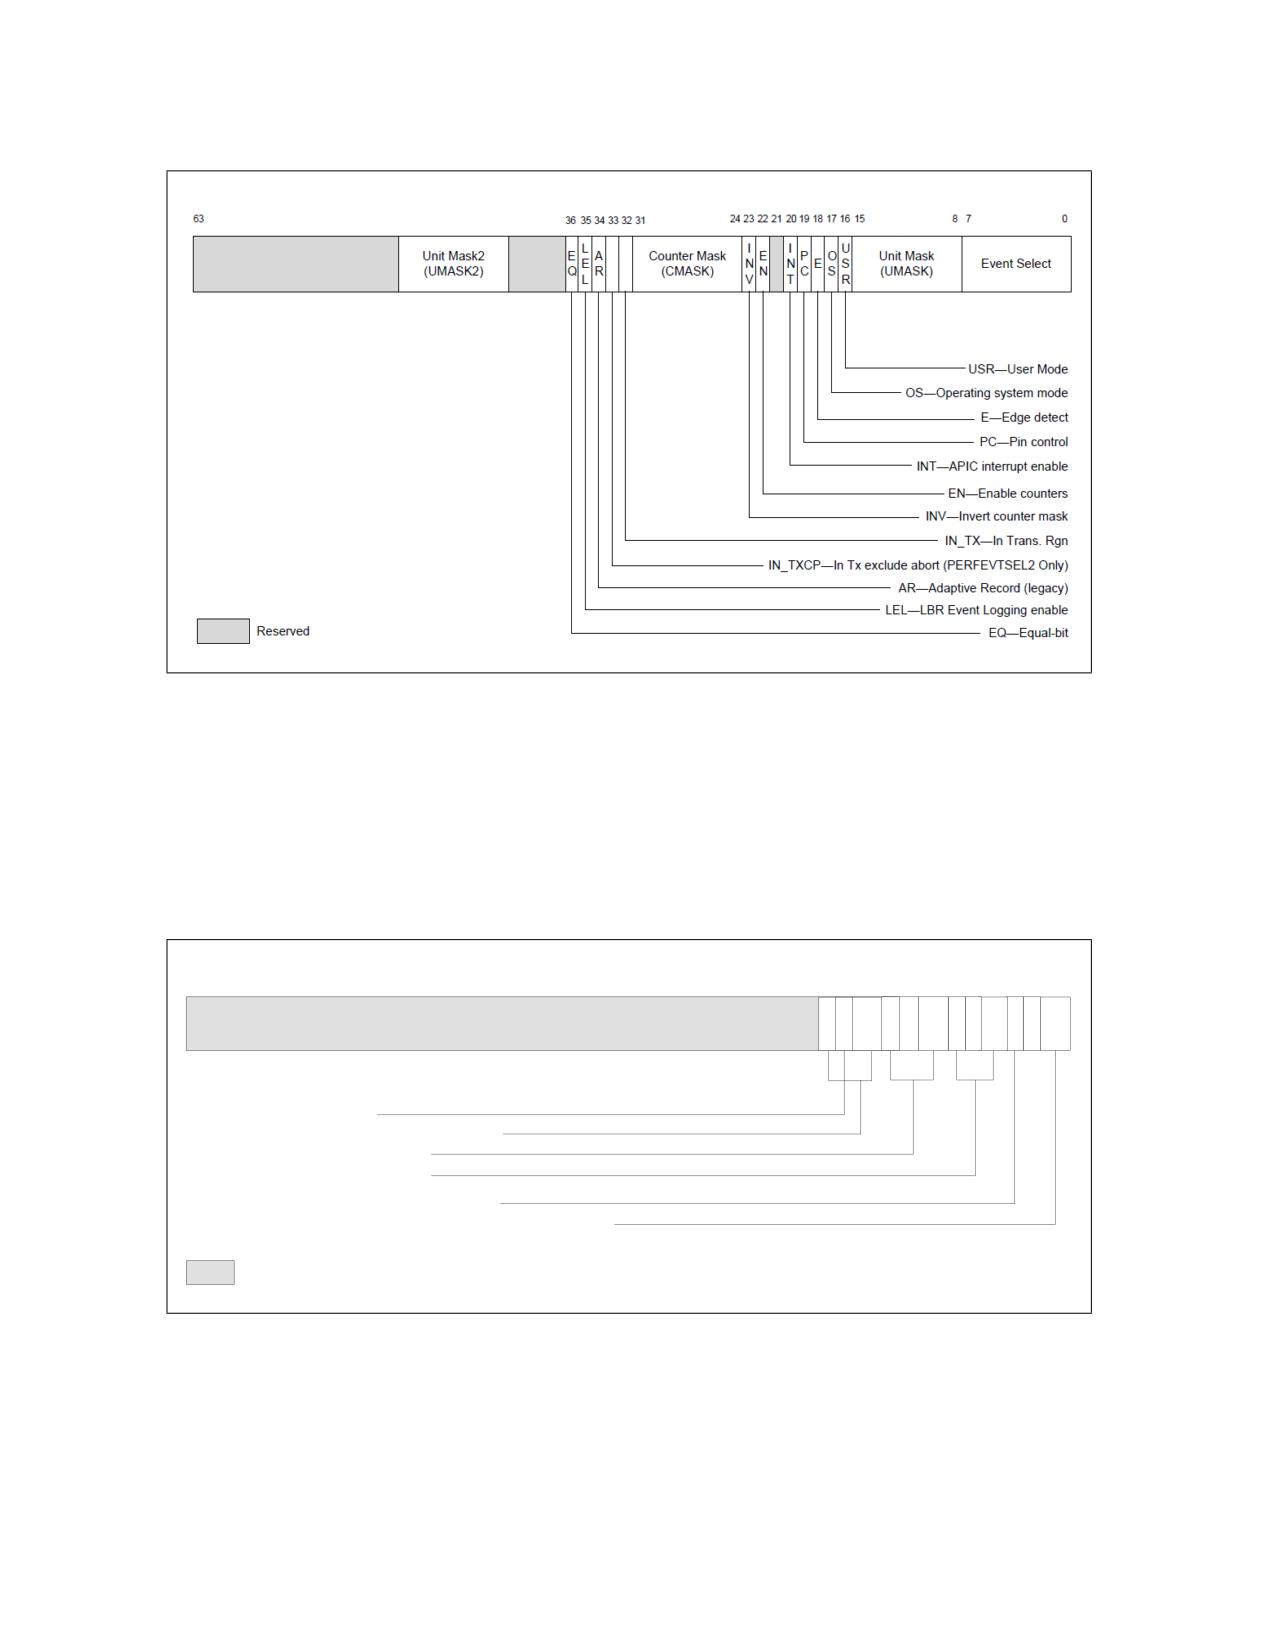
PERFORMANCE MONITORING
Figure 22-14. IA32_PMC_GPx_CFG_A MSR (also known as IA32_PERFEVTSELx)
Supporting Architectural Performance Monitoring Version 6
NOTES
The EQ bit and UMASK2 field are added in Architectural Performance Monitoring Version 6.
The IN_TX and IN_TXCP bits are available only on processors supporting Intel TSX.
The architectural performance monitoring version 6 enhanced layout of the IA32_FIXED_CTR_CTRL MSR is shown
in Figure 22-15.
63
15 14 13 12 11 10 9
8 7
6 5
4 3
2 1
0
P
M
P
M
P
M
E
E
E
M
B
M
B
M
B
N
N
N
I
Z
I
Z
I
Z
METRICS_CLEAR_EN (Bit 14)
Cntr3 - Controls for IA32_FIXED_CTR3 (Bits 15:12)
Cntr2 - Controls for IA32_FIXED_CTR2
Cntr1 - Controls for IA32_FIXED_CTR1
PMI - Enable PMI on overflow on IA32_FIXED_CTR0
ENABLE - IA32_FIXED_CTR0. 0: Disable; 1: OS; 2: User; 3: All ring levels
Reserved
Figure 22-15. IA32_FIXED_CTR_CTRL MSR Supporting Architectural Performance Monitoring Version 6
22.2.6.2 Unit Mask 2
Architectural performance monitoring version 6 introduces a new Unit Mask 2 (UMASK2) field in the
IA32_PERFEVTSELx MSRs. It is supported if enumerated by CPUID.23H.00H:EBX[0].
Vol. 3B
22-17

PERFORMANCE MONITORING
• UMASK2 field (bits 40 through 47): These bits qualify the condition that the selected event logic unit detects.
Valid UMASK2 values for each event logic unit are specific to the unit. The new UMASK2 field may also be used
in conjunction with UMASK.
22.2.6.3 Equal Flag
Architectural performance monitoring version 6 introduces a new Equal (EQ) flag in the IA32_PERFEVTSELx MSRs.
It is supported if enumerated by CPUID.23H.00H:EBX[1].
• EQ flag (bit 36): When the EQ flag is set and the INV flag is clear, the comparison evaluates to true if the
selected performance monitoring event (the event) is equal to the specified Counter Mask value (CMask). When
the EQ flag is set and the INV flag is set, the comparison evaluates to true if the event is less than the CMask
value and the event is not zero. Note that if the CMask is zero, the EQ flag is ignored.
22.2.7 Pre-defined Architectural Performance Events
Table Table 22-3. "UMask and Event Select Encodings for Pre-Defined Architectural Performance Events" lists archi-
tecturally defined events.
Table 22-3. UMask and Event Select Encodings for Pre-Defined Architectural Performance Events
Bit Position
Event Name
UMask
Event Select
CPUID.0AH:EBX and
CPUID.23H.03H:EAX
0
UnHalted Core Cycles
00H
3CH
1
Instruction Retired
00H
C0H
2
UnHalted Reference Cycles1
01H
3CH
3
LLC Reference
4FH
2EH
4
LLC Misses
41H
2EH
5
Branch Instruction Retired
00H
C4H
6
Branch Misses Retired
00H
C5H
7
Topdown Slots
01H
A4H
8
Topdown Backend Bound
02H
A4H
9
Topdown Bad Speculation
00H
73H
10
Topdown Frontend Bound
01H
9CH
11
Topdown Retiring
02H
C2H
12
LBR Inserts
01H
E4H
NOTES:
1. Implementations prior to the 12th generation Intel® Core™ processor P-cores count at core crystal clock, TSC, or bus clock frequency.
A processor that supports architectural performance monitoring may not support all the predefined architectural
performance events (Table Table 22-3. "UMask and Event Select Encodings for Pre-Defined Architectural Perfor-
mance Events"). The number of architectural events is reported through CPUID.0AH:EAX[31:24], while non-zero
bits in CPUID.0AH:EBX indicate any architectural events that are not available.
The behavior of each architectural performance event is expected to be consistent on all processors that support
that event. Minor variations between microarchitectures are noted below:
• UnHalted Core Cycles - Event select 3CH, Umask 00H
This event counts core clock cycles when the clock signal on a specific core is running (not halted). The counter
does not advance in the following conditions:
— An ACPI C-state other than C0 for normal operation.
22-18
Vol. 3B
PERFORMANCE MONITORING
- HLT.
- STPCLK# pin asserted.
- Being throttled by TM1.
- During the frequency switching phase of a performance state transition (see Chapter 17, “Power and
Thermal Management”).
The performance counter for this event counts across performance state transitions using different core clock
frequencies.
•
Instructions Retired - Event select C0H, Umask 00H
This event counts the number of instructions at retirement. For instructions that consist of multiple micro-ops,
this event counts the retirement of the last micro-op of the instruction. An instruction with a REP prefix counts
as one instruction (not per iteration). Faults before the retirement of the last micro-op of a multi-ops instruction
are not counted.
This event does not increment under VM-exit conditions. Counters continue counting during hardware
interrupts, traps, and inside interrupt handlers.
•
UnHalted Reference Cycles - Event select 3CH, Umask 01H
This event counts reference clock cycles at a fixed frequency while the clock signal on the core is running. The
event counts at a fixed frequency, irrespective of core frequency changes due to performance state transitions.
Processors may implement this behavior differently. Current implementations use the core crystal clock, TSC or
the bus clock. Because the rate may differ between implementations, software should calibrate it to a time
source with known frequency.
•
Last Level Cache References - Event select 2EH, Umask 4FH
This event counts requests originating from the core that reference a cache line in the last level on-die cache.
The event count includes speculation and cache line fills due to the first-level cache hardware prefetcher, but
may exclude cache line fills due to other hardware-prefetchers.
Because cache hierarchy, cache sizes and other implementation-specific characteristics; value comparison to
estimate performance differences is not recommended.
•
Last Level Cache Misses - Event select 2EH, Umask 41H
This event counts each cache miss condition for references to the last level on-die cache. The event count may
include speculation and cache line fills due to the first-level cache hardware prefetcher, but may exclude cache
line fills due to other hardware-prefetchers.
Because cache hierarchy, cache sizes and other implementation-specific characteristics; value comparison to
estimate performance differences is not recommended.
•
Branch Instructions Retired - Event select C4H, Umask 00H
This event counts branch instructions at retirement. It counts the retirement of the last micro-op of a branch
instruction.
•
All Branch Mispredict Retired - Event select C5H, Umask 00H
This event counts mispredicted branch instructions at retirement. It counts the retirement of the last micro-op
of a branch instruction in the architectural path of execution and experienced misprediction in the branch
prediction hardware.
Branch prediction hardware is implementation-specific across microarchitectures; value comparison to
estimate performance differences is not recommended.
•
Topdown Slots - Event select A4H, Umask 01H
This event counts the total number of available slots for an unhalted logical processor.
The event increments by machine-width of the narrowest pipeline as employed by the Top-down Microarchi-
tecture Analysis method. The count is distributed among unhalted logical processors (hyper-threads) who
share the same physical core, in processors that support Intel Hyper-Threading Technology.
Software can use this event as the denominator for the top-level metrics of the Top-down Microarchitecture
Analysis method.
Vol. 3B
22-19
PERFORMANCE MONITORING
NOTE
Programming decisions or software precisians on functionality should not be based on the event
values or dependent on the existence of performance monitoring events.
•
Topdown Backend Bound - Event select A4H, Umask 02H
This event counts a subset of the Topdown Slots event that was not consumed by the backend pipeline due to
lack of backend resources, as a result of memory subsystem delays, execution unit limitations, or other
conditions.
The count may be distributed among unhalted logical processors that share the same physical core, in
processors that support Intel® Hyper-Threading Technology.
Software can use this event as the numerator for the Backend Bound metric (or top-level category) of the
Topdown Microarchitecture Analysis method.
Software can also derive the Backend Bound Slots using the formula: Backend Bound Slots = (Total Slots -
Bad Speculation Slots - Frontend Bound Slots - Retiring Slots).
•
Topdown Bad Speculation - Event select 73H, Umask 00H
This event counts a subset of the Topdown Slots event that was wasted due to incorrect speculation as a result
of incorrect control-flow or data speculation. Common examples include branch mispredictions and memory
ordering clears.
The count may be distributed among impacted logical processors that share the same physical core, for some
processors that support Intel Hyper-Threading Technology.
Software can use this event as the numerator for the Bad Speculation metric (or top-level category) of the
Topdown Microarchitecture Analysis method.
Software can also derive the Bad Speculation Slots using the formula: Bad Speculation Slots = (Total Slots -
Backend Bound Slots - Frontend Bound Slots - Retiring Slots).
•
Topdown Frontend Bound - Event select 9CH, Umask 01H
This event counts a subset of the Topdown Slots event that had no operation delivered to the backend pipeline
due to instruction fetch limitations when the backend could have accepted more operations. Common examples
include instruction cache misses and x86 instruction decode limitations.
The count may be distributed among unhalted logical processors that share the same physical core, in
processors that support Intel Hyper-Threading Technology.
Software can use this event as the numerator for the Frontend Bound metric (or top-level category) of the
Topdown Microarchitecture Analysis method.
•
Topdown Retiring - Event select C2H, Umask 02H
This event counts a subset of the Topdown Slots event that is utilized by operations that eventually get retired
(committed) by the processor pipeline. Usually, this event positively correlates with higher performance as
measured by the instructions-per-cycle metric.
Software can use this event as the numerator for the Retiring metric (or top-level category) of the Topdown
Microarchitecture Analysis method.
•
LBR Inserts - Event select E4H, Umask 01H
This event counts when an LBR (Last Branch Record) entry is inserted or removed. Inserted means an actual
LBR buffer update has occurred, considering LBR configuration and filtering. An LBR entry is removed when a
RET instruction is retired in LBR Call-stack mode.
Software may use this event in usages like profile-guided optimization (PGO) for profiling collections across
Intel processors and in virtualized environments.
22.2.8 Full-Width Writes to Performance Counter Registers
The general-purpose performance counter registers IA32_PMCx are writable via WRMSR instruction. However, the
value written into IA32_PMCx by WRMSR is the signed extended 64-bit value of the EAX[31:0] input of WRMSR.
22-20
Vol. 3B
PERFORMANCE MONITORING
A processor that supports full-width writes to the general-purpose performance counters enumerated by
CPUID.0AH:EAX[15:8] will set IA32_PERF_CAPABILITIES[13] to enumerate its full-width-write capability See
Figure 22-67.
If IA32_PERF_CAPABILITIES.FW_WRITE[bit 13] =1, each IA32_PMCi is accompanied by a corresponding alias
address starting at 4C1H for IA32_A_PMC0.
The bit width of the performance monitoring counters is specified in CPUID.0AH:EAX[23:16].
If IA32_A_PMCi is present, the 64-bit input value (EDX:EAX) of WRMSR to IA32_A_PMCi will cause IA32_PMCi to
be updated by:
COUNTERWIDTH = CPUID.0AH:EAX[23:16] bit width of the performance monitoring counter
IA32_PMCi[COUNTERWIDTH-1:32] := EDX[COUNTERWIDTH-33:0]);
IA32_PMCi[31:0] := EAX[31:0];
EDX[63:COUNTERWIDTH] are reserved
22.2.9 Scalable Enumeration Architecture
The CPUIID.23H Architectural Performance Monitoring Extended (ARCH_PERFMON_EXT) leaf provides enhanced
enumeration of PMU architectural features. Additionally, the IA32_PERF_CAPABILITIES MSR enhances enumera-
tion for PMU non-architectural features.
NOTE
CPUID.0AH continues to report useful attributes, such as architectural performance monitoring
version ID and counter width (# bits).
CPUID.23H enhances previous enumeration of PMU capabilities:
• Supports CPUID sub-leaves to accommodate future PMU extensions.
• Exposes true-view resources per logical processor.
• Introduces a bitmap (true-view) enumeration of general-purpose counters availability.
• A bitmap (true-view) enumeration of fixed-function counters availability.
• A bitmap (true-view) enumeration of architectural performance monitoring events.
Processors that support this enhancement set CPUID.07H.01H:EAX.ARCH_PERFMON_EXT[8].
22.2.9.1 CPUID Sub-leaves
CPUID.23H contains additional architectural PMU capabilities. This leaf supports sub-leaves, providing each distinct
PMU feature with an individual sub-leaf for enumerating its details.
The availability of sub-leaves is enumerated via CPUID.23H.00H:EAX. For each bit n set in this field, sub-leaf n
under CPUID.23H is supported.
22.2.9.2 Reporting Per Logical Processor
CPUID.23H provides a true-view of per logical processor PMU capabilities. This leaf reports the actual support of the
individual logical processor that the CPUID instruction was executed on; this applies to all sub-leaves.
Software must not make assumptions that CPUID.23H would report any value the same on another logical
processor. It is required to read CPUID.23H on every logical processor and program that logical processor only
according to the values returned by the CPUID.23H directly executed upon it. It is a requirement of software to
compare and determine common features between logical processors if required by iterating over each logical
processor’s CPUID.23H.
Conversely, CPUID.0AH provides a maximum common set of capabilities across logical processors when a feature
is not supported by all logical processors.
Vol. 3B
22-21
PERFORMANCE MONITORING
NOTE
Locating a PMU feature under CPUID.23H alerts software that the feature may not be supported
uniformly across all logical processors.
22.2.9.3 General-Purpose Counters Bitmap
CPUID.23H.01H:EAX reports a bitmap for available general-purpose counters. (CPUID.0AH reports only the total
number of general-purpose counters.)
This capability enables a virtual-machine monitor to reserve lower-index counters for its own use, while exposing
higher-index counters to guest software. This is especially important should the general-purpose counters not be
fully homogeneous.
Software should utilize the new bitmap reporting, including for detecting the number of available general-purpose
counters. To facilitate this transition, the number of general-purpose counters in CPUID.0AH will not go beyond
eight, even if the processor has support for more than eight general-purpose counters.
Note that general-purpose counters that are exclusively enumerated in CPUID.23H.01H:EAX may not support the
legacy MSR address range; see Section 22.2.6.1, “Performance Monitoring MSR Aliasing,” for details.
22.2.9.4 Fixed-Function Counters True-View Bitmap
CPUID.23H.01H:EBX reports a bitmap for available fixed-function counters. (CPUID.0AH reports the common
number of contiguous fixed-function counters in addition to a common bitmap of fixed-function counters avail-
ability.)1
This capability enables privileged software to expose per logical processor enumeration of fixed-function counters.
This is especially important should the fixed-function counters not be available on all logical processors.
Note that programmable counters that are exclusively enumerated in CPUID.23H.01H:EAX may not support the
legacy MSR address range; see Section 22.2.6.1, “Performance Monitoring MSR Aliasing,” for details.
22.2.9.5 Architectural Performance Monitoring Events Bitmap
CPUID.23H.03H:EAX provides a true-view of per logical processor available architectural performance monitoring
events. For each bit n set in this field, the processor supports Architectural Performance Monitoring Event of index
n (positive polarity).
Conversely, CPUID.0AH:EBX provides a maximum common set of architectural performance monitoring events
supported by all logical processors, where if bit n is set, it denotes the processor does not necessarily support
Architectural Performance Monitoring Event of index n on all logical processors (negative polarity).
22.2.9.6 TMA Slots Per Cycle
CPUID.23H.00H:ECX[7:0] reports the number of TMA slots per cycle in a true-view per logical-processor fashion.
This number can be multiplied by the number of cycles (from CPU_CLK_UNHALTED.THREAD /
CPU_CLK_UNHALTED.CORE or IA32_FIXED_CTR1) to determine the total number of TMA slots.
Because of microarchitectural reasons, some logical processors may be reporting TMA slots per cycle as 0. In such
situations, software can use other methods, like programmable events or fixed counters, to understand the perfor-
mance issues.
1. The valid range of fixed-function counters is 0 through 15.
22-22
Vol. 3B

PERFORMANCE MONITORING
22.3
PERFORMANCE MONITORING (INTEL® CORE™ PROCESSORS AND INTEL®
XEON® PROCESSORS)
22.3.1 Performance Monitoring for Processors Based on Nehalem Microarchitecture
Intel Core i7 processor family1 supports architectural performance monitoring capability with version ID 3 (see
Section 22.2.3) and a host of non-architectural monitoring capabilities. The Intel Core i7 processor family is based
on Nehalem microarchitecture, and provides four general-purpose performance counters (IA32_PMC0,
IA32_PMC1, IA32_PMC2, IA32_PMC3) and three fixed-function performance counters (IA32_FIXED_CTR0, IA32_-
FIXED_CTR1, IA32_FIXED_CTR2) in the processor core.
Non-architectural performance monitoring in Intel Core i7 processor family uses the IA32_PERFEVTSELx MSR to
configure a set of non-architecture performance monitoring events to be counted by the corresponding general-
purpose performance counter. The list of non-architectural performance monitoring events can be found at:
https://perfmon-events.intel.com/. Non-architectural performance monitoring events fall into two broad catego-
ries:
• Performance monitoring events in the processor core: These include many events that are similar to
performance monitoring events available to processor based on Intel Core microarchitecture. Additionally,
there are several enhancements in the performance monitoring capability for detecting microarchitectural
conditions in the processor core or in the interaction of the processor core to the off-core sub-systems in the
physical processor package. The off-core sub-systems in the physical processor package is loosely referred to
as “uncore“.
• Performance monitoring events in the uncore: The uncore sub-system is shared by more than one processor
cores in the physical processor package. It provides additional performance monitoring facility outside of
IA32_PMCx and performance monitoring events that are specific to the uncore sub-system.
Architectural and non-architectural performance monitoring events in Intel Core i7 processor family support thread
qualification using bit 21 of IA32_PERFEVTSELx MSR.
The bit fields within each IA32_PERFEVTSELx MSR are defined in Figure 22-6 and described in Section and Section
22.2.3.
63 62 6160
3534333231
8 7
6
5 4
3
2
1
0
CHG (R/W)
OVF_PMI (R/W)
OVF_FC2 (R/O)
OVF_FC1 (R/O)
OVF_FC0 (R/O)
OVF_PC7 (R/O), if CCNT>7
OVF_PC6 (R/O), if CCNT>6
OVF_PC5 (R/O), if CCNT>5
OVF_PC4 (R/O), if CCNT>4
OVF_PC3 (R/O)
OVF_PC2 (R/O)
OVF_PC1 (R/O)
OVF_PC0 (R/O)
Reserved
RESET Value - 00000000_00000000H
CCNT: CPUID.AH:EAX[15:8]
Figure 22-16. IA32_PERF_GLOBAL_STATUS MSR
1. Intel Xeon processor 5500 series and 3400 series are also based on Nehalem microarchitecture; the performance monitoring facili-
ties described in this section generally also apply.
Vol. 3B
22-23
PERFORMANCE MONITORING
22.3.1.1 Enhancements of Performance Monitoring in the Processor Core
The notable enhancements in the monitoring of performance events in the processor core include:
• Four general purpose performance counters, IA32_PMCx, associated counter configuration MSRs, IA32_PERFE-
VTSELx, and global counter control MSR supporting simplified control of four counters. Each of the four
performance counter can support processor event based sampling (PEBS) and thread-qualification of architec-
tural and non-architectural performance events. Width of IA32_PMCx supported by hardware has been
increased. The width of counter reported by CPUID.0AH:EAX[23:16] is 48 bits. The PEBS facility in Nehalem
microarchitecture has been enhanced to include new data format to capture additional information, such as
load latency.
• Load latency sampling facility. Average latency of memory load operation can be sampled using load-latency
facility in processors based on Nehalem microarchitecture. This field measures the load latency from load's first
dispatch of till final data writeback from the memory subsystem. The latency is reported for retired demand
load operations and in core cycles (it accounts for re-dispatches). This facility is used in conjunction with the
PEBS facility.
• Off-core response counting facility. This facility in the processor core allows software to count certain
transaction responses between the processor core to sub-systems outside the processor core (uncore).
Counting off-core response requires additional event qualification configuration facility in conjunction with
IA32_PERFEVTSELx. Two off-core response MSRs are provided to use in conjunction with specific event codes
that must be specified with IA32_PERFEVTSELx.
NOTE
The number of counters available to software may vary from the number of physical counters
present on the hardware, because an agent running at a higher privilege level (e.g., a VMM) may
not expose all counters. CPUID.0AH:EAX[15:8] reports the MSRs available to software; see Section
22.2.1.
22.3.1.1.1 Processor Event Based Sampling (PEBS)
All general-purpose performance counters, IA32_PMCx, can be used for PEBS if the performance event supports
PEBS. Software uses IA32_MISC_ENABLE[7] and IA32_MISC_ENABLE[12] to detect whether the performance
monitoring facility and PEBS functionality are supported in the processor. The MSR IA32_PEBS_ENABLE provides 4
bits that software must use to enable which IA32_PMCx overflow condition will cause the PEBS record to be
captured.
Additionally, the PEBS record is expanded to allow latency information to be captured. The MSR IA32_PEBS_EN-
ABLE provides 4 additional bits that software must use to enable latency data recording in the PEBS record upon
the respective IA32_PMCx overflow condition. The layout of IA32_PEBS_ENABLE for processors based on Nehalem
microarchitecture is shown in Figure 22-17.
When a counter is enabled to capture machine state (PEBS_EN_PMCx = 1), the processor will write machine state
information to a memory buffer specified by software as detailed below. When the counter IA32_PMCx overflows
from maximum count to zero, the PEBS hardware is armed.
22-24
Vol. 3B
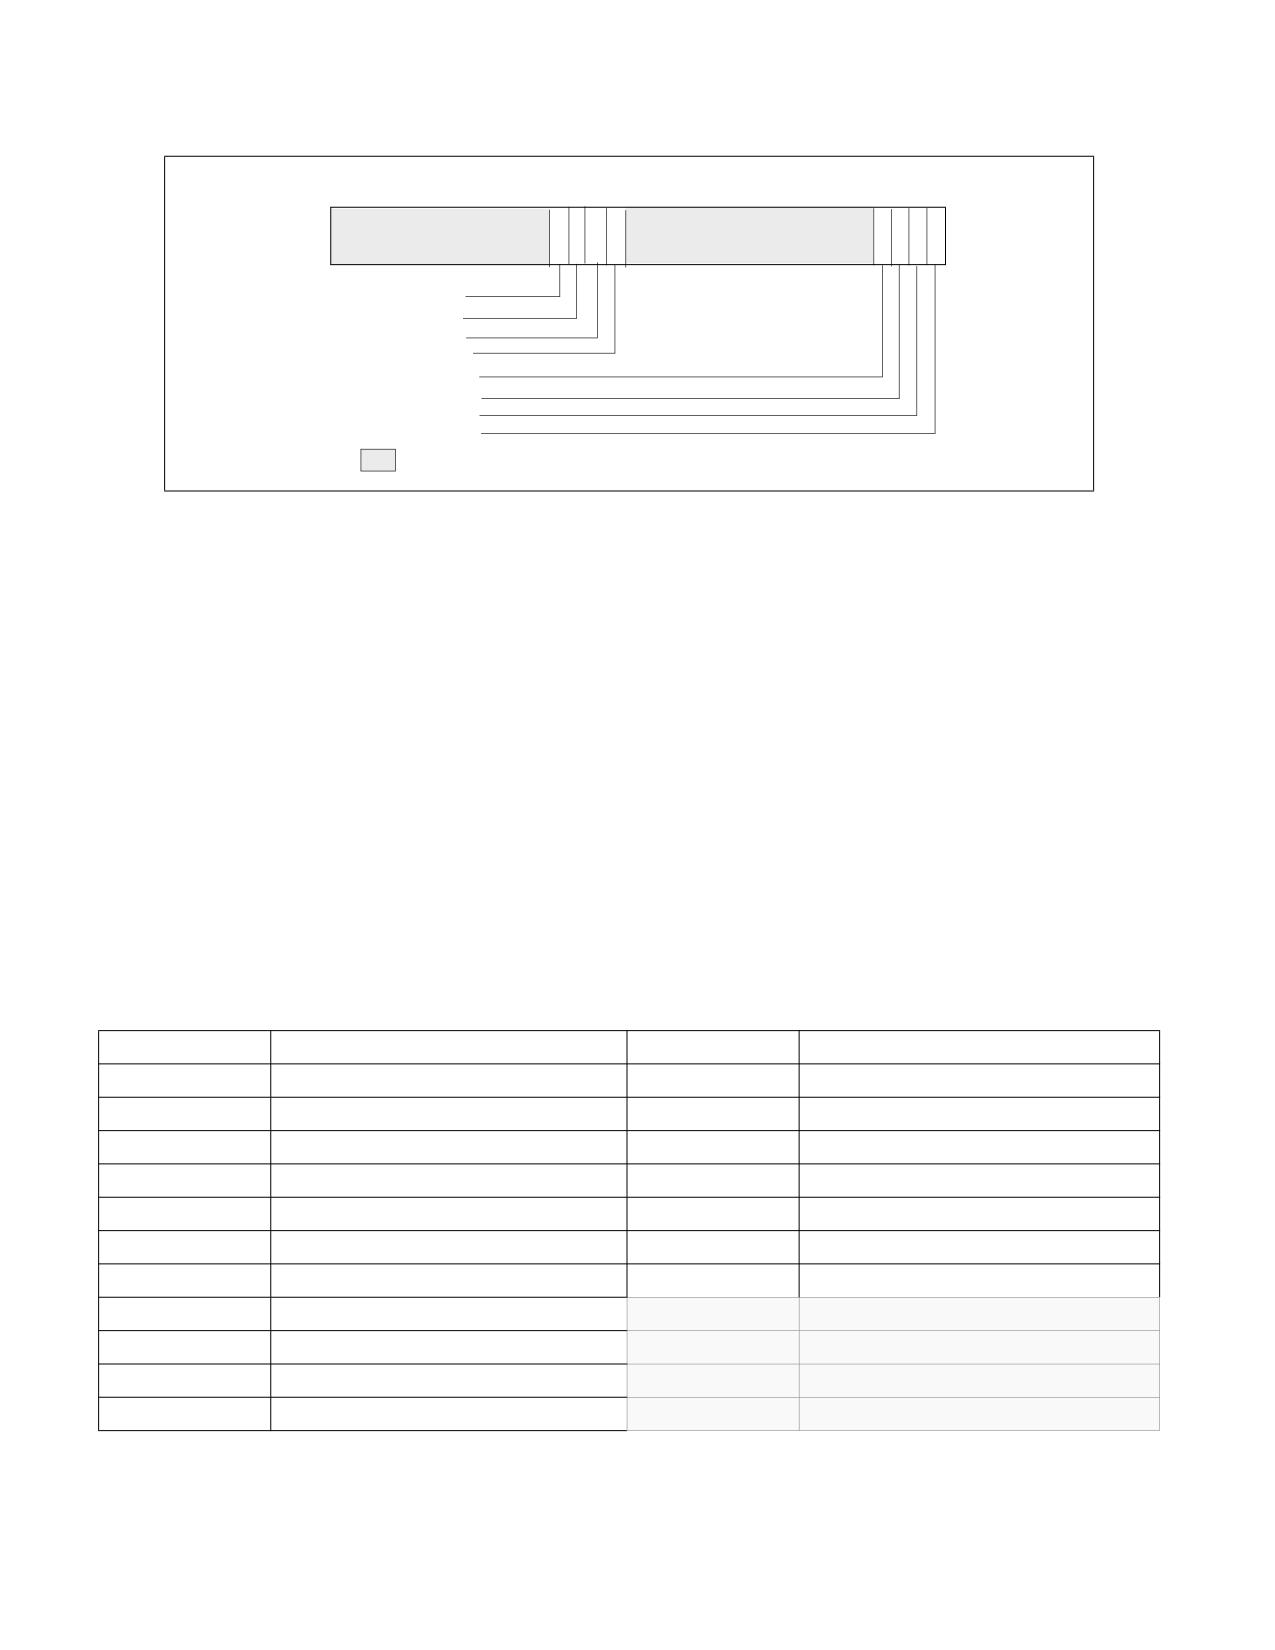
PERFORMANCE MONITORING
63
363534
33 32
31
8 7
6
5 4
3
2
1
0
LL_EN_PMC3 (R/W)
LL_EN_PMC2 (R/W)
LL_EN_PMC1 (R/W)
LL_EN_PMC0 (R/W)
PEBS_EN_PMC3 (R/W)
PEBS_EN_PMC2 (R/W)
PEBS_EN_PMC1 (R/W)
PEBS_EN_PMC0 (R/W)
Reserved
RESET Value - 00000000_00000000H
Figure 22-17. Layout of IA32_PEBS_ENABLE MSR
Upon occurrence of the next PEBS event, the PEBS hardware triggers an assist and causes a PEBS record to be
written. The format of the PEBS record is indicated by the bit field IA32_PERF_CAPABILITIES[11:8] (see
Figure 22-67).
The behavior of PEBS assists is reported by IA32_PERF_CAPABILITIES[6] (see Figure 22-67). The return instruc-
tion pointer (RIP) reported in the PEBS record will point to the instruction after (+1) the instruction that causes the
PEBS assist. The machine state reported in the PEBS record is the machine state after the instruction that causes
the PEBS assist is retired. For instance, if the instructions:
mov eax, [eax] ; causes PEBS assist
nop
are executed, the PEBS record will report the address of the nop, and the value of EAX in the PEBS record will show
the value read from memory, not the target address of the read operation.
The PEBS record format is shown in Table Table 22-4. "PEBS Record Format for Intel Core i7 Processor Family", and
each field in the PEBS record is 64 bits long. The PEBS record format, along with debug/store area storage format,
does not change regardless of IA-32e mode is active or not. CPUID.01H:ECX.DTES64[2] reports whether the
processor's DS storage format support is mode-independent. When set, it uses 64-bit DS storage format.
Table 22-4. PEBS Record Format for Intel Core i7 Processor Family
Byte Offset
Field
Byte Offset
Field
00H
R/EFLAGS
58H
R9
08H
R/EIP
60H
R10
10H
R/EAX
68H
R11
18H
R/EBX
70H
R12
20H
R/ECX
78H
R13
28H
R/EDX
80H
R14
30H
R/ESI
88H
R15
38H
R/EDI
90H
IA32_PERF_GLOBAL_STATUS
40H
R/EBP
98H
Data Linear Address
48H
R/ESP
A0H
Data Source Encoding
50H
R8
A8H
Latency value (core cycles)
Vol. 3B
22-25
PERFORMANCE MONITORING
In IA-32e mode, the full 64-bit value is written to the register. If the processor is not operating in IA-32e mode, 32-
bit value is written to registers with bits 63:32 zeroed. Registers not defined when the processor is not in IA-32e
mode are written to zero.
Bytes AFH:90H are enhancement to the PEBS record format. Support for this enhanced PEBS record format is indi-
cated by IA32_PERF_CAPABILITIES[11:8] encoding of 0001B.
The value written to bytes 97H:90H is the state of the IA32_PERF_GLOBAL_STATUS register before the PEBS assist
occurred. This value is written so software can determine which counters overflowed when this PEBS record was
written. Note that this field indicates the overflow status for all counters, regardless of whether they were
programmed for PEBS or not.
Programming PEBS Facility
Only a subset of non-architectural performance events in the processor support PEBS. The subset of precise events
are listed in Table Table 22-88. "PEBS Performance Events for Intel Core Microarchitecture". In addition to using
IA32_PERFEVTSELx to specify event unit/mask settings and setting the EN_PMCx bit in the IA32_PEBS_ENABLE
register for the respective counter, the software must also initialize the DS_BUFFER_MANAGEMENT_AREA data
structure in memory to support capturing PEBS records for precise events.
The recording of PEBS records may not operate properly if accesses to the linear addresses in the DS buffer
management area or in the PEBS buffer (see below) cause page faults, VM exits, or the setting of accessed or dirty
flags in the paging structures (ordinary or EPT). For that reason, system software should establish paging struc-
tures (both ordinary and EPT) to prevent such occurrences. Implications of this may be that an operating system
should allocate this memory from a non-paged pool and that system software cannot do “lazy” page-table entry
propagation for these pages. A virtual-machine monitor may choose to allow use of PEBS by guest software only if
EPT maps all guest-physical memory as present and read/write.
NOTE
PEBS events are only valid when the following fields of IA32_PERFEVTSELx are all zero: AnyThread,
Edge, Invert, CMask.
The beginning linear address of the DS_BUFFER_MANAGEMENT_AREA data structure must be programmed into
the IA32_DS_AREA register. The layout of the DS_BUFFER_MANAGEMENT_AREA is shown in Figure 22-18.
• PEBS Buffer Base: This field is programmed with the linear address of the first byte of the PEBS buffer
allocated by software. The processor reads this field to determine the base address of the PEBS buffer.
• PEBS Index: This field is initially programmed with the same value as the PEBS Buffer Base field, or the
beginning linear address of the PEBS buffer. The processor reads this field to determine the location of the next
PEBS record to write to. After a PEBS record has been written, the processor also updates this field with the
address of the next PEBS record to be written. The figure above illustrates the state of PEBS Index after the first
PEBS record is written.
• PEBS Absolute Maximum: This field represents the absolute address of the maximum length of the allocated
PEBS buffer plus the starting address of the PEBS buffer. The processor will not write any PEBS record beyond
the end of PEBS buffer, when PEBS Index equals PEBS Absolute Maximum. No signaling is generated when
PEBS buffer is full. Software must reset the PEBS Index field to the beginning of the PEBS buffer address to
continue capturing PEBS records.
22-26
Vol. 3B
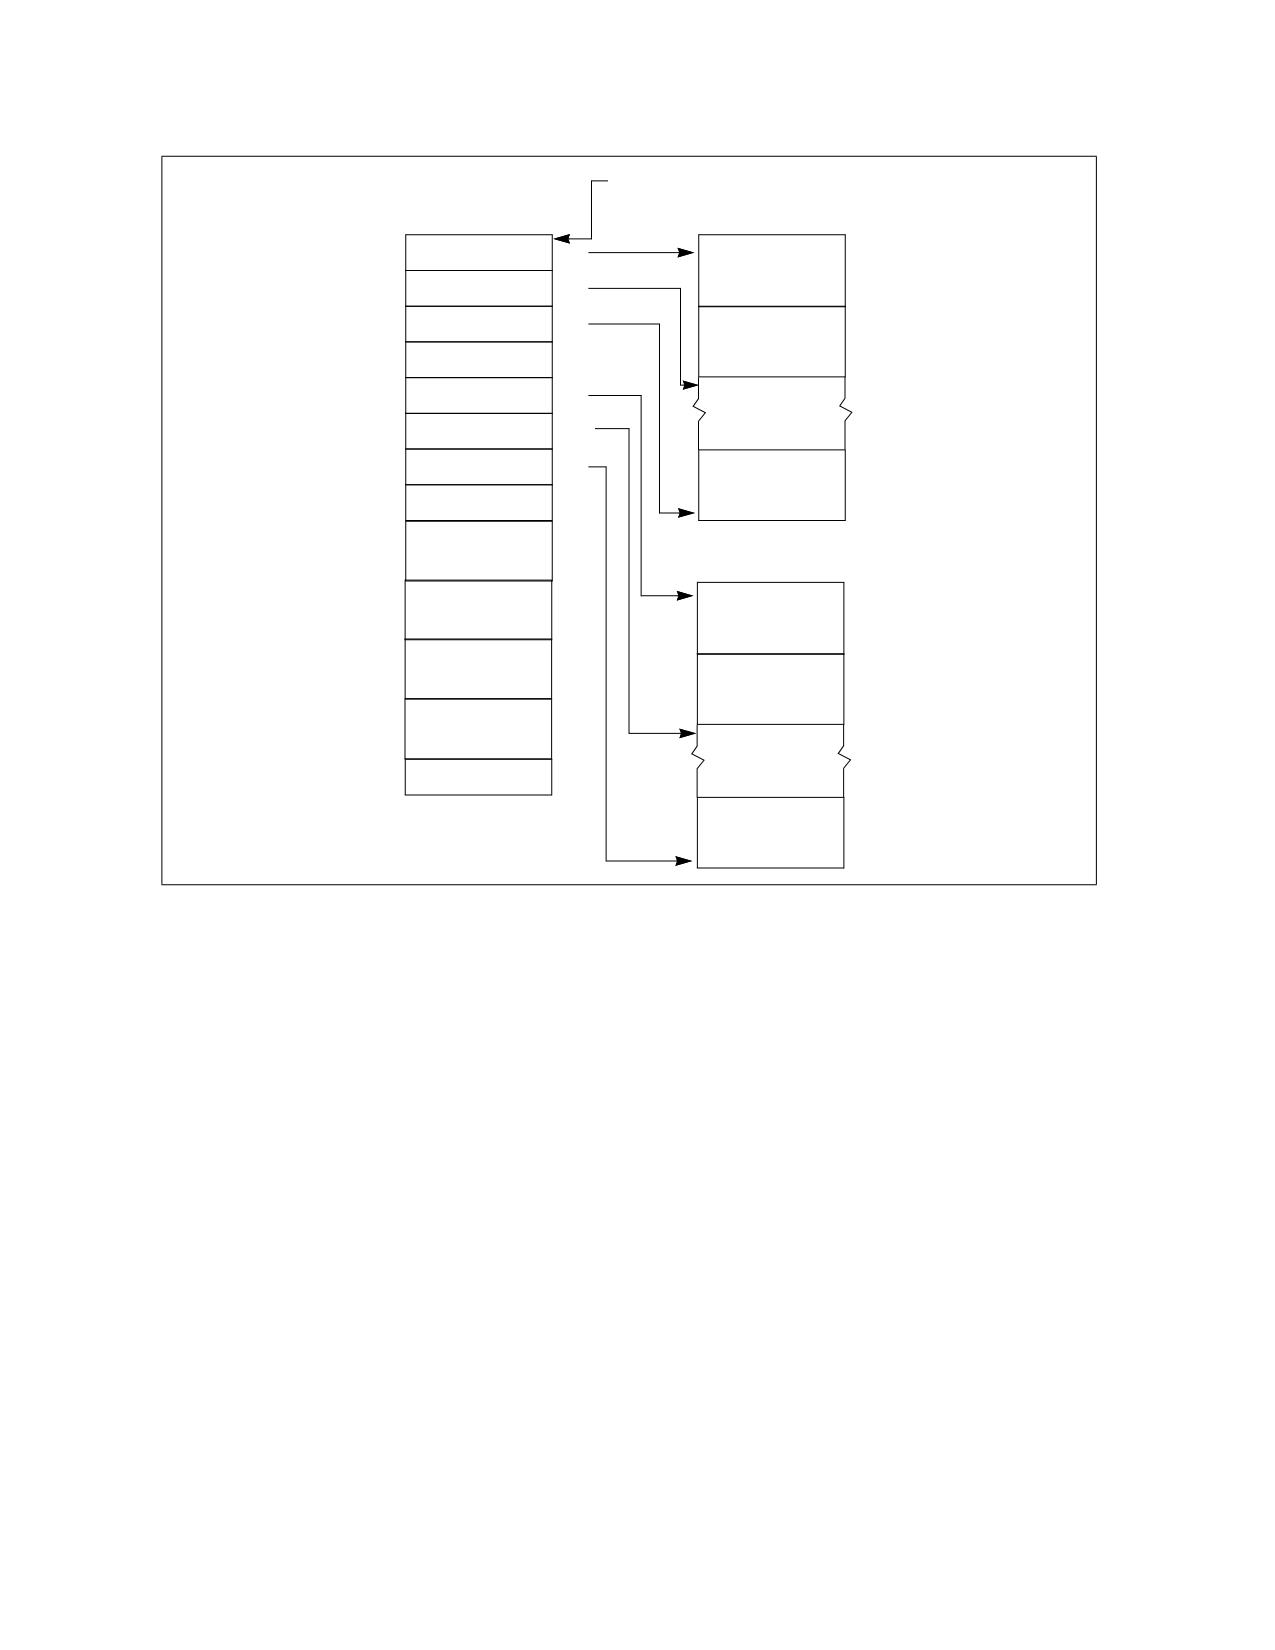
PERFORMANCE MONITORING
IA32_DS_AREA MSR
DS Buffer Management Area
BTS Buffer
BTS Buffer Base
0H
Branch Record 0
BTS Index
8H
BTS Absolute
10H
Maximum
Branch Record 1
BTS Interrupt
18H
Threshold
PEBS Buffer Base
20H
PEBS Index
28H
PEBS Absolute
30H
Maximum
Branch Record n
PEBS Interrupt
38H
Threshold
40H
PEBS
Counter0 Reset
PEBS Buffer
48H
PEBS
Counter1 Reset
PEBS Record 0
50H
PEBS
Counter2 Reset
PEBS Record 1
58H
PEBS
Counter3 Reset
60H
Reserved
PEBS Record n
Figure 22-18. PEBS Programming Environment
•
PEBS Interrupt Threshold: This field specifies the threshold value to trigger a performance interrupt and
notify software that the PEBS buffer is nearly full. This field is programmed with the linear address of the first
byte of the PEBS record within the PEBS buffer that represents the threshold record. After the processor writes
a PEBS record and updates PEBS Index, if the PEBS Index reaches the threshold value of this field, the
processor will generate a performance interrupt. This is the same interrupt that is generated by a performance
counter overflow, as programmed in the Performance Monitoring Counters vector in the Local Vector Table of
the Local APIC. When a performance interrupt due to PEBS buffer full is generated, the IA32_PERF_-
GLOBAL_STATUS.PEBS_Ovf bit will be set.
•
PEBS CounterX Reset: This field allows software to set up PEBS counter overflow condition to occur at a rate
useful for profiling workload, thereby generating multiple PEBS records to facilitate characterizing the profile
the execution of test code. After each PEBS record is written, the processor checks each counter to see if it
overflowed and was enabled for PEBS (the corresponding bit in IA32_PEBS_ENABLED was set). If these
conditions are met, then the reset value for each overflowed counter is loaded from the DS Buffer Management
Area. For example, if counter IA32_PMC0 caused a PEBS record to be written, then the value of “PEBS Counter
0 Reset” would be written to counter IA32_PMC0. If a counter is not enabled for PEBS, its value will not be
modified by the PEBS assist.
Performance Counter Prioritization
Performance monitoring interrupts are triggered by a counter transitioning from maximum count to zero
(assuming IA32_PerfEvtSelX.INT is set). This same transition will cause PEBS hardware to arm, but not trigger.
PEBS hardware triggers upon detection of the first PEBS event after the PEBS hardware has been armed (a 0 to 1
transition of the counter). At this point, a PEBS assist will be undertaken by the processor.
Vol. 3B
22-27
PERFORMANCE MONITORING
Performance counters (fixed and general-purpose) are prioritized in index order. That is, counter IA32_PMC0 takes
precedence over all other counters. Counter IA32_PMC1 takes precedence over counters IA32_PMC2 and
IA32_PMC3, and so on. This means that if simultaneous overflows or PEBS assists occur, the appropriate action will
be taken for the highest priority performance counter. For example, if IA32_PMC1 cause an overflow interrupt and
IA32_PMC2 causes an PEBS assist simultaneously, then the overflow interrupt will be serviced first.
The PEBS threshold interrupt is triggered by the PEBS assist, and is by definition prioritized lower than the PEBS
assist. Hardware will not generate separate interrupts for each counter that simultaneously overflows. General-
purpose performance counters are prioritized over fixed counters.
If a counter is programmed with a precise (PEBS-enabled) event and programmed to generate a counter overflow
interrupt, the PEBS assist is serviced before the counter overflow interrupt is serviced. If in addition the PEBS inter-
rupt threshold is met, the
threshold interrupt is generated after the PEBS assist completes, followed by the counter overflow interrupt (two
separate interrupts are generated).
Uncore counters may be programmed to interrupt one or more processor cores (see Section 22.3.1.2). It is
possible for interrupts posted from the uncore facility to occur coincident with counter overflow interrupts from the
processor core. Software must check core and uncore status registers to determine the exact origin of counter
overflow interrupts.
22.3.1.1.2 Load Latency Performance Monitoring Facility
The load latency facility provides software a means to characterize the average load latency to different levels of
cache/memory hierarchy. This facility requires processor supporting enhanced PEBS record format in the PEBS
buffer, see Table Table 22-4. "PEBS Record Format for Intel Core i7 Processor Family". This field measures the load
latency from load's first dispatch of till final data writeback from the memory subsystem. The latency is reported for
retired demand load operations and in core cycles (it accounts for re-dispatches).
To use this feature software must assure:
• One of the IA32_PERFEVTSELx MSR is programmed to specify the event unit MEM_INST_RETIRED, and the
LATENCY_ABOVE_THRESHOLD event mask must be specified (IA32_PerfEvtSelX[15:0] = 100H). The corre-
sponding counter IA32_PMCx will accumulate event counts for architecturally visible loads which exceed the
programmed latency threshold specified separately in a MSR. Stores are ignored when this event is
programmed. The CMASK or INV fields of the IA32_PerfEvtSelX register used for counting load latency must be
0. Writing other values will result in undefined behavior.
• The MSR_PEBS_LD_LAT_THRESHOLD MSR is programmed with the desired latency threshold in core clock
cycles. Loads with latencies greater than this value are eligible for counting and latency data reporting. The
minimum value that may be programmed in this register is 3 (the minimum detectable load latency is 4 core
clock cycles).
• The PEBS enable bit in the IA32_PEBS_ENABLE register is set for the corresponding IA32_PMCx counter
register. This means that both the PEBS_EN_CTRX and LL_EN_CTRX bits must be set for the counter(s) of
interest. For example, to enable load latency on counter IA32_PMC0, the IA32_PEBS_ENABLE register must be
programmed with the 64-bit value 00000001_00000001H.
When the load-latency facility is enabled, load operations are randomly selected by hardware and tagged to carry
information related to data source locality and latency. Latency and data source information of tagged loads are
updated internally.
When a PEBS assist occurs, the last update of latency and data source information are captured by the assist and
written as part of the PEBS record. The PEBS sample after value (SAV), specified in PEBS CounterX Reset, operates
orthogonally to the tagging mechanism. Loads are randomly tagged to collect latency data. The SAV controls the
number of tagged loads with latency information that will be written into the PEBS record field by the PEBS assists.
The load latency data written to the PEBS record will be for the last tagged load operation which retired just before
the PEBS assist was invoked.
The load-latency information written into a PEBS record (see Table Table 22-4. "PEBS Record Format for Intel Core
i7 Processor Family", bytes AFH:98H) consists of:
• Data Linear Address: This is the linear address of the target of the load operation.
22-28
Vol. 3B

PERFORMANCE MONITORING
• Latency Value: This is the elapsed cycles of the tagged load operation between dispatch to GO, measured in
processor core clock domain.
• Data Source: The encoded value indicates the origin of the data obtained by the load instruction. The
encoding is shown in Table Table 22-5. "Data Source Encoding for Load Latency Record". In the descriptions,
local memory refers to system memory physically attached to a processor package, and remote memory refers
to system memory physically attached to another processor package.
Table 22-5. Data Source Encoding for Load Latency Record
Encoding
Description
00H
Unknown L3 cache miss.
01H
Minimal latency core cache hit. This request was satisfied by the L1 data cache.
02H
Pending core cache HIT. Outstanding core cache miss to same cache-line address was already underway.
03H
This data request was satisfied by the L2.
04H
L3 HIT. Local or Remote home requests that hit L3 cache in the uncore with no coherency actions required (snooping).
05H
L3 HIT. Local or Remote home requests that hit the L3 cache and were serviced by another processor core with a
cross core snoop where no modified copies were found. (clean).
06H
L3 HIT. Local or Remote home requests that hit the L3 cache and were serviced by another processor core with a
cross core snoop where no modified copies were found.
07H1
Reserved/LLC Snoop HitM. Local or Remote home requests that hit the last level cache and were serviced by another
core with a cross core snoop where modified copies were found.
08H
Reserved/L3 MISS. Local homed requests that missed the L3 cache and were serviced by forwarded data following a
cross package snoop where no modified copies were found. (Remote home requests are not counted).
09H
Reserved
0AH
L3 MISS. Local home requests that missed the L3 cache and were serviced by local DRAM (go to shared state).
0BH
L3 MISS. Remote home requests that missed the L3 cache and were serviced by remote DRAM (go to shared state).
0CH
L3 MISS. Local home requests that missed the L3 cache and were serviced by local DRAM (go to exclusive state).
0DH
L3 MISS. Remote home requests that missed the L3 cache and were serviced by remote DRAM (go to exclusive state).
0EH
I/O, Request of input/output operation.
0FH
The request was to uncacheable memory.
NOTES:
1. Bit 7 is supported only for processors with a CPUID DisplayFamily_DisplayModel signature of 06_2A, and 06_2E; otherwise it is
reserved.
The layout of MSR_PEBS_LD_LAT_THRESHOLD is shown in Figure 22-19.
63
1615
0
THRHLD - Load latency threshold
Reserved
RESET Value - 00000000_00000000H
Figure 22-19. Layout of MSR_PEBS_LD_LAT MSR
Vol. 3B
22-29

PERFORMANCE MONITORING
Bits 15:0 specifies the threshold load latency in core clock cycles. Performance events with latencies greater than
this value are counted in IA32_PMCx and their latency information is reported in the PEBS record. Otherwise, they
are ignored. The minimum value that may be programmed in this field is 3.
22.3.1.1.3 Off-core Response Performance Monitoring in the Processor Core
Programming a performance event using the off-core response facility can choose any of the four IA32_PERFEVT-
SELx MSR with specific event codes and predefine mask bit value. Each event code for off-core response monitoring
requires programming an associated configuration MSR, MSR_OFFCORE_RSP_0. There is only one off-core
response configuration MSR. Table Table 22-6. "Off-Core Response Event Encoding" lists the event code, mask
value and additional off-core configuration MSR that must be programmed to count off-core response events using
IA32_PMCx.
Table 22-6. Off-Core Response Event Encoding
Event code in
Mask Value in
IA32_PERFEVTSELx
IA32_PERFEVTSELx
Required Off-core Response MSR
B7H
01H
MSR_OFFCORE_RSP_0 (address 1A6H)
The layout of MSR_OFFCORE_RSP_0 is shown in Figure 22-20. Bits 7:0 specifies the request type of a transaction
request to the uncore. Bits 15:8 specifies the response of the uncore subsystem.
63
15 14 1312 11
10
9
8 7
6
5
4
3
2
1
0
RESPONSE TYPE - NON_DRAM (R/W)
RESPONSE TYPE - LOCAL_DRAM (R/W)
RESPONSE TYPE - REMOTE_DRAM (R/W)
RESPONSE TYPE - REMOTE_CACHE_FWD (R/W)
RESPONSE TYPE - RESERVED
RESPONSE TYPE - OTHER_CORE_HITM (R/W)
RESPONSE TYPE - OTHER_CORE_HIT_SNP (R/W)
RESPONSE TYPE - UNCORE_HIT (R/W)
REQUEST TYPE - OTHER (R/W)
REQUEST TYPE - PF_IFETCH (R/W)
REQUEST TYPE - PF_RFO (R/W)
REQUEST TYPE - PF_DATA_RD (R/W)
REQUEST TYPE - WB (R/W)
REQUEST TYPE - DMND_IFETCH (R/W)
REQUEST TYPE - DMND_RFO (R/W)
REQUEST TYPE - DMND_DATA_RD (R/W)
Reserved
RESET Value - 00000000_00000000H
Figure 22-20. Layout of MSR_OFFCORE_RSP_0 and MSR_OFFCORE_RSP_1 to Configure Off-core Response Events
Table 22-7. MSR_OFFCORE_RSP_0 and MSR_OFFCORE_RSP_1 Bit Field Definition
Bit Name
Offset
Description
DMND_DATA_RD
0
Counts the number of demand and DCU prefetch data reads of full and partial cachelines as well as
demand data page table entry cacheline reads. Does not count L2 data read prefetches or instruction
fetches.
DMND_RFO
1
Counts the number of demand and DCU prefetch reads for ownership (RFO) requests generated by a
write to data cacheline. Does not count L2 RFO.
DMND_IFETCH
2
Counts the number of demand instruction cacheline reads and L1 instruction cacheline prefetches.
22-30
Vol. 3B

PERFORMANCE MONITORING
Table 22-7. MSR_OFFCORE_RSP_0 and MSR_OFFCORE_RSP_1 Bit Field Definition (Contd.)
Bit Name
Offset
Description
WB
3
Counts the number of writeback (modified to exclusive) transactions.
PF_DATA_RD
4
Counts the number of data cacheline reads generated by L2 prefetchers.
PF_RFO
5
Counts the number of RFO requests generated by L2 prefetchers.
PF_IFETCH
6
Counts the number of code reads generated by L2 prefetchers.
OTHER
7
Counts one of the following transaction types, including L3 invalidate, I/O, full or partial writes, WC or
non-temporal stores, CLFLUSH, Fences, lock, unlock, split lock.
UNCORE_HIT
8
L3 Hit: local or remote home requests that hit L3 cache in the uncore with no coherency actions
required (snooping).
OTHER_CORE_HI
9
L3 Hit: local or remote home requests that hit L3 cache in the uncore and was serviced by another
T_SNP
core with a cross core snoop where no modified copies were found (clean).
OTHER_CORE_HI
10
L3 Hit: local or remote home requests that hit L3 cache in the uncore and was serviced by another
TM
core with a cross core snoop where modified copies were found (HITM).
Reserved
11
Reserved
REMOTE_CACHE_
12
L3 Miss: local homed requests that missed the L3 cache and was serviced by forwarded data following
FWD
a cross package snoop where no modified copies found. (Remote home requests are not counted)
REMOTE_DRAM
13
L3 Miss: remote home requests that missed the L3 cache and were serviced by remote DRAM.
LOCAL_DRAM
14
L3 Miss: local home requests that missed the L3 cache and were serviced by local DRAM.
NON_DRAM
15
Non-DRAM requests that were serviced by IOH.
22.3.1.2 Performance Monitoring Facility in the Uncore
The “uncore” in Nehalem microarchitecture refers to subsystems in the physical processor package that are shared
by multiple processor cores. Some of the sub-systems in the uncore include the L3 cache, Intel QuickPath Inter-
connect link logic, and integrated memory controller. The performance monitoring facilities inside the uncore oper-
ates in the same clock domain as the uncore (U-clock domain), which is usually different from the processor core
clock domain. The uncore performance monitoring facilities described in this section apply to Intel Xeon processor
5500 series and processors with the following CPUID signatures: 06_1AH, 06_1EH, 06_1FH (see Chapter 2,
“Model-Specific Registers (MSRs),” in the Intel® 64 and IA-32 Architectures Software Developer’s Manual, Volume
4). An overview of the uncore performance monitoring facilities is described separately.
The performance monitoring facilities available in the U-clock domain consist of:
• Eight General-purpose counters (MSR_UNCORE_PerfCntr0 through MSR_UNCORE_PerfCntr7). The counters
are 48 bits wide. Each counter is associated with a configuration MSR, MSR_UNCORE_PerfEvtSelx, to specify
event code, event mask and other event qualification fields. A set of global uncore performance counter
enabling/overflow/status control MSRs are also provided for software.
• Performance monitoring in the uncore provides an address/opcode match MSR that provides event qualification
control based on address value or QPI command opcode.
• One fixed-function counter, MSR_UNCORE_FixedCntr0. The fixed-function uncore counter increments at the
rate of the U-clock when enabled.
The frequency of the uncore clock domain can be determined from the uncore clock ratio which is available in
the PCI configuration space register at offset C0H under device number 0 and Function 0.
22.3.1.2.1 Uncore Performance Monitoring Management Facility
MSR_UNCORE_PERF_GLOBAL_CTRL provides bit fields to enable/disable general-purpose and fixed-function
counters in the uncore. Figure 22-21 shows the layout of MSR_UNCORE_PERF_GLOBAL_CTRL for an uncore that is
shared by four processor cores in a physical package.
• EN_PCn (bit n, n = 0, 7): When set, enables counting for the general-purpose uncore counter MSR_UN-
CORE_PerfCntr n.
Vol. 3B
22-31