Intel 64 and IA-32 Architectures. Software Developer’s Manual (2026) - page 56

INTERPRETING MACHINE CHECK ERROR CODES
Table 19-34. Machine Check Error Codes for IA32_MC4_STATUS (Contd.)
Type
Bit No.
Bit Function
Bit Description
4BH: MCA_SVID_IMON_REQUEST_FAILED
4CH: MCA_SVID_ALERT_REQUEST_FAILED
4DH: MCA_SVID_MCP_VR_RAMP_ERROR
56H: MCA_FIVR_PD_HARDERR
58H: MCA_WATCHDOG_TIMEOUT_PKGC_SECONDARY
59H: MCA_WATCHDOG_TIMEOUT_PKGC_MAIN
5AH: MCA_WATCHDOG_TIMEOUT_PKGS_MAIN
5BH: MCA_WATCHDOG_TIMEOUT_MSG_CH_FSM
5CH: MCA_WATCHDOG_TIMEOUT_BULK_CR_FSM
5DH: MCA_WATCHDOG_TIMEOUT_IOSFSB_FSM
60H: MCA_PKGS_SAFE_WP_TIMEOUT
61H: MCA_PKGS_CPD_UNCPD_TIMEOUT
62H: MCA_PKGS_INVALID_REQ_PCH
63H: MCA_PKGS_INVALID_REQ_INTERNAL
64H: MCA_PKGS_INVALID_RSP_INTERNAL
65H-7AH: MCA_PKGS_RESET_PREP_TIMEOUT
7BH: MCA_PKGS_SMBUS_VPP_PAUSE_TIMEOUT
7CH: MCA_PKGS_SMBUS_MCP_PAUSE_TIMEOUT
7DH: MCA_PKGS_SMBUS_SPD_PAUSE_TIMEOUT
80H: MCA_PKGC_DISP_BUSY_TIMEOUT
81H: MCA_PKGC_INVALID_RSP_PCH
83H: MCA_PKGC_WATCHDOG_HANG_CBZ_DOWN
84H: MCA_PKGC_WATCHDOG_HANG_CBZ_UP
87H: MCA_PKGC_WATCHDOG_HANG_C2_BLKMASTER
88H: MCA_PKGC_WATCHDOG_HANG_C2_PSLIMIT
89H: MCA_PKGC_WATCHDOG_HANG_SETDISP
8BH: MCA_PKGC_ALLOW_L1_ERROR
90H: MCA_RECOVERABLE_DIE_THERMAL_TOO_HOT
A0H: MCA_ADR_SIGNAL_TIMEOUT
A1H: MCA_BCLK_FREQ_OC_ABOVE_THRESHOLD
B0H: MCA_DISPATCHER_RUN_BUSY_TIMEOUT
37:32
ENH_MCA_AVAIL0
Available when Enhanced MCA is in use.
52:38
CORR_ERR_COUNT
Correctable error count.
54:53
CORRERRORSTATUSIND
These bits are used to indicate when the number of corrected errors has
exceeded the safe threshold to the point where an uncorrected error has
become more likely to happen.
Table 3 shows the encoding of these bits.
56:55
ENH_MCA_AVAIL1
Available when Enhanced MCA is in use.
Status Register
63:57
Validity Indicators1
NOTES:
1. These fields are architecturally defined. Refer to Chapter 18, “Machine-Check Architecture,” for more information.
19-30
Vol. 3B

INTERPRETING MACHINE CHECK ERROR CODES
19.11.2 Interconnect Machine Check Errors
MC error codes associated with the link interconnect agents are reported in the IA32_MC5_STATUS,
IA32_MC7_STATUS, and IA32_MC8_STATUS MSRs. The supported error codes follow the architectural MCACOD
definition type 1PPTRRRRIILL; see Chapter 18, “Machine-Check Architecture.”
NOTE
The interconnect machine check errors in this section apply only to the 3rd generation Intel Xeon
Scalable Processor Family with a CPUID DisplayFamily_DisplaySignature of 06_6AH. These do not
apply to the 3rd generation Intel Xeon Scalable Processor Family with a CPUID DisplayFamily_Dis-
playSignature of 06_6CH.
Table 19-35 lists model-specific fields to interpret error codes applicable to IA32_MCi_STATUS, where i= 5, 7, 8.
Table 19-35. Interconnect MC Error Codes for IA32_MCi_STATUS (i = 5, 7, 8)
Type
Bit No.
Bit Function
Bit Description
MCA Error Codes1
15:0
MCACOD
Bus error format: 1PPTRRRRIILL
The two supported compound error codes:
• 0x0C0F: Unsupported/Undefined Packet.
• 0x0E0F: For all other corrected and uncorrected errors.
Model Specific Errors
21:16
MSCOD
The encoding of Uncorrectable (UC) errors are:
00H: Phy Initialization Failure (NumInit).
01H: Phy Detected Drift Buffer Alarm.
02H: Phy Detected Latency Buffer Rollover.
10H: LL Rx detected CRC error: unsuccessful LLR (entered Abort state).
11H: LL Rx Unsupported/Undefined packet.
12H: LL or Phy Control Error.
13H: LL Rx Parameter Exception.
1FH: LL Detected Control Error.
The encoding of correctable (COR) errors are:
20H: Phy Initialization Abort.
21H: Phy Inband Reset.
22H: Phy Lane failure, recovery in x8 width.
23H: Phy L0c error corrected without Phy reset.
24H: Phy L0c error triggering Phy reset.
25H: Phy L0p exit error corrected with reset.
30H: LL Rx detected CRC error: successful LLR without Phy Re-init.
31H: LL Rx detected CRC error: successful LLR with Phy Re-init.
32H: Tx received LLR.
All other values are reserved.
Vol. 3B
19-31

INTERPRETING MACHINE CHECK ERROR CODES
Table 19-35. Interconnect MC Error Codes for IA32_MCi_STATUS (i = 5, 7, 8) (Contd.)
Type
Bit No.
Bit Function
Bit Description
31:22
MSCOD_SPARE
The definition below applies to MSCOD 12h (UC LL or Phy Control Errors).
[Bit 22] : Phy Control Error.
[Bit 23] : Unexpected Retry.Ack flit.
[Bit 24] : Unexpected Retry.Req flit.
[Bit 25] : RF parity error.
[Bit 26] : Routeback Table error.
[Bit 27] : Unexpected Tx Protocol flit (EOP, Header or Data).
[Bit 28] : Rx Header-or-Credit BGF credit overflow/underflow.
[Bit 29] : Link Layer Reset still in progress when Phy enters L0 (Phy
training should not be enabled until after LL reset is complete as indicated
by KTILCL.LinkLayerReset going back to 0).
[Bit 30] : Link Layer reset initiated while protocol traffic not idle.
[Bit 31] : Link Layer Tx Parity Error.
37:32
OTHER_INFO
Other Info.
56:38
Corrected Error Cnt
See Chapter 18, “Machine-Check Architecture.”
Status Register
63:57
Validity Indicators1
NOTES:
1. These fields are architecturally defined. Refer to Chapter 18, “Machine-Check Architecture,” for more information.
19.11.3 Integrated Memory Controller Machine Check Errors
MC error codes associated with integrated memory controllers for the 3rd generation Intel® Xeon® Scalable
Processor Family based on Ice Lake microarchitecture are defined in Table 19-37.
The MSRs reporting MC error codes differ depending on the CPUID DisplayFamily_DisplaySignature of the
processor. See Table 19-36 for details.
Table 19-36. MSRs Reporting MC Error Codes by CPUID DisplayFamily_DisplaySignature
Processor
CPUID
MSRs Reporting MC Error Codes
DisplayFamily_DisplaySignature
3rd generation Intel® Xeon® Scalable Processor
06_6AH
IA32_MC13_STATUS-IA32_MC14_STATUS
Family based on Ice Lake microarchitecture
IA32_MC17_STATUS-IA32_MC18_STATUS
IA32_MC21_STATUS-IA32_MC22_STATUS
IA32_MC25_STATUS-IA32_MC26_STATUS
3rd generation Intel® Xeon® Scalable Processor
06_6CH
IA32_MC13_STATUS-IA32_MC14_STATUS
Family based on Ice Lake microarchitecture
IA32_MC17_STATUS-IA32_MC18_STATUS
19-32
Vol. 3B

INTERPRETING MACHINE CHECK ERROR CODES
The supported error codes follow the architectural MCACOD definition type 1MMMCCCC; see Chapter 18,
“Machine-Check Architecture.”
Table 19-37. Intel IMC MC Error Codes for IA32_MCi_STATUS (i= 13-14, 17-18, 21-22, 25-26)
Type
Bit No.
Bit Function
Bit Description
MCA Error Codes1
15:0
MCACOD
Memory Controller error format: 0000 0000 1MMM CCCC
Model Specific Errors
27:16
Error Codes
0000H: Uncorrectable spare error.
0001H: End to End address parity error.
0002H: Write data parity error.
0003H: End to End uncorrectable/correctable write data ECC error.
0004H: Write byte enable parity error.
0007H: Transaction ID parity error.
0008H: Correctable patrol scrub error.
0010H: Uncorrectable patrol scrub error.
0020H: Correctable spare error.
0080H: Transient or correctable error for demand or underfill reads or
read 2LM metadata error.
00A0H: Uncorrectable error for demand or underfill reads.
0100H: WDB read parity error.
0108H: DDR/DDRT link failure.
0111H: PCLS address CSR parity error.
0112H: PCLS illegal ADDDC configuration error.
0200H: DDR4 command / address parity error.
0400H: RPQ scheduler address parity error.
0800H: 2LM unrecognized request type.
0801H: 2LM read response to an invalid scoreboard entry.
0802H: 2LM unexpected read response.
0803H: 2LM DDR4 completion to an invalid scoreboard entry.
0804H: 2LM DDRT completion to an invalid scoreboard entry.
0805H: 2LM completion FIFO overflow.
0806H: DDRT link parity error.
0807H: DDRT RID uncorrectable error.
0809H: DDRT RID FIFO overflow.
080AH: DDRT error on FNV write credits.
080BH: DDRT error on FNV read credits.
080CH: DDRT scheduler error.
080DH: DDRT FNV error.
080EH: DDRT FNV thermal error.
080FH: DDRT unexpected data packet during CMI idle.
0810H: DDRT RPQ request parity error.
0811H: DDRT WPQ request parity error.
0812H: 2LM NmFillWr CAM multiple hit error.
0813H: CMI credit oversubscription error.
0814H: CMI total credit count error.
0815H: CMI reserved credit pool error.
0816H: DDRT link ECC error.
Vol. 3B
19-33

INTERPRETING MACHINE CHECK ERROR CODES
Table 19-37. Intel IMC MC Error Codes for IA32_MCi_STATUS (i= 13-14, 17-18, 21-22, 25-26) (Contd.)
Type
Bit No.
Bit Function
Bit Description
0817H: WDB FIFO overflow or underflow errors.
0818H: CMI request FIFO overflow error.
0819H: CMI request FIFO underflow error.
081AH: CMI response FIFO overflow error.
081BH: CMI response FIFO underflow error.
081CH: CMI miscellaneous credit errors.
081DH: CMI MC arbiter errors.
081EH: DDRT write completion FIFO overflow error.
081FH: DDRT write completion FIFO underflow error.
0820H: CMI read completion FIFO overflow error.
0821H: CMI read completion FIFO underflow error.
0822H: TME key RF parity error.
0823H: TME miscellaneous CMI errors.
0824H: TME CMI overflow error.
0825H: TME CMI underflow error.
0826H: Intel® SGX TEM secure bit mismatch detected on demand read.
0827H: TME detected underfill read completion data parity error.
0828H: 2LM Scoreboard Overflow Error.
1008H: Correctable patrol scrub error (mirror secondary example).
28
Mirror secondary error.
Mirror secondary error.
31:29
Reserved
Reserved
37:32
Other Info
Other Info.
56:38
See Chapter 18, “Machine-Check Architecture.”
Status Register
63:57
Validity Indicators1
NOTES:
1. These fields are architecturally defined. Refer to Chapter 18, “Machine-Check Architecture,” for more information.
19-34
Vol. 3B

INTERPRETING MACHINE CHECK ERROR CODES
Additional information is reported in the IA32_MC13_MISC-IA32_MC14_MISC, IA32_MC17_MISC- IA32_MC18_-
MISC, IA32_MC21_MISC-IA32_MC22_MISC, and IA32_MC25_MISC-IA32_MC26_MISC MSRs. Table 19-38 lists
the information reported in IA32_MCi_MISC, where i = 13-14, 17-18, 21-22, and 25-26.
Table 19-38. Additional Information Reported in IA32_MCi_MISC (i= 13-14, 17-18, 21-22, 25-26)
Bit No.
Bit Function
Bit Description
5:0
LSB
See Figure 18-8.
8:6
Address Mode
See Table 18-3.
18:9
Column
Component of sub-DIMM address.
Bits 18-17: Reserved.
Bit 16: Column 9.
Bit 15: Column 8.
Bit 14: Column 7.
Bit 13: Column 6.
Bit 12: Column 5.
Bit 11: Column 4.
Bit 10: Column 3.
Bit 9: Reserved.
39:19
Row
Component of sub-DIMM address.
45:40
Bank
Component of sub-DIMM address.
Bit 45: Reserved.
Bit 44: Bank group 2.
Bit 43: Bank address 1.
Bit 42: Bank address 0.
Bit 41: Bank group 1.
Bit 40: Bank group 0.
51:46
Failed Device
Failing device for correctable error (not valid for uncorrectable or transient errors).
55:52
CBit
CBit
58:56
Chip Select
Chip Select
62:59
ECC Mode
0000b: SDDC 2LM.
0001b: SDDC 1LM.
0010b: SDDC + 1 2LM.
0011b: SDDC + 1 1LM.
0100b: ADDDC 2LM.
0101b: ADDDC 1LM.
0110b: ADDDC + 1 2LM.
0111b: ADDDC + 1 1LM.
1000b: Read from DDRT.
1001b: x8 SDDC.
1010b: x8 SDDC + 1.
1011b: Not a valid ECC mode.
Other values: Reserved.
63
Transient
0b:
1b: Error was transient.
Vol. 3B
19-35

INTERPRETING MACHINE CHECK ERROR CODES
19.11.4 M2M Machine Check Errors
MC error codes associated with M2M for the 3rd generation Intel Xeon Scalable Processor Family with a CPUID
DisplayFamily_DisplaySignature of 06_6AH are reported in the IA32_MC12_STATUS, IA32_MC16_STATUS,
IA32_MC20_STATUS, and IA32_MC24_STATUS MSRs.
MC error codes associated with M2M for the 3rd generation Intel Xeon Scalable Processor Family with a CPUID
DisplayFamily_DisplaySignature of 06_6CH are reported in the IA32_MC12_STATUS and IA32_MC16_STATUS
MSRs.
The supported error codes follow the architectural MCACOD definition type 1MMMCCCC; see Chapter 18,
“Machine-Check Architecture.”
Table 19-39. M2M MC Error Codes for IA32_MCi_STATUS (i= 12, 16, 20, 24)
Type
Bit No.
Bit Function
Bit Description
MCA Error Codes1
15:0
MCACOD
Compound error format: 0000 0000 1MMM CCCC
Model Specific Errors
23:16
MSCOD
Logged an MC error.
25:24
MscodDDRType
Logged a DDR/DDRT specific error.
26
MscodFailoverWhileResetPrep
Logged a failover specific error while preparing to reset.
31:27
Reserved
Reserved
37:32
Other Info
Other information.
56:38
See Chapter 18, “Machine-Check Architecture.”
Status Register
63:57
Validity Indicators1
NOTES:
1. These fields are architecturally defined. Refer to Chapter 18, “Machine-Check Architecture,” for more information.
MC error codes associated with mirrored memory corrections are reported in the IA32_MC12_MISC, IA32_MC16_-
MISC, IA32_MC20_MISC, and IA32_MC24_MISC MSRs. The model-specific error codes listed in Table 19-32 also
apply to IA32_MCi_MISC, where i = 12, 16, 20, 24.
19.12 INCREMENTAL DECODING INFORMATION: PROCESSOR FAMILY WITH CPUID
DISPLAYFAMILY_DISPLAYMODEL SIGNATURE 06_86H, MACHINE ERROR
CODES FOR MACHINE CHECK
In Intel Atom® processors based on Tremont microarchitecture with CPUID DisplayFamily_DisplaySignature
06_86H, incremental error codes for internal machine check errors from the PCU controller are reported in the
register bank IA32_MC4. Table 19-34 in Section 19.11.1 lists model-specific fields to interpret error codes appli-
cable to IA32_MC4_STATUS.
19.12.1 Integrated Memory Controller Machine Check Errors
MC error codes associated with integrated memory controllers are reported in the MSRs IA32_MC13_STATUS-
IA32_MC15_STATUS. The supported error codes follow the architectural MCACOD definition type 1MMMCCCC; see
Chapter 18, “Machine-Check Architecture.”
The IA32_MCi_STATUS MSR (where i = 13, 14, 15) contains information related to a machine check error if its
VAL(valid) flag is set. Bit definitions are the same as those found in Table 19-37 “Intel IMC MC Error Codes for
IA32_MCi_STATUS (i= 13-14, 17-18, 21-22, 25-26).”
The IA32_MCi_MISC MSR (where i = 13, 14, 15) contains information related memory corrections. Bit definitions
are the same as those found in Table 19-38 “Additional Information Reported in IA32_MCi_MISC (i= 13-14,
17-18, 21-22, 25-26).”
19-36
Vol. 3B

INTERPRETING MACHINE CHECK ERROR CODES
19.12.2 M2M Machine Check Errors
MC error codes associated with M2M are reported in the IA32_MC12_STATUS MSR. The supported error codes
follow the architectural MCACOD definition type 1MMMCCCC; see Chapter 18, “Machine-Check Architecture.”
Bit definitions are the same as those found in Table 19-39 “M2M MC Error Codes for IA32_MCi_STATUS (i= 12, 16,
20, 24).”
19.13 INCREMENTAL DECODING INFORMATION: 4TH GENERATION INTEL® XEON®
SCALABLE PROCESSOR FAMILY, MACHINE ERROR CODES FOR MACHINE
CHECK
In the 4th generation Intel® Xeon® Scalable Processor Family with CPUID DisplayFamily_DisplaySignature of
06_8FH, incremental error codes for internal machine check errors from the PCU controller are reported in the
register bank IA32_MC4. Table 19-40 in Section 19.13.1 lists model-specific fields to interpret error codes appli-
cable to IA32_MC4_STATUS.
19.13.1 Internal Machine Check Errors
Table 19-40. Machine Check Error Codes for IA32_MC4_STATUS
Type
Bit No.
Bit Function
Bit Description
MCACOD1
15:0
Internal Errors
The value of this field will be 0402H for the PCU and 0406H for internal
firmware errors.
This applies for any logged error.
Model Specific Errors
19:16
Reserved, except for the
Model specific error code bits 19:16.
following
If MACOD = 40CH, MSCOD encoding should be interpreted as:
01H: MCE when CR4.MCE is clear.
02H: MCE when MCIP bit is set.
03H: MCE under WPS.
04H: Unrecoverable error during security flow execution.
05H: Software triple fault shutdown.
06H: VMX-exit-consistency-check failures.
07H: RSM-consistency-check failures.
08H: Invalid conditions on protected mode SMM entry.
09H: Unrecoverable error during security flow execution.
For all other MACOD values, MSCOD logs the type of hardware UC
(PCU/VCU) error that has occurred. There are seven errors defined:
01H: Instruction address out of valid space.
02H: Double bit RAM error on Instruction Fetch.
03H: Invalid OpCode seen.
04H: Stack Underflow.
05H: Stack Overflow.
06H: Data address out of valid space.
07H: Double bit RAM error on Data Fetch.
Vol. 3B
19-37

INTERPRETING MACHINE CHECK ERROR CODES
Table 19-40. Machine Check Error Codes for IA32_MC4_STATUS (Contd.)
Type
Bit No.
Bit Function
Bit Description
23:20
Reserved, except for the
Model specific error code bits 23:20.
following
This logs the type of HW FSM error that has occurred. There are 3 errors
defined:
04H: Clock/power IP response timeout.
05H: SMBus controller raised SMI.
09H: PM controller received invalid transaction.
31:24
Reserved, except for the
0DH: MCA_LLC_BIST_ACTIVE_TIMEOUT
following
0EH: MCA_DMI_TRAINING_TIMEOUT
0FH: MCA_DMI_STRAP_SET_ARRIVAL_TIMEOUT
10H: MCA_DMI_CPU_RESET_ACK_TIMEOUT
11H: MCA_MORE_THAN_ONE_LT_AGENT
14H: MCA_INCOMPATIBLE_PCH_TYPE
1EH: MCA_BIOS_RST_CPL_INVALID_SEQ
1FH: MCA_BIOS_INVALID_PKG_STATE_CONFIG
2DH: MCA_PCU_PMAX_CALIB_ERROR
2EH: MCA_TSC100_SYNC_TIMEOUT
3AH: MCA_GPSB_TIMEOUT
3BH: MCA_PMSB_TIMEOUT
3EH: MCA_IOSFSB_PMREQ_CMP_TIMEOUT
40H: MCA_SVID_VCCIN_VR_ICC_MAX_FAILURE
42H: MCA_SVID_VCCIN_VR_VOUT_FAILURE
43H: MCA_SVID_CPU_VR_CAPABILITY_ERROR
44H: MCA_SVID_CRITICAL_VR_FAILED
45H: MCA_SVID_SA_ITD_ERROR
46H: MCA_SVID_READ_REG_FAILED
47H: MCA_SVID_WRITE_REG_FAILED
4AH: MCA_SVID_PKGC_REQUEST_FAILED
4BH: MCA_SVID_IMON_REQUEST_FAILED
4CH: MCA_SVID_ALERT_REQUEST_FAILED
4DH: MCA_SVID_MCP_VR_RAMP_ERROR
56H: MCA_FIVR_PD_HARDERR
58H: MCA_WATCHDOG_TIMEOUT_PKGC_SECONDARY
59H: MCA_WATCHDOG_TIMEOUT_PKGC_MAIN
5AH: MCA_WATCHDOG_TIMEOUT_PKGS_MAIN
5BH: MCA_WATCHDOG_TIMEOUT_MSG_CH_FSM
5CH: MCA_WATCHDOG_TIMEOUT_BULK_CR_FSM
5DH: MCA_WATCHDOG_TIMEOUT_IOSFSB_FSM
60H: MCA_PKGS_SAFE_WP_TIMEOUT
61H: MCA_PKGS_CPD_UNCPD_TIMEOUT
62H: MCA_PKGS_INVALID_REQ_PCH
63H: MCA_PKGS_INVALID_REQ_INTERNAL
64H: MCA_PKGS_INVALID_RSP_INTERNAL
65H-7AH: MCA_PKGS_RESET_PREP_TIMEOUT
7BH: MCA_PKGS_SMBUS_VPP_PAUSE_TIMEOUT
19-38
Vol. 3B

INTERPRETING MACHINE CHECK ERROR CODES
Table 19-40. Machine Check Error Codes for IA32_MC4_STATUS (Contd.)
Type
Bit No.
Bit Function
Bit Description
7CH: MCA_PKGS_SMBUS_MCP_PAUSE_TIMEOUT
7DH: MCA_PKGS_SMBUS_SPD_PAUSE_TIMEOUT
80H: MCA_PKGC_DISP_BUSY_TIMEOUT
81H: MCA_PKGC_INVALID_RSP_PCH
83H: MCA_PKGC_WATCHDOG_HANG_CBZ_DOWN
84H: MCA_PKGC_WATCHDOG_HANG_CBZ_UP
87H: MCA_PKGC_WATCHDOG_HANG_C2_BLKMASTER
88H: MCA_PKGC_WATCHDOG_HANG_C2_PSLIMIT
89H: MCA_PKGC_WATCHDOG_HANG_SETDISP
8BH: MCA_PKGC_ALLOW_L1_ERROR
90H: MCA_RECOVERABLE_DIE_THERMAL_TOO_HOT
A0H: MCA_ADR_SIGNAL_TIMEOUT
A1H: MCA_BCLK_FREQ_OC_ABOVE_THRESHOLD
B0H: MCA_DISPATCHER_RUN_BUSY_TIMEOUT
C0H: MCA_DISPATCHER_RUN_BUSY_TIMEOUT
37:32
ENH_MCA_AVAIL0
Available when Enhanced MCA is in use.
52:38
CORR_ERR_COUNT
Correctable error count.
54:53
CORRERRORSTATUSIND
These bits are used to indicate when the number of corrected errors has
exceeded the safe threshold to the point where an uncorrected error has
become more likely to happen.
Table 3 shows the encoding of these bits.
56:55
ENH_MCA_AVAIL1
Available when Enhanced MCA is in use.
Status Register
63:57
Validity Indicators1
NOTES:
1. These fields are architecturally defined. Refer to Chapter 18, “Machine-Check Architecture,” for more information.
19.13.2 Interconnect Machine Check Errors
MC error codes associated with the link interconnect agents are reported in the IA32_MC5_STATUS MSR. The
supported error codes follow the architectural MCACOD definition type 1PPTRRRRIILL; see Chapter 18,
“Machine-Check Architecture.”
Table 19-41 lists model-specific fields to interpret error codes applicable to IA32_MC5_STATUS.
Vol. 3B
19-39

INTERPRETING MACHINE CHECK ERROR CODES
Table 19-41. Interconnect MC Error Codes for IA32_MC5_STATUS
Type
Bit No.
Bit Function
Bit Description
MCA Error Codes1
15:0
MCACOD
Bus error format: 1PPTRRRRIILL
The two supported compound error codes:
• 0x0C0F: Unsupported/Undefined Packet.
• 0x0E0F: For all other corrected and uncorrected errors.
Model Specific Errors
21:16
MSCOD
The encoding of Uncorrectable (UC) errors are:
00H: UC Phy Initialization Failure.
01H: UC Phy Detected Drift Buffer Alarm.
02H: UC Phy Detected Latency Buffer Rollover.
10H: UC LL Rx detected CRC error: unsuccessful LLR (entered Abort state).
11H: UC LL Rx Unsupported/Undefined packet.
12H: UC LL or Phy Control Error.
13H: UC LL Rx Parameter Exception.
15H: UC LL Rx SGX MAC Error.
1FH: UC LL Detected Control Error.
The encoding of correctable (COR) errors are:
20H: COR Phy Initialization Abort.
21H: COR Phy Inband Reset.
22H: COR Phy Lane failure, recovery in x8 width.
23H: COR Phy L0c error corrected without Phy reset.
24H: COR Phy L0c error triggering Phy reset.
25H: COR Phy L0p exit error corrected with reset.
30H: COR LL Rx detected CRC error: successful LLR without Phy Re-init.
31H: COR LL Rx detected CRC error: successful LLR with Phy Re-init.
All other values are reserved.
31:22
MSCOD_SPARE
The definition below applies to MSCOD 12H (UC LL or Phy Control Errors).
[Bit 22]: Phy Control Error.
[Bit 23]: Unexpected Retry.Ack flit.
[Bit 24]: Unexpected Retry.Req flit.
[Bit 25]: RF parity error.
[Bit 26]: Routeback Table error.
[Bit 27]: Unexpected Tx Protocol flit (EOP, Header, or Data).
[Bit 28]: Rx Header-or-Credit BGF credit overflow/underflow.
[Bit 29]: Link Layer Reset still in progress when Phy enters L0 (Phy
training should not be enabled until after LL reset is complete as indicated
by KTILCL.LinkLayerReset going back to 0).
[Bit 30]: Link Layer reset initiated while protocol traffic not idle.
[Bit 31]: Link Layer Tx Parity Error.
37:32
OTHER_INFO
Other Info.
56:38
Corrected Error Cnt
See Chapter 18, “Machine-Check Architecture.”
Status Register
63:57
Validity Indicators1
NOTES:
1. These fields are architecturally defined. Refer to Chapter 18, “Machine-Check Architecture,” for more information.
19-40
Vol. 3B

INTERPRETING MACHINE CHECK ERROR CODES
19.13.3 Integrated Memory Controller Machine Check Errors
MC error codes associated with integrated memory controllers for the 4th generation Intel® Xeon® Scalable
Processor Family based on Sapphire Rapids microarchitecture are reported in the IA32_MC13_STATUS-
IA32_MC20_STATUS MSRs.
The supported error codes follow the architectural MCACOD definition type 1MMMCCCC; see Chapter 18,
“Machine-Check Architecture.”
Table 19-42. Intel IMC MC Error Codes for IA32_MCi_STATUS (i= 13-20)
Type
Bit No.
Bit Function
Bit Description
MCA Error Codes1
15:0
MCACOD
Memory Controller error format: 0000 0000 1MMM CCCC
Model Specific Errors
31:16
Reserved, except for the
0001H: Address parity error.
following
0002H: Data parity error.
0003H: Data ECC error.
0004H: Data byte enable parity error.
0007H: Transaction ID parity error.
0008H: Corrected patrol scrub error.
0010H: Uncorrected patrol scrub error.
0020H: Corrected spare error.
0040H: Uncorrected spare error.
0080H: Corrected read error.
00A0H: Uncorrected read error.
00C0H: Uncorrected metadata.
0100H: WDB read parity error.
0108H: DDR link failure.
0200H: DDR5 command / address parity error.
0400H: RPQ0 parity (primary) error.
0800H: DDR-T bad request.
0801H: DDR Data response to an invalid entry.
0802H: DDR data response to an entry not expecting data.
0803H: DDR5 completion to an invalid entry.
0804H: DDR-T completion to an invalid entry.
0805H: DDR data/completion FIFO overflow.
0806H: DDR-T ERID correctable parity error.
0807H: DDR-T ERID uncorrectable error.
0808H: DDR-T interrupt received while outstanding interrupt was not
ACKed.
0809H: ERID FIFO overflow.
080AH: DDR-T error on FNV write credits.
080BH: DDR-T error on FNV read credits.
080CH: DDR-T scheduler error.
080DH: DDR-T FNV error event.
080EH: DDR-T FNV thermal event.
080FH: CMI packet while idle.
0810H: DDR_T_RPQ_REQ_PARITY_ERR.
0811H: DDR_T_WPQ_REQ_PARITY_ERR.
0812H: 2LM_NMFILLWR_CAM_ERR.
Vol. 3B
19-41

INTERPRETING MACHINE CHECK ERROR CODES
Table 19-42. Intel IMC MC Error Codes for IA32_MCi_STATUS (i= 13-20)
Type
Bit No.
Bit Function
Bit Description
0813H: CMI_CREDIT_OVERSUB_ERR.
0814H: CMI_CREDIT_TOTAL_ERR.
0815H: CMI_CREDIT_RSVD_POOL_ERR.
0816H: DDR_T_RD_ERROR.
0817H: WDB_FIFO_ERR.
0818H: CMI_REQ_FIFO_OVERFLOW.
0819H: CMI_REQ_FIFO_UNDERFLOW.
081AH: CMI_RSP_FIFO_OVERFLOW.
081BH: CMI_RSP_FIFO_UNDERFLOW.
081CH: CMI_MISC_MC_CRDT_ERRORS.
081DH: CMI_MISC_MC_ARB_ERRORS.
081EH: DDR_T_WR_CMPL_FIFO_OVERFLOW.
081FH: DDR_T_WR_CMPL_FIFO_UNDERFLOW.
0820H: CMI_RD_CPL_FIFO_OVERFLOW.
0821H: CMI_RD_CPL_FIFO_UNDERFLOW.
0822H: TME_KEY_PAR_ERR.
0823H: TME_CMI_MISC_ERR.
0824H: TME_CMI_OVFL_ERR.
0825H: TME_CMI_UFL_ERR.
0826H: TME_TEM_SECURE_ERR.
0827H: TME_UFILL_PAR_ERR.
0829H: INTERNAL_ERR.
082AH: TME_INTEGRITY_ERR.
082BH: TME_TDX_ERR
082CH: TME_UFILL_TEM_SECURE_ERR.
082DH: TME_KEY_POISON_ERR.
082EH: TME_SECURITY_ENGINE_ERR.
1008H: CORR_PATSCRUB_MIRR2ND_ERR.
1010H: UC_PATSCRUB_MIRR2ND_ERR.
1020H: COR_SPARE_MIRR2ND_ERR.
1040H: UC_SPARE_MIRR2ND_ERR.
1080H: HA_RD_MIRR2ND_ERR.
10A0H: HA_UNCORR_RD_MIRR2ND_ERR.
37:32
Other Info
Other Info.
56:38
See Chapter 18, “Machine-Check Architecture.”
Status Register
63:57
Validity Indicators1
NOTES:
1. These fields are architecturally defined. Refer to Chapter 18, “Machine-Check Architecture,” for more information.
Additional information is reported in the IA32_MC13_MISC-IA32_MC20_MISC MSRs. Table 19-43 lists the infor-
mation reported in IA32_MCi_MISC, where i = 13-20.
19-42
Vol. 3B

INTERPRETING MACHINE CHECK ERROR CODES
Table 19-43. Additional Information Reported in IA32_MCi_MISC (i= 13-20)
Bit No.
Bit Function
Bit Description
5:0
LSB
See Figure 18-8.
8:6
Address Mode
See Table 18-3.
18:9
Column
Column address for the last retry. To get the real column address from this field, shift the
value left by 2.
36:19
Row
Component of sub-DIMM address.
42:37
Bank ID
Component of sub-DIMM address.
Bit 42: Reserved.
Bit 41: Bank group 2.
Bit 40: Bank address 1.
Bit 39: Bank address 0.
Bit 38: Bank group 1.
Bit 37: Bank group 0.
48:43
Failed Device
Failing device for correctable error (not valid for uncorrectable or transient errors).
50:49
Reserved
Reserved
55:51
Failed Device Number
In HBM mode, holds the failed device number for upper 32 bytes.
55:52
CBit
In DDR mode, bits 54-52: sub_rank[2:0]; bit 55: reserved.
58:56
Chip Select
Chip Select
62:59
ECC Mode
0000b: SDDC 2LM.
0001b: SDDC 1LM.
0010b: SDDC + 1 2LM.
0011b: SDDC + 1 1LM.
0100b: ADDDC 2LM.
0101b: ADDDC 1LM.
0110b: ADDDC + 1 2LM.
0111b: ADDDC + 1 1LM.
1000b: Read from DDRT.
1011b: Not a valid ECC mode.
For HBM mode:
0001b: 64B read.
1001b: 32B read.
Other values: Reserved.
63
Transient
Indicates if the error was a transient error. A transient error is only indicated for demand
reads, underfill reads, and patrol. If there was a WDBParity Error, this field indicates the WDB
ID bit 6.
19.13.4 M2M Machine Check Errors
MC error codes associated with M2M for the 4th generation Intel Xeon Scalable Processor Family with a CPUID
DisplayFamily_DisplaySignature of 06_8FH are reported in the IA32_MC12_STATUS MSR.
The supported error codes follow the architectural MCACOD definition type 1MMMCCCC; see Chapter 18,
“Machine-Check Architecture.”
Vol. 3B
19-43

INTERPRETING MACHINE CHECK ERROR CODES
Table 19-44. M2M MC Error Codes for IA32_MC12_STATUS
Type
Bit No.
Bit Function
Bit Description
MCA Error Codes1
15:0
MCACOD
Compound error format: 0000 0000 1MMM CCCC
Model Specific Errors
23:16
MscodDataRdErr
00H: No error (default).
01H: Read ECC error (MemSpecRd; MemRd; MemRdData; MemRdXto*;
MemInv; MemInvXto*; MemInvItoX).
02H: Bucket1 error.
03H: RdTrkr Parity error.
05H: Prefetch channel mismatch.
07H: Read completion parity error.
08H: Response parity error.
09H: Timeout error.
0AH: CMI reserved credit pool error.
0BH: CMI total credit count error.
0CH: CMI credit oversubscription error.
25:24
MscodDDRType
00: Not logged, whether error on DDR4 or DDRT.
01: HBM errors.
31:26
Reserved
Reserved
37:32
Other Info
Other Info.
56:38
See Chapter 18, “Machine-Check Architecture.”
Status Register
63:57
Validity Indicators1
NOTES:
1. These fields are architecturally defined. Refer to Chapter 18, “Machine-Check Architecture,” for more information.
19.13.5 High Bandwidth Memory Machine Check Errors
MC error codes associated with high bandwidth memory for the 4th generation Intel Xeon Scalable Processor
Family are reported in the IA32_MC29_STATUS-IA32_MC31_STATUS MSRs.
19.14 INCREMENTAL DECODING INFORMATION: PROCESSOR FAMILY 0FH,
MACHINE ERROR CODES FOR MACHINE CHECK
Table 19-45 provides information for interpreting additional family 0FH model-specific fields for external bus errors.
These errors are reported in the IA32_MCi_STATUS MSRs. They are reported architecturally as compound errors
with a general form of 0000 1PPT RRRR IILL in the MCA error code field. See Chapter 18 for information on the
interpretation of compound error codes.
19-44
Vol. 3B

INTERPRETING MACHINE CHECK ERROR CODES
Table 19-45. Incremental Decoding Information: Processor Family 0FH, Machine Error Codes for Machine Check
Type
Bit No.
Bit Function
Bit Description
MCA Error
15:0
Codes1
Model-Specific
16
FSB Address Parity
Address parity error detected:
Error Codes
1: Address parity error detected.
0: No address parity error.
17
Response Hard Fail
Hardware failure detected on response.
18
Response Parity
Parity error detected on response.
19
PIC and FSB Data Parity
Data Parity detected on either PIC or FSB access.
20
Processor Signature =
Processor Signature = 00000F04H:
00000F04H:
Indicates error due to an invalid PIC request access was made to PIC space
Invalid PIC Request
with WB memory):
1: Invalid PIC request error.
0: No Invalid PIC request error.
All other processors:
Reserved
Reserved
21
Pad State Machine
The state machine that tracks P and N data-strobe relative timing has
become unsynchronized or a glitch has been detected.
22
Pad Strobe Glitch
Data strobe glitch.
23
Pad Address Glitch
Address strobe glitch.
Other
56:24
Reserved
Reserved
Information
Status
63:57
Register
Validity
Indicators1
NOTES:
1. These fields are architecturally defined. Refer to Chapter 18, “Machine-Check Architecture,” for more information.
Table 19-10 provides information on interpreting additional family 0FH model specific fields for cache hierarchy
errors. These errors are reported in one of the IA32_MCi_STATUS MSRs. These errors are reported, architecturally,
as compound errors with a general form of 0000 0001 RRRR TTLL in the MCA error code field. See Chapter 18 for
how to interpret the compound error code.
19.14.1 Model-Specific Machine Check Error Codes for the Intel® Xeon® Processor MP 7100
Series
The Intel Xeon processor MP 7100 series has five register banks which contain information related to Machine
Check Errors. MCi_STATUS[63:0] refers to all five register banks. MC0_STATUS[63:0] through
MC3_STATUS[63:0] is the same as previous generations of Intel Xeon processors within Family 0FH.
MC4_STATUS[63:0] is the main error logging for the processor’s L3 and front side bus errors. It supports the L3
Errors, Bus and Interconnect Errors Compound Error Codes in the MCA Error Code Field.
Vol. 3B
19-45

INTERPRETING MACHINE CHECK ERROR CODES
Table 19-46. MCi_STATUS Register Bit Definition
Bit Field Name
Bits
Description
MCA_Error_Code
15:0
This field specifies the machine check architecture defined error code for the machine check error
condition detected. The machine check architecture defined error codes are guaranteed to be the same
for all Intel Architecture processors that implement the machine check architecture. See tables below.
Model_Specific_E
31:16
This field specifies the model specific error code that uniquely identifies the machine check error
rror_Code
condition detected. The model specific error codes may differ among Intel Architecture processors for
the same Machine Check Error condition. See tables below.
Other_Info
56:32
The functions of the bits in this field are implementation specific and are not part of the machine check
architecture. Software that is intended to be portable among Intel Architecture processors should not
rely on the values in this field.
PCC
57
The Processor Context Corrupt flag indicates that the state of the processor might have been corrupted
by the error condition detected and that reliable restarting of the processor may not be possible. When
clear, this flag indicates that the error did not affect the processor's state. This bit will always be set for
MC errors, which are not corrected.
ADDRV
58
The MC_ADDR register valid flag indicates that the MC_ADDR register contains the address where the
error occurred. When clear, this flag indicates that the MC_ADDR register does not contain the address
where the error occurred. The MC_ADDR register should not be read if the ADDRV bit is clear.
MISCV
59
The MC_MISC register valid flag indicates that the MC_MISC register contains additional
information regarding the error. When clear, this flag indicates that the MC_MISC register does not
contain additional information regarding the error. MC_MISC should not be read if the MISCV bit is not
set.
EN
60
The error enabled flag indicates that reporting of the machine check exception for this error was
enabled by the associated flag bit of the MC_CTL register. Note that correctable errors do not have
associated enable bits in the MC_CTL register so the EN bit should be clear when a correctable error is
logged.
UC
61
The error uncorrected flag indicates that the processor did not correct the error condition. When clear,
this flag indicates that the processor was able to correct the event condition.
OVER
62
The machine check overflow flag indicates that a machine check error occurred while the results of a
previous error were still in the register bank (i.e., the VAL bit was already set in the
MC_STATUS register). The processor sets the OVER flag and software is responsible for clearing it.
Enabled errors are written over disabled errors, and uncorrected errors are written over corrected
events. Uncorrected errors are not written over previous valid uncorrected errors.
VAL
63
The MC_STATUS register valid flag indicates that the information within the MC_STATUS register is valid.
When this flag is set, the processor follows the rules given for the OVER flag in the MC_STATUS register
when overwriting previously valid entries. The processor sets the VAL flag and software is responsible
for clearing it.
19.14.1.1 Processor Machine Check Status Register MCA Error Code Definition
The Intel Xeon processor MP 7100 series uses compound MCA Error Codes for logging its CBC internal machine
check errors, L3 Errors, and Bus/Interconnect Errors. It defines additional Machine Check error types
(IA32_MC4_STATUS[15:0]) beyond those defined in Chapter 18. Table 19-47 lists these model-specific MCA error
codes. Error code details are specified in MC4_STATUS [31:16]; see Section 19.14.3, the “Model Specific Error
Code” field. The information in the “Other_Info” field (MC4_STATUS[56:32]) is common to the three processor
error types and contains a correctable event count and specifies the MC4_MISC register format.
19-46
Vol. 3B

INTERPRETING MACHINE CHECK ERROR CODES
Table 19-47. Incremental MCA Error Code for Intel® Xeon® Processor MP 7100
Processor MCA_Error_Code (MC4_STATUS[15:0])
Type
Error Code
Binary Encoding
Meaning
C
Internal Error
0000 0100 0000 0000
Internal Error Type Code.
A
L3 Tag Error
0000 0001 0000 1011
L3 Tag Error Type Code.
B
Bus and
0000 100x 0000 1111
Not used, but this encoding is reserved for compatibility with other MCA
Interconnect Error
implementations.
0000 101x 0000 1111
Not used, but this encoding is reserved for compatibility with other MCA
implementations.
0000 110x 0000 1111
Not used, but this encoding is reserved for compatibility with other MCA
implementations.
0000 1110 0000 1111
Bus and Interconnection Error Type Code.
0000 1111 0000 1111
Not used, but this encoding is reserved for compatibility with other MCA
implementations.
The bold faced binary encodings are the only encodings used by the processor for MC4_STATUS[15:0].
19.14.2 Other_Info Field (All MCA Error Types)
The MC4_STATUS[56:32] field is common to the processor's three MCA error types (A, B, and C).
Table 19-48. Other Information Field Bit Definition
Bit Field Name
Bits
Description
39:32
8-bit Correctable
This field holds a count of the number of correctable events since cold reset. This is a saturating
Event Count
counter; the counter begins at 1 (with the first error) and saturates at a count of 255.
41:40
MC4_MISC
The value in this field specifies the format of information in the MC4_MISC register. Currently,
Format Type
only two values are defined. Valid only when MISCV is asserted.
43:42
Reserved
Reserved
51:44
ECC Syndrome
ECC syndrome value for a correctable ECC event when the “Valid ECC syndrome” bit is asserted.
52
Valid ECC
Set when a correctable ECC event supplies the ECC syndrome.
Syndrome
54:53
Threshold-Based
00: No tracking. No hardware status tracking is provided for the structure reporting this event.
Error Status
01: Green. Status tracking is provided for the structure posting the event; the current status is
green (below threshold).
10: Yellow. Status tracking is provided for the structure posting the event; the current status is
yellow (above threshold).
11: Reserved for future use.
Valid only if the Valid bit (bit 63) is set.
Undefined if the UC bit (bit 61) is set.
56:55
Reserved
Reserved
Vol. 3B
19-47

INTERPRETING MACHINE CHECK ERROR CODES
19.14.3 Processor Model Specific Error Code Field
19.14.3.1 MCA Error Type A: L3 Error
Note:
The Model Specific Error Code field in MC4_STATUS (bits 31:16).
Table 19-49. Type A: L3 Error Codes
Bit Num
Sub-Field
Description
Legal Value(s)
Name
18:16
L3 Error
Describes the L3
000: No error.
Code
error
001: More than one way reporting a correctable event.
encountered
010: More than one way reporting an uncorrectable error.
011: More than one way reporting a tag hit.
100: No error.
101: One way reporting a correctable event.
110: One way reporting an uncorrectable error.
111: One or more ways reporting a correctable event while one or more ways are
reporting an uncorrectable error.
20:19
---
Reserved
00
31:21
---
Fixed pattern
0010_0000_000
19.14.3.2 Processor Model Specific Error Code Field Type B: Bus and Interconnect Error
Note:
The Model Specific Error Code field in MC4_STATUS (bits 31:16).
Table 19-50. Type B: Bus and Interconnect Error Codes
Bit Num
Sub-Field Name
Description
16
FSB Request Parity
Parity error detected during FSB request phase.
17
Core0 Addr Parity
Parity error detected on Core 0 request’s address field.
18
Core1 Addr Parity
Parity error detected on Core 1 request’s address field.
19
Reserved
Reserved
20
FSB Response Parity
Parity error on FSB response field detected.
21
FSB Data Parity
FSB data parity error on inbound data detected.
22
Core0 Data Parity
Data parity error on data received from Core 0 detected.
23
Core1 Data Parity
Data parity error on data received from Core 1 detected.
24
IDS Parity
Detected an Enhanced Defer parity error (phase A or phase B).
25
FSB Inbound Data ECC
Data ECC event to error on inbound data (correctable or uncorrectable).
26
FSB Data Glitch
Pad logic detected a data strobe ‘glitch’ (or sequencing error).
27
FSB Address Glitch
Pad logic detected a request strobe ‘glitch’ (or sequencing error).
31:28
Reserved
Reserved
19-48
Vol. 3B

INTERPRETING MACHINE CHECK ERROR CODES
Exactly one of the bits defined in the preceding table will be set for a Bus and Interconnect Error. The Data ECC can
be correctable or uncorrectable; the MC4_STATUS.UC bit distinguishes between correctable and uncorrectable
cases with the Other_Info field possibly providing the ECC Syndrome for correctable errors. All other errors for this
processor MCA Error Type are uncorrectable.
19.14.3.3 Processor Model Specific Error Code Field Type C: Cache Bus Controller Error
Table 19-51. Type C: Cache Bus Controller Error Codes
MC4_STATUS[31:16] (MSCE) Value
Error Description
0000_0000_0000_0001 0001H
Inclusion Error from Core 0.
0000_0000_0000_0010 0002H
Inclusion Error from Core 1.
0000_0000_0000_0011 0003H
Write Exclusive Error from Core 0.
0000_0000_0000_0100 0004H
Write Exclusive Error from Core 1.
0000_0000_0000_0101 0005H
Inclusion Error from FSB.
0000_0000_0000_0110 0006H
SNP Stall Error from FSB.
0000_0000_0000_0111 0007H
Write Stall Error from FSB.
0000_0000_0000_1000 0008H
FSB Arb Timeout Error.
0000_0000_0000_1001 0009H
CBC OOD Queue Underflow/overflow.
0000_0001_0000_0000 0100H
Enhanced Intel SpeedStep Technology TM1-TM2 Error.
0000_0010_0000_0000 0200H
Internal Timeout Error.
0000_0011_0000_0000 0300H
Internal Timeout Error.
0000_0100_0000_0000 0400H
Intel® Cache Safe Technology Queue Full Error or Disabled-ways-in-a-set overflow.
1100_0000_0000_0001 C001H
Correctable ECC event on outgoing FSB data.
1100_0000_0000_0010 C002H
Correctable ECC event on outgoing Core 0 data.
1100_0000_0000_0100 C004H
Correctable ECC event on outgoing Core 1 data.
1110_0000_0000_0001 E001H
Uncorrectable ECC error on outgoing FSB data.
1110_0000_0000_0010 E002H
Uncorrectable ECC error on outgoing Core 0 data.
1110_0000_0000_0100 E004H
Uncorrectable ECC error on outgoing Core 1 data.
- All other encodings -
Reserved
All errors, except for the correctable ECC types, in this table are uncorrectable. The correctable ECC events may
supply the ECC syndrome in the Other_Info field of the MC4_STATUS MSR.
Vol. 3B
19-49

INTERPRETING MACHINE CHECK ERROR CODES
Table 19-52. Decoding Family 0FH Machine Check Codes for Cache Hierarchy Errors
Type
Bit No.
Bit Function
Bit Description
MCA error
15:0
codes1
Model
17:16
Tag Error Code
Contains the tag error code for this machine check error:
Specific Error
00: No error detected.
Codes
01: Parity error on tag miss with a clean line.
10: Parity error/multiple tag match on tag hit.
11: Parity error/multiple tag match on tag miss.
19:18
Data Error Code
Contains the data error code for this machine check error:
00: No error detected.
01: Single bit error.
10: Double bit error on a clean line.
11: Double bit error on a modified line.
20
L3 Error
This bit is set if the machine check error originated in the L3 (it can be ignored for
invalid PIC request errors):
1: L3 error.
0: L2 error.
21
Invalid PIC Request
Indicates error due to invalid PIC request access was made to PIC space with WB
memory:
1: Invalid PIC request error.
0: No invalid PIC request error.
31:22
Reserved
Reserved
Other
39:32
8-bit Error Count
Holds a count of the number of errors since reset. The counter begins at 0 for the first
Information
error and saturates at a count of 255.
56:40
Reserved
Reserved
Status
63:57
Register
Validity
Indicators1
NOTES:
1. These fields are architecturally defined. Refer to Chapter 18, “Machine-Check Architecture,” for more information.
19-50
Vol. 3B
CHAPTER 20
DEBUG, BRANCH PROFILE, TSC, AND INTEL® RESOURCE DIRECTOR
TECHNOLOGY (INTEL® RDT) FEATURES
NOTE
This chapter makes numerous references to last-branch recording (LBR) facilities. Unless noted
otherwise, all such references in this chapter are to an earlier non-architectural form of the feature.
Chapter 21 defines an architectural form of last-branch recording that is supported on newer
processors.
Intel 64 and IA-32 architectures provide debug facilities for use in debugging code and monitoring performance.
These facilities are valuable for debugging application software, system software, and multitasking operating
systems. Debug support is accessed using debug registers (DR0 through DR7) and model-specific registers
(MSRs):
• Debug registers hold the addresses of memory and I/O locations called breakpoints. Breakpoints are user-
selected locations in a program, a data-storage area in memory, or specific I/O ports. They are set where a
programmer or system designer wishes to halt execution of a program and examine the state of the processor
by invoking debugger software. A debug exception (#DB) is generated when a memory or I/O access is made
to a breakpoint address.
• MSRs monitor branches, interrupts, and exceptions; they record addresses of the last branch, interrupt or
exception taken and the last branch taken before an interrupt or exception.
• Time stamp counter is described in Section 20.17, “Time-Stamp Counter.”
• Features that allow monitoring of shared platform resources such as the L3 cache are described in Section
20.18, “Intel® Resource Director Technology (Intel® RDT) Monitoring Features.”
• Features that enable control over shared platform resources are described in Section 20.19, “Intel® Resource
Director Technology (Intel® RDT) Allocation Features.”
• Features that enable control over shared platform resources for non-CPU agents are described in Section
20.20, “Intel® Resource Director Technology (Intel® RDT) for Non-CPU Agents.”1
20.1
OVERVIEW OF DEBUG SUPPORT FACILITIES
The following processor facilities support debugging and performance monitoring:
• Debug exception (#DB) - Transfers program control to a debug procedure or task when a debug event
occurs.
• Breakpoint exception (#BP) - See breakpoint instruction (INT3) below.
• Breakpoint-address registers (DR0 through DR3) - Specifies the addresses of up to 4 breakpoints.
• Debug status register (DR6) - Reports the conditions that were in effect when a debug or breakpoint
exception was generated.
• Debug control register (DR7) - Specifies the forms of memory or I/O access that cause breakpoints to be
generated.
• T (trap) flag, TSS - Generates a debug exception (#DB) when an attempt is made to switch to a task with
the T flag set in its TSS.
• RF (resume) flag, EFLAGS register - Suppresses multiple exceptions to the same instruction.
• TF (trap) flag, EFLAGS register - Generates a debug exception (#DB) after every execution of an
instruction.
1. Additional information about Intel® RDT can be found in the document titled “Intel® Resource Director Technology Architecture Spec-
ification,” available here: https://www.intel.com/content/www/us/en/developer/articles/technical/intel-sdm.html.
Vol. 3B
20-1
DEBUG, BRANCH PROFILE, TSC, AND INTEL® RESOURCE DIRECTOR TECHNOLOGY (INTEL® RDT) FEATURES
• Breakpoint instruction (INT3) - Generates a breakpoint exception (#BP) that transfers program control to
the debugger procedure or task. This instruction is an alternative way to set instruction breakpoints. It is
especially useful when more than four breakpoints are desired, or when breakpoints are being placed in the
source code.
• Last branch recording facilities - Store branch records in the last branch record (LBR) stack MSRs for the
most recent taken branches, interrupts, and/or exceptions in MSRs. A branch record consist of a branch-from
and a branch-to instruction address. Send branch records out on the system bus as branch trace messages
(BTMs).
These facilities allow a debugger to be called as a separate task or as a procedure in the context of the current
program or task. The following conditions can be used to invoke the debugger:
• Task switch to a specific task.
• Execution of the breakpoint instruction.
• Execution of any instruction.
• Execution of an instruction at a specified address.
• Read or write to a specified memory address/range.
• Write to a specified memory address/range.
• Input from a specified I/O address/range.
• Output to a specified I/O address/range.
• Attempt to change the contents of a debug register.
20.2
DEBUG REGISTERS
Eight debug registers (see Figure 20-1 for 32-bit operation and Figure 20-2 for 64-bit operation) control the debug
operation of the processor. These registers can be written to and read using the move to/from debug register form
of the MOV instruction. A debug register may be the source or destination operand for one of these instructions.
20-2
Vol. 3B

DEBUG, BRANCH PROFILE, TSC, AND INTEL® RESOURCE DIRECTOR TECHNOLOGY (INTEL® RDT) FEATURES
31
30
29
28
27
26
25
24
23
22
21
20
19
18
17
16
15
14
13
12
11
10
9
8
7
6
5
4
3
2
1
0
R
LEN
R/W
LEN
R/W
LEN
R/W
LEN
R/W
G
G
L
G
L
G
L
G
L
G
L
0 0
0
T
1
DR7
3
3
2
2
1
1
0
0
D
E
E
3
3
2
2
1
1
0
0
M
31
16
15
14
13
12
11
10
9
8
7
6
5
4
3
2
1
0
R
B
Reserved (set to 1)
T
B
B
B
0
L
1
1
1
1
1
1
1
B
B
B
B
DR6
T
S
D
3
2
1
0
M
D
31
0
DR5
31
0
DR4
31
0
Breakpoint 3 Linear Address
DR3
31
0
Breakpoint 2 Linear Address
DR2
31
0
Breakpoint 1 Linear Address
DR1
31
0
Breakpoint 0 Linear Address
DR0
Reserved
Figure 20-1. Debug Registers
Debug registers are privileged resources; a MOV instruction that accesses these registers can only be executed in
real-address mode, in SMM or in protected mode at a CPL of 0. An attempt to read or write the debug registers
from any other privilege level generates a general-protection exception (#GP).
The primary function of the debug registers is to set up and monitor from 1 to 4 breakpoints, numbered 0 though
3. For each breakpoint, the following information can be specified:
• The linear address where the breakpoint is to occur.
• The length of the breakpoint location: 1, 2, 4, or 8 bytes (refer to the notes in Section 20.2.4).
• The operation that must be performed at the address for a debug exception to be generated.
• Whether the breakpoint is enabled.
• Whether the breakpoint condition was present when the debug exception was generated.
The following paragraphs describe the functions of flags and fields in the debug registers.
Vol. 3B
20-3
DEBUG, BRANCH PROFILE, TSC, AND INTEL® RESOURCE DIRECTOR TECHNOLOGY (INTEL® RDT) FEATURES
20.2.1 Debug Address Registers (DR0-DR3)
Each of the debug-address registers (DR0 through DR3) holds the 32-bit linear address of a breakpoint (see
Figure 20-1). Breakpoint comparisons are made before physical address translation occurs. The contents of debug
register DR7 further specifies breakpoint conditions.
20.2.2 Debug Registers DR4 and DR5
Debug registers DR4 and DR5 are reserved when debug extensions are enabled (when the DE flag in control
register CR4 is set) and attempts to reference the DR4 and DR5 registers cause invalid-opcode exceptions (#UD).
When debug extensions are not enabled (when the DE flag is clear), these registers are aliased to debug registers
DR6 and DR7.
20.2.3 Debug Status Register (DR6)
The debug status register (DR6) reports debug conditions that were sampled at the time the last debug exception
was generated (see Figure 20-1). Updates to this register only occur when an exception is generated. The flags in
this register show the following information:
• B0 through B3 (breakpoint condition detected) flags (bits 0 through 3) - Indicates (when set) that its
associated breakpoint condition was met when a debug exception was generated. These flags are set if the
condition described for each breakpoint by the LENn, and R/Wn flags in debug control register DR7 is true. They
may or may not be set if the breakpoint is not enabled by the Ln or the Gn flags in register DR7. Therefore on
a #DB, a debug handler should check only those B0-B3 bits which correspond to an enabled breakpoint.
• BLD (bus-lock detected) flag (bit 11) - Indicates (when clear) that the debug exception was triggered by
the assertion of a bus lock when CPL > 0 and OS bus-lock detection was enabled (see Section 20.3.1.6). Other
debug exceptions do not modify this bit. To avoid confusion in identifying debug exceptions, software debug-
exception handlers should set bit 11 to 1 before returning. (Software that never enables OS bus-lock detection
need not do this as DR6[11] = 1 following reset.) This bit is always 1 if the processor does not support OS bus-
lock detection.
• BD (debug register access detected) flag (bit 13) - Indicates that the next instruction in the instruction
stream accesses one of the debug registers (DR0 through DR7). This flag is enabled when the GD (general
detect) flag in debug control register DR7 is set. See Section 20.2.4, “Debug Control Register (DR7),” for
further explanation of the purpose of this flag.
• BS (single step) flag (bit 14) - Indicates (when set) that the debug exception was triggered by the single-
step execution mode (enabled with the TF flag in the EFLAGS register). The single-step mode is the highest-
priority debug exception. When the BS flag is set, any of the other debug status bits also may be set.
• BT (task switch) flag (bit 15) - Indicates (when set) that the debug exception resulted from a task switch
where the T flag (debug trap flag) in the TSS of the target task was set. See Section 10.2.1, “Task-State
Segment (TSS),” for the format of a TSS. There is no flag in debug control register DR7 to enable or disable this
exception; the T flag of the TSS is the only enabling flag.
• RTM (restricted transactional memory) flag (bit 16) - Indicates (when clear) that a debug exception
(#DB) or breakpoint exception (#BP) occurred inside an RTM region while advanced debugging of RTM trans-
actional regions was enabled (see Section 20.3.3). This bit is set for any other debug exception (including all
those that occur when advanced debugging of RTM transactional regions is not enabled). This bit is always 1 if
the processor does not support RTM.
Certain debug exceptions may clear bits 0-3. The remaining contents of the DR6 register are never cleared by the
processor. To avoid confusion in identifying debug exceptions, debug handlers should clear the register (except
bit 16, which they should set) before returning to the interrupted task.
20.2.4 Debug Control Register (DR7)
The debug control register (DR7) enables or disables breakpoints and sets breakpoint conditions (see Figure 20-1).
The flags and fields in this register control the following things:
20-4
Vol. 3B
DEBUG, BRANCH PROFILE, TSC, AND INTEL® RESOURCE DIRECTOR TECHNOLOGY (INTEL® RDT) FEATURES
•
L0 through L3 (local breakpoint enable) flags (bits 0, 2, 4, and 6) - Enables (when set) the breakpoint
condition for the associated breakpoint for the current task. When a breakpoint condition is detected and its
associated Ln flag is set, a debug exception is generated. The processor automatically clears these flags on
every task switch to avoid unwanted breakpoint conditions in the new task.
•
G0 through G3 (global breakpoint enable) flags (bits 1, 3, 5, and 7) - Enables (when set) the
breakpoint condition for the associated breakpoint for all tasks. When a breakpoint condition is detected and its
associated Gn flag is set, a debug exception is generated. The processor does not clear these flags on a task
switch, allowing a breakpoint to be enabled for all tasks.
•
LE and GE (local and global exact breakpoint enable) flags (bits 8, 9) - This feature is not supported in
the P6 family processors, later IA-32 processors, and Intel 64 processors. When set, these flags cause the
processor to detect the exact instruction that caused a data breakpoint condition. For backward and forward
compatibility with other Intel processors, we recommend that the LE and GE flags be set to 1 if exact
breakpoints are required.
•
RTM (restricted transactional memory) flag (bit 11) - Enables (when set) advanced debugging of RTM
transactional regions (see Section 20.3.3). This advanced debugging is enabled only if IA32_DEBUGCTL.RTM is
also set.
•
GD (general detect enable) flag (bit 13) - Enables (when set) debug-register protection, which causes a
debug exception to be generated prior to any MOV instruction that accesses a debug register. When such a
condition is detected, the BD flag in debug status register DR6 is set prior to generating the exception. This
condition is provided to support in-circuit emulators.
When the emulator needs to access the debug registers, emulator software can set the GD flag to prevent
interference from the program currently executing on the processor.
The processor clears the GD flag upon entering to the debug exception handler, to allow the handler access to
the debug registers.
•
R/W0 through R/W3 (read/write) fields (bits 16, 17, 20, 21, 24, 25, 28, and 29) - Specifies the
breakpoint condition for the corresponding breakpoint. The DE (debug extensions) flag in control register CR4
determines how the bits in the R/Wn fields are interpreted. When the DE flag is set, the processor interprets
bits as follows:
00 - Break on instruction execution only.
01 - Break on data writes only.
10 - Break on I/O reads or writes.
11 - Break on data reads or writes but not instruction fetches.
When the DE flag is clear, the processor interprets the R/Wn bits the same as for the Intel386™ and Intel486™
processors, which is as follows:
00 - Break on instruction execution only.
01 - Break on data writes only.
10 - Undefined.
11 - Break on data reads or writes but not instruction fetches.
•
LEN0 through LEN3 (Length) fields (bits 18, 19, 22, 23, 26, 27, 30, and 31) - Specify the size of the
memory location at the address specified in the corresponding breakpoint address register (DR0 through DR3).
These fields are interpreted as follows:
00 - 1-byte length.
01 - 2-byte length.
10 - Undefined (or 8 byte length, see note below).
11 - 4-byte length.
If the corresponding RWn field in register DR7 is 00 (instruction execution), then the LENn field should also be 00.
The effect of using other lengths is undefined. See Section 20.2.5, “Breakpoint Field Recognition,” below.
Vol. 3B
20-5

DEBUG, BRANCH PROFILE, TSC, AND INTEL® RESOURCE DIRECTOR TECHNOLOGY (INTEL® RDT) FEATURES
NOTES
For Pentium® 4 and Intel® Xeon® processors with a CPUID signature corresponding to family 15
(model 3, 4, and 6), break point conditions permit specifying 8-byte length on data read/write with
an of encoding 10B in the LENn field.
Encoding 10B is also supported in processors based on Intel Core microarchitecture or enhanced
Intel Core microarchitecture, the respective CPUID signatures corresponding to family 6, model 15,
and family 6, DisplayModel value 23 (see the CPUID instruction in Chapter 3, “Instruction Set
Reference, A-L,” in the Intel® 64 and IA-32 Architectures Software Developer’s Manual, Volume
2A). The Encoding 10B is supported in processors based on Intel Atom® microarchitecture, with
CPUID signature of family 6, DisplayModel value 1CH. The encoding 10B is undefined for other
processors.
20.2.5 Breakpoint Field Recognition
Breakpoint address registers (debug registers DR0 through DR3) and the LENn fields for each breakpoint define a
range of sequential byte addresses for a data or I/O breakpoint. The LENn fields permit specification of a 1-, 2-, 4-
or 8-byte range, beginning at the linear address specified in the corresponding debug register (DRn). Two-byte
ranges must be aligned on word boundaries; 4-byte ranges must be aligned on doubleword boundaries, 8-byte
ranges must be aligned on quadword boundaries. I/O addresses are zero-extended (from 16 to 32 bits, for compar-
ison with the breakpoint address in the selected debug register). These requirements are enforced by the
processor; it uses LENn field bits to mask the lower address bits in the debug registers. Unaligned data or I/O
breakpoint addresses do not yield valid results.
A data breakpoint for reading or writing data is triggered if any of the bytes participating in an access is within the
range defined by a breakpoint address register and its LENn field. Table 20-1 provides an example setup of debug
registers and data accesses that would subsequently trap or not trap on the breakpoints.
A data breakpoint for an unaligned operand can be constructed using two breakpoints, where each breakpoint is
byte-aligned and the two breakpoints together cover the operand. The breakpoints generate exceptions only for
the operand, not for neighboring bytes.
Instruction breakpoint addresses must have a length specification of 1 byte (the LENn field is set to 00). Instruction
breakpoints for other operand sizes are undefined. The processor recognizes an instruction breakpoint address only
when it points to the first byte of an instruction. If the instruction has prefixes, the breakpoint address must point
to the first prefix.
Table 20-1. Breakpoint Examples
Debug Register Setup
Debug Register
R/Wn
Breakpoint Address
LENn
DR0
R/W0 = 11 (Read/Write)
A0001H
LEN0 = 00 (1 byte)
DR1
R/W1 = 01 (Write)
A0002H
LEN1 = 00 (1 byte)
DR2
R/W2 = 11 (Read/Write)
B0002H
LEN2 = 01) (2 bytes)
DR3
R/W3 = 01 (Write)
C0000H
LEN3 = 11 (4 bytes)
Data Accesses
Operation
Address
Access Length
(In Bytes)
Data operations that trap
- Read or write
A0001H
1
- Read or write
A0001H
2
- Write
A0002H
1
- Write
A0002H
2
- Read or write
B0001H
4
- Read or write
B0002H
1
- Read or write
B0002H
2
- Write
C0000H
4
- Write
C0001H
2
- Write
C0003H
1
20-6
Vol. 3B
DEBUG, BRANCH PROFILE, TSC, AND INTEL® RESOURCE DIRECTOR TECHNOLOGY (INTEL® RDT) FEATURES
Table 20-1. Breakpoint Examples (Contd.)
Debug Register Setup
Debug Register
R/Wn
Breakpoint Address
LENn
Data operations that do not trap
- Read or write
A0000H
1
- Read
A0002H
1
- Read or write
A0003H
4
- Read or write
B0000H
2
- Read
C0000H
2
- Read or write
C0004H
4
20.2.6 Debug Registers and Intel® 64 Processors
For Intel 64 architecture processors, debug registers DR0-DR7 are 64 bits. In 16-bit or 32-bit modes (protected
mode and compatibility mode), writes to a debug register fill the upper 32 bits with zeros. Reads from a debug
register return the lower 32 bits. In 64-bit mode, MOV DRn instructions read or write all 64 bits. Operand-size
prefixes are ignored.
In 64-bit mode, the upper 32 bits of DR6 and DR7 are reserved and must be written with zeros. Writing 1 to any of
the upper 32 bits results in a #GP(0) exception (see Figure 20-2). All 64 bits of DR0-DR3 are writable by software.
However, MOV DRn instructions do not check that addresses written to DR0-DR3 are in the linear-address limits of
the processor implementation (address matching is supported only on valid addresses generated by the processor
implementation). Breakpoint conditions for 8-byte memory read/writes are supported in all modes.
20.3
DEBUG EXCEPTIONS
The Intel 64 and IA-32 architectures dedicate two interrupt vectors to handling debug exceptions: vector 1 (debug
exception, #DB) and vector 3 (breakpoint exception, #BP). The following sections describe how these exceptions
are generated and typical exception handler operations.
20.3.1 Debug Exception (#DB)-Interrupt Vector 1
The debug-exception handler is usually a debugger program or part of a larger software system. The processor
generates a debug exception for any of several conditions. The debugger checks flags in the DR6 and DR7 registers
to determine which condition caused the exception and which other conditions might apply. Table 20-2 shows the
states of these flags following the generation of each kind of breakpoint condition.
Instruction-breakpoint and general-detect condition (see Section 20.3.1.3, “General-Detect Exception Condition”)
result in faults; other debug-exception conditions result in traps. The debug exception may report one or both at
one time. The following sections describe each class of debug exception.
The INT1 instruction generates a debug exception as a trap. Hardware vendors may use the INT1 instruction for
hardware debug. For that reason, Intel recommends software vendors instead use the INT3 instruction for soft-
ware breakpoints.
See also: Chapter 7, “Event 1-Debug Exception (#DB),” in the Intel® 64 and IA-32 Architectures Software Devel-
oper’s Manual, Volume 3A.
Vol. 3B
20-7

DEBUG, BRANCH PROFILE, TSC, AND INTEL® RESOURCE DIRECTOR TECHNOLOGY (INTEL® RDT) FEATURES
63
32
DR7
31
30
29
28
27
26
25
24
23
22
21
20
19
18
17
16
15
14
13
12
11
10
9
8
7
6
5
4
3
2
1
0
LEN
R/W
LEN
R/W
LEN
R/W
LEN
R/W
G
G
L
G
L
G
L
G
L
G
L
0
0
0
0
1
DR7
3
3
2
2
1
1
0
0
D
E
E
3
3
2
2
1
1
0
0
63
32
DR6
31
16
15
14
13
12
11
10
9
8
7
6
5
4
3
2
1
0
R
B
B
B
B
B
B
B
B
Reserved (set to 1)
T
0
L
1
1
1
1
1
1
1
DR6
T
S
D
3
2
1
0
M
D
63
32
DR5
63
32
DR4
63
32
Breakpoint 3 Linear Address
DR3
63
32
Breakpoint 2 Linear Address
DR2
63
32
Breakpoint 1 Linear Address
DR1
63
32
Breakpoint 0 Linear Address
DR0
Reserved
Figure 20-2. DR6/DR7 Layout on Processors Supporting Intel® 64 Architecture
20-8
Vol. 3B
DEBUG, BRANCH PROFILE, TSC, AND INTEL® RESOURCE DIRECTOR TECHNOLOGY (INTEL® RDT) FEATURES
Table 20-2. Debug Exception Conditions
Debug or Breakpoint Condition
DR6 Flags Tested
DR7 Flags Tested
Exception Class
Single-step trap
BS = 1
Trap
Instruction breakpoint, at addresses defined by DRn and
Bn = 1 and
R/Wn = 0
Fault
LENn
(Gn or Ln = 1)
Data write breakpoint, at addresses defined by DRn and
Bn = 1 and
R/Wn = 1
Trap
LENn
(Gn or Ln = 1)
I/O read or write breakpoint, at addresses defined by DRn
Bn = 1 and
R/Wn = 2
Trap
and LENn
(Gn or Ln = 1)
Data read or write (but not instruction fetches), at
Bn = 1 and
R/Wn = 3
Trap
addresses defined by DRn and LENn
(Gn or Ln = 1)
General detect fault, resulting from an attempt to modify
BD = 1
None
Fault
debug registers (usually in conjunction with in-circuit
emulation)
Task switch
BT = 1
None
Trap
INT1 instruction
None
None
Trap
20.3.1.1 Instruction-Breakpoint Exception Condition
The processor reports an instruction breakpoint when it attempts to execute an instruction at an address specified
in a breakpoint-address register (DR0 through DR3) that has been set up to detect instruction execution (R/W flag
is set to 0). Upon reporting the instruction breakpoint, the processor generates a fault-class, debug exception
(#DB) before it executes the target instruction for the breakpoint.
Instruction breakpoints are the highest priority debug exceptions. They are serviced before any other exceptions
detected during the decoding or execution of an instruction. However, if an instruction breakpoint is placed on an
instruction located immediately after a POP SS/MOV SS instruction, the breakpoint will be suppressed as if
EFLAGS.RF were 1 (see the next paragraph and Section 7.8.3, “Masking Exceptions and Interrupts When
Switching Stacks,” of the Intel® 64 and IA-32 Architectures Software Developer’s Manual, Volume 3A).
Because the debug exception for an instruction breakpoint is generated before the instruction is executed, if the
instruction breakpoint is not removed by the exception handler; the processor will detect the instruction breakpoint
again when the instruction is restarted and generate another debug exception. To prevent looping on an instruction
breakpoint, the Intel 64 and IA-32 architectures provide the RF flag (resume flag) in the EFLAGS register (see
Section 2.3, “System Flags and Fields in the EFLAGS Register,” in the Intel® 64 and IA-32 Architectures Software
Developer’s Manual, Volume 3A). When the RF flag is set, the processor ignores instruction breakpoints.
All Intel 64 and IA-32 processors manage the RF flag as follows. The RF Flag is cleared at the start of the instruction
after the check for instruction breakpoints, CS limit violations, and FP exceptions. Task Switches and IRETD/IRETQ
instructions transfer the RF image from the TSS/stack to the EFLAGS register.
When calling an event handler, Intel 64 and IA-32 processors establish the value of the RF flag in the EFLAGS image
pushed on the stack:
• For any fault-class exception except a debug exception generated in response to an instruction breakpoint, the
value pushed for RF is 1.
• For any interrupt arriving after any iteration of a repeated string instruction but the last iteration, the value
pushed for RF is 1.
• For any trap-class exception generated by any iteration of a repeated string instruction but the last iteration,
the value pushed for RF is 1.
• For other cases, the value pushed for RF is the value that was in EFLAG.RF at the time the event handler was
called. This includes:
- Debug exceptions generated in response to instruction breakpoints
- Hardware-generated interrupts arriving between instructions (including those arriving after the last
iteration of a repeated string instruction)
Vol. 3B
20-9
DEBUG, BRANCH PROFILE, TSC, AND INTEL® RESOURCE DIRECTOR TECHNOLOGY (INTEL® RDT) FEATURES
- Trap-class exceptions generated after an instruction completes (including those generated after the last
iteration of a repeated string instruction)
- Software-generated interrupts (RF is pushed as 0, since it was cleared at the start of the software interrupt)
As noted above, the processor does not set the RF flag prior to calling the debug exception handler for debug
exceptions resulting from instruction breakpoints. The debug exception handler can prevent recurrence of the
instruction breakpoint by setting the RF flag in the EFLAGS image on the stack. If the RF flag in the EFLAGS image
is set when the processor returns from the exception handler, it is copied into the RF flag in the EFLAGS register by
IRETD/IRETQ or a task switch that causes the return. The processor then ignores instruction breakpoints for the
duration of the next instruction. (Note that the POPF, POPFD, and IRET instructions do not transfer the RF image
into the EFLAGS register.) Setting the RF flag does not prevent other types of debug-exception conditions (such as,
I/O or data breakpoints) from being detected, nor does it prevent non-debug exceptions from being generated.
For the Pentium processor, when an instruction breakpoint coincides with another fault-type exception (such as a
page fault), the processor may generate one spurious debug exception after the second exception has been
handled, even though the debug exception handler set the RF flag in the EFLAGS image. To prevent a spurious
exception with Pentium processors, all fault-class exception handlers should set the RF flag in the EFLAGS image.
20.3.1.2 Data Memory and I/O Breakpoint Exception Conditions
Data memory and I/O breakpoints are reported when the processor attempts to access a memory or I/O address
specified in a breakpoint-address register (DR0 through DR3) that has been set up to detect data or I/O accesses
(R/W flag is set to 1, 2, or 3). The processor generates the exception after it executes the instruction that made the
access, so these breakpoint condition causes a trap-class exception to be generated.
Because data breakpoints are traps, an instruction that writes memory overwrites the original data before the
debug exception generated by a data breakpoint is generated. If a debugger needs to save the contents of a write
breakpoint location, it should save the original contents before setting the breakpoint. The handler can report the
saved value after the breakpoint is triggered. The address in the debug registers can be used to locate the new
value stored by the instruction that triggered the breakpoint.
If a data breakpoint is detected during an iteration of a string instruction executed with fast-string operation (see
Section 7.3.9.3 of the Intel® 64 and IA-32 Architectures Software Developer’s Manual, Volume 1), delivery of the
resulting debug exception may be delayed until completion of the corresponding group of iterations.
Intel486 and later processors ignore the GE and LE flags in DR7. In Intel386 processors, exact data breakpoint
matching does not occur unless it is enabled by setting the LE and/or the GE flags.
For repeated INS and OUTS instructions that generate an I/O-breakpoint debug exception, the processor generates
the exception after the completion of the first iteration. Repeated INS and OUTS instructions generate a data-
breakpoint debug exception after the iteration in which the memory address breakpoint location is accessed.
If an execution of the MOV or POP instruction loads the SS register and encounters a data breakpoint, the resulting
debug exception is delivered after completion of the next instruction (the one after the MOV or POP).
Any pending data or I/O breakpoints are lost upon delivery of an exception. For example, if a machine-check
exception (#MC) occurs following an instruction that encounters a data breakpoint (but before the resulting debug
exception is delivered), the data breakpoint is lost. If a MOV or POP instruction that loads the SS register encoun-
ters a data breakpoint, the data breakpoint is lost if the next instruction causes a fault.
Delivery of events due to INT n, INT3, or INTO does not cause a loss of data breakpoints. If a MOV or POP instruc-
tion that loads the SS register encounters a data breakpoint, and the next instruction is software interrupt (INT n,
INT3, or INTO), a debug exception (#DB) resulting from a data breakpoint will be delivered after the transition to
the software-interrupt handler. The #DB handler should account for the fact that the #DB may have been delivered
after a invocation of a software-interrupt handler, and in particular that the CPL may have changed between recog-
nition of the data breakpoint and delivery of the #DB.
20.3.1.3 General-Detect Exception Condition
When the GD flag in DR7 is set, the general-detect debug exception occurs when a program attempts to access any
of the debug registers (DR0 through DR7) at the same time they are being used by another application, such as an
emulator or debugger. This protection feature guarantees full control over the debug registers when required. The
20-10
Vol. 3B
DEBUG, BRANCH PROFILE, TSC, AND INTEL® RESOURCE DIRECTOR TECHNOLOGY (INTEL® RDT) FEATURES
debug exception handler can detect this condition by checking the state of the BD flag in the DR6 register. The
processor generates the exception before it executes the MOV instruction that accesses a debug register, which
causes a fault-class exception to be generated.
20.3.1.4 Single-Step Exception Condition
The processor generates a single-step debug exception if (while an instruction is being executed) it detects that the
TF flag in the EFLAGS register is set. The exception is a trap-class exception, because the exception is generated
after the instruction is executed. The processor will not generate this exception after the instruction that sets the
TF flag. For example, if the POPF instruction is used to set the TF flag, a single-step trap does not occur until after
the instruction that follows the POPF instruction.
The processor clears the TF flag before calling the exception handler. If the TF flag was set in a TSS at the time of
a task switch, the exception occurs after the first instruction is executed in the new task.
The TF flag normally is not cleared by privilege changes inside a task. The INT n, INT3, and INTO instructions,
however, do clear this flag. Therefore, software debuggers that single-step code must recognize and emulate INT n
or INTO instructions rather than executing them directly. To maintain protection, the operating system should
check the CPL after any single-step trap to see if single stepping should continue at the current privilege level.
The interrupt priorities guarantee that, if an external interrupt occurs, single stepping stops. When both an
external interrupt and a single-step interrupt occur together, the single-step interrupt is processed first. This oper-
ation clears the TF flag. After saving the return address or switching tasks, the external interrupt input is examined
before the first instruction of the single-step handler executes. If the external interrupt is still pending, then it is
serviced. The external interrupt handler does not run in single-step mode. To single step an interrupt handler,
single step an INT n instruction that calls the interrupt handler.
If an occurrence of the MOV or POP instruction loads the SS register executes with EFLAGS.TF = 1, no single-step
debug exception occurs following the MOV or POP instruction.
20.3.1.5 Task-Switch Exception Condition
The processor generates a debug exception after a task switch if the T flag of the new task's TSS is set. This excep-
tion is generated after program control has passed to the new task, and prior to the execution of the first instruc-
tion of that task. The exception handler can detect this condition by examining the BT flag of the DR6 register.
If entry 1 (#DB) in the IDT is a task gate, the T bit of the corresponding TSS should not be set. Failure to observe
this rule will put the processor in a loop.
20.3.1.6 OS Bus-Lock Detection
OS bus-lock detection is a feature that causes the processor to generate a debug exception (called a bus-lock
detection debug exception) if it detects that a bus lock has been asserted (see Section 11.1.2). Such an excep-
tion is a trap-class exception, because it is generated after execution of an instruction that asserts a bus lock. The
exception thus does not prevent assertion of the bus lock. Delivery of a bus-lock detection debug exception clears
DR6.BLD.
Software can enable OS bus-lock detection by setting IA32_DEBUGCTL.BLD[bit 2]. Bus-lock detection debug
exceptions occur only if CPL > 0.
20.3.2 Breakpoint Exception (#BP)-Interrupt Vector 3
The breakpoint exception (interrupt 3) is caused by execution of an INT3 instruction. See Chapter 7, “Event
3-Breakpoint Exception (#BP).” Debuggers use breakpoint exceptions in the same way that they use the break-
point registers; that is, as a mechanism for suspending program execution to examine registers and memory loca-
tions. With earlier IA-32 processors, breakpoint exceptions are used extensively for setting instruction
breakpoints.
With the Intel386 and later IA-32 processors, it is more convenient to set breakpoints with the breakpoint-address
registers (DR0 through DR3). However, the breakpoint exception still is useful for breakpointing debuggers,
Vol. 3B
20-11
DEBUG, BRANCH PROFILE, TSC, AND INTEL® RESOURCE DIRECTOR TECHNOLOGY (INTEL® RDT) FEATURES
because a breakpoint exception can call a separate exception handler. The breakpoint exception is also useful when
it is necessary to set more breakpoints than there are debug registers or when breakpoints are being placed in the
source code of a program under development.
20.3.3 Debug Exceptions, Breakpoint Exceptions, and Restricted Transactional Memory
(RTM)
Chapter 16, “Programming with Intel® AVX10,” of Intel® 64 and IA-32 Architectures Software Developer’s Manual,
Volume 1, describes Restricted Transactional Memory (RTM). This is an instruction-set interface that allows soft-
ware to identify transactional regions (or critical sections) using the XBEGIN and XEND instructions.
Execution of an RTM transactional region begins with an XBEGIN instruction. If execution of the region successfully
reaches an XEND instruction, the processor ensures that all memory operations performed within the region
appear to have occurred instantaneously when viewed from other logical processors. Execution of an RTM transac-
tion region does not succeed if the processor cannot commit the updates atomically. When this happens, the
processor rolls back the execution, a process referred to as a transactional abort. In this case, the processor
discards all updates performed in the region, restores architectural state to appear as if the execution had not
occurred, and resumes execution at a fallback instruction address that was specified with the XBEGIN instruction.
If debug exception (#DB) or breakpoint exception (#BP) occurs within an RTM transaction region, a transactional
abort occurs, the processor sets EAX[4], and no exception is delivered.
Software can enable advanced debugging of RTM transactional regions by setting DR7.RTM[bit 11] and
IA32_DEBUGCTL.RTM[bit 15]. If these bits are both set, the transactional abort caused by a #DB or #BP within an
RTM transaction region does not resume execution at the fallback instruction address specified with the XBEGIN
instruction that begin the region. Instead, execution is resumed at that XBEGIN instruction, and a #DB is delivered.
(A #DB is delivered even if the transactional abort was caused by a #BP.) Such a #DB will clear DR6.RTM[bit 16]
(all other debug exceptions set DR6[16]).
20.4
LAST BRANCH, INTERRUPT, AND EXCEPTION RECORDING OVERVIEW
P6 family processors introduced the ability to set breakpoints on taken branches, interrupts, and exceptions, and
to single-step from one branch to the next. This capability has been modified and extended in the Pentium 4, Intel
Xeon, Pentium M, Intel® Core™ Solo, Intel® Core™ Duo, Intel® Core™2 Duo, Intel® Core™ i7 and Intel Atom®
processors to allow logging of branch trace messages in a branch trace store (BTS) buffer in memory.
See the following sections for processor specific implementation of last branch, interrupt, and exception recording:
- Section 20.5, “Last Branch, Interrupt, and Exception Recording (Intel® Core™ 2 Duo and Intel Atom®
Processors).”
- Section 20.6, “Last Branch, Call Stack, Interrupt, and Exception Recording for Processors based on
Goldmont Microarchitecture.”
- Section 20.9, “Last Branch, Interrupt, and Exception Recording for Processors based on Nehalem Microar-
chitecture.”
- Section 20.10, “Last Branch, Interrupt, and Exception Recording for Processors based on Sandy Bridge
Microarchitecture.”
- Section 20.11, “Last Branch, Call Stack, Interrupt, and Exception Recording for Processors based on
Haswell Microarchitecture.”
- Section 20.12, “Last Branch, Call Stack, Interrupt, and Exception Recording for Processors based on
Skylake Microarchitecture.”
- Section 20.14, “Last Branch, Interrupt, and Exception Recording (Intel® Core™ Solo and Intel® Core™
Duo Processors).”
- Section 20.15, “Last Branch, Interrupt, and Exception Recording (Pentium M Processors).”
- Section 20.16, “Last Branch, Interrupt, and Exception Recording (P6 Family Processors).”
20-12
Vol. 3B

DEBUG, BRANCH PROFILE, TSC, AND INTEL® RESOURCE DIRECTOR TECHNOLOGY (INTEL® RDT) FEATURES
The following subsections of Section 20.4 describe common features of profiling branches. These features are
generally enabled using the IA32_DEBUGCTL MSR (older processor may have implemented a subset or model-
specific features, see definitions of MSR_DEBUGCTLA, MSR_DEBUGCTLB, MSR_DEBUGCTL).
20.4.1 IA32_DEBUGCTL MSR
The IA32_DEBUGCTL MSR provides bit field controls to enable debug trace interrupts, debug trace stores, trace
messages enable, single stepping on branches, last branch record recording, and to control freezing of LBR stack
or performance counters on a PMI request. IA32_DEBUGCTL MSR is located at register address 01D9H.
See Figure 20-3 for the MSR layout and the bullets below for a description of the flags:
• LBR (last branch/interrupt/exception) flag (bit 0) - When set, the processor records a running trace of
the most recent branches, interrupts, and/or exceptions taken by the processor (prior to a debug exception
being generated) in the last branch record (LBR) stack. For more information, see the Section 20.5.1, “LBR
Stack” (Intel® Core™2 Duo and Intel Atom® processor family) and Section 20.9.1, “LBR Stack” (processors
based on Nehalem microarchitecture).
• BTF (single-step on branches) flag (bit 1) - When set, the processor treats the TF flag in the EFLAGS
register as a “single-step on branches” flag rather than a “single-step on instructions” flag. This mechanism
allows single-stepping the processor on taken branches. See Section 20.4.3, “Single-Stepping on Branches,”
for more information about the BTF flag.
• BLD (bus-lock detection) flag (bit 2) - If this bit is set, OS bus-lock detection is enabled when CPL > 0.
See Section 20.3.1.6.
• TR (trace message enable) flag (bit 6) - When set, branch trace messages are enabled. When the
processor detects a taken branch, interrupt, or exception; it sends the branch record out on the system bus as
a branch trace message (BTM). See Section 20.4.4, “Branch Trace Messages,” for more information about the
TR flag.
• BTS (branch trace store) flag (bit 7) - When set, the flag enables BTS facilities to log BTMs to a memory-
resident BTS buffer that is part of the DS save area. See Section 20.4.9, “BTS and DS Save Area.”
• BTINT (branch trace interrupt) flag (bit 8) - When set, the BTS facilities generate an interrupt when the
BTS buffer is full. When clear, BTMs are logged to the BTS buffer in a circular fashion. See Section 20.4.5, “Branch
Trace Store (BTS),” for a description of this mechanism.
31
15
14
12
11
10
9
8
7
6
5
4
3
2
1
0
Reserved
RTM
FREEZE_WHILE_SMM
FREEZE_PERFMON_ON_PMI
FREEZE_LBRS_ON_PMI
BTS_OFF_USR - BTS off in user code
BTS_OFF_OS - BTS off in OS
BTINT - Branch trace interrupt
BTS - Branch trace store
TR - Trace messages enable
Reserved
BLD - Bus-lock detection
BTF - Single-step on branches
LBR - Last branch/interrupt/exception
Reserved
Figure 20-3. IA32_DEBUGCTL MSR for Processors Based on Intel® Core™ Microarchitecture
Vol. 3B
20-13
DEBUG, BRANCH PROFILE, TSC, AND INTEL® RESOURCE DIRECTOR TECHNOLOGY (INTEL® RDT) FEATURES
• BTS_OFF_OS (branch trace off in privileged code) flag (bit 9) - When set, BTS or BTM is skipped if CPL
is 0. See Section 20.13.2.
• BTS_OFF_USR (branch trace off in user code) flag (bit 10) - When set, BTS or BTM is skipped if CPL is
greater than 0. See Section 20.13.2.
• FREEZE_LBRS_ON_PMI flag (bit 11) - When set, the LBR stack is frozen on a hardware PMI request (e.g.,
when a counter overflows and is configured to trigger PMI). See Section 20.4.7 for details.
• FREEZE_PERFMON_ON_PMI flag (bit 12) - When set, the performance counters (IA32_PMCx and IA32_-
FIXED_CTRx) are frozen on a PMI request. See Section 20.4.7 for details.
• FREEZE_WHILE_SMM (bit 14) - If this bit is set, upon the delivery of an SMI, the processor will clear all the
enable bits of IA32_PERF_GLOBAL_CTRL, save a copy of the content of IA32_DEBUGCTL and disable LBR, BTF,
TR, and BTS fields of IA32_DEBUGCTL before transferring control to the SMI handler. If Intel Thread Director
support was enabled before transferring control to the SMI handler, then the processor will also reset the Intel
Thread Director history (see Section 17.6.11 for more details about Intel Thread Director enable, reset, and
history reset operations).
Subsequently, the enable bits of IA32_PERF_GLOBAL_CTRL will be set to 1, the saved copy of IA32_DEBUGCTL
prior to SMI delivery will be restored, after the SMI handler issues RSM to complete its service. If Intel Thread
Director support is enabled when RSM is executed, then the processor resets the Intel Thread Director history.
Note that system software must check if the processor supports the IA32_DEBUGCTL.FREEZE_WHILE_SMM
control bit. IA32_DEBUGCTL.FREEZE_WHILE_SMM is supported if IA32_PERF_CAPABIL-
ITIES.FREEZE_WHILE_SMM[Bit 12] is reporting 1. See Section 22.8 for details of detecting the presence of
IA32_PERF_CAPABILITIES MSR.
• RTM (bit 15) - If this bit is set, advanced debugging of RTM transactional regions is enabled if DR7.RTM is
also set. See Section 20.3.3.
20.4.2 Monitoring Branches, Exceptions, and Interrupts
When the LBR flag (bit 0) in the IA32_DEBUGCTL MSR is set, the processor automatically begins recording branch
records for taken branches, interrupts, and exceptions (except for debug exceptions) in the LBR stack MSRs.
When the processor generates a debug exception (#DB), it automatically clears the LBR flag before executing the
exception handler. This action does not clear previously stored LBR stack MSRs.
A debugger can use the linear addresses in the LBR stack to re-set breakpoints in the breakpoint address registers
(DR0 through DR3). This allows a backward trace from the manifestation of a particular bug toward its source.
On some processors, if the LBR flag is cleared and TR flag in the IA32_DEBUGCTL MSR remains set, the processor
will continue to update LBR stack MSRs. This is because those processors use the entries in the LBR stack in the
process of generating BTM/BTS records. A #DB does not automatically clear the TR flag.
20.4.3 Single-Stepping on Branches
When software sets both the BTF flag (bit 1) in the IA32_DEBUGCTL MSR and the TF flag in the EFLAGS register,
the processor generates a single-step debug exception only after instructions that cause a branch.1 This mecha-
nism allows a debugger to single-step on control transfers caused by branches. This “branch single stepping” helps
isolate a bug to a particular block of code before instruction single-stepping further narrows the search. The
processor clears the BTF flag when it generates a debug exception. The debugger must set the BTF flag before
resuming program execution to continue single-stepping on branches.
1. Executions of CALL, IRET, and JMP that cause task switches never cause single-step debug exceptions (regardless of the value of the
BTF flag). A debugger desiring debug exceptions on switches to a task should set the T flag (debug trap flag) in the TSS of that task.
See Section 10.2.1, “Task-State Segment (TSS).”
20-14
Vol. 3B
DEBUG, BRANCH PROFILE, TSC, AND INTEL® RESOURCE DIRECTOR TECHNOLOGY (INTEL® RDT) FEATURES
20.4.4 Branch Trace Messages
Setting the TR flag (bit 6) in the IA32_DEBUGCTL MSR enables branch trace messages (BTMs). Thereafter, when
the processor detects a branch, exception, or interrupt, it sends a branch record out on the system bus as a BTM.
A debugging device that is monitoring the system bus can read these messages and synchronize operations with
taken branch, interrupt, and exception events.
When interrupts or exceptions occur in conjunction with a taken branch, additional BTMs are sent out on the bus,
as described in Section 20.4.2, “Monitoring Branches, Exceptions, and Interrupts.”
For the P6 processor family, Pentium M processor family, and processors based on Intel Core microarchitecture, TR
and LBR bits can not be set at the same time due to hardware limitation. The content of LBR stack is undefined
when TR is set.
For processors with Intel NetBurst microarchitecture, Intel Atom processors, and Intel Core and related Intel Xeon
processors both starting with the Nehalem microarchitecture, the processor can collect branch records in the LBR
stack and at the same time send/store BTMs when both the TR and LBR flags are set in the IA32_DEBUGCTL MSR
(or the equivalent MSR_DEBUGCTLA, MSR_DEBUGCTLB).
The following exception applies:
• BTM may not be observable on Intel Atom processor families that do not provide an externally visible system
bus (i.e., processors based on the Silvermont microarchitecture or later).
20.4.4.1 Branch Trace Message Visibility
Branch trace message (BTM) visibility is implementation specific and limited to systems with a front side bus (FSB).
BTMs may not be visible to newer system link interfaces or a system bus that deviates from a traditional FSB.
20.4.5 Branch Trace Store (BTS)
A trace of taken branches, interrupts, and exceptions is useful for debugging code by providing a method of deter-
mining the decision path taken to reach a particular code location. The LBR flag (bit 0) of IA32_DEBUGCTL provides
a mechanism for capturing records of taken branches, interrupts, and exceptions and saving them in the last
branch record (LBR) stack MSRs, setting the TR flag for sending them out onto the system bus as BTMs. The branch
trace store (BTS) mechanism provides the additional capability of saving the branch records in a memory-resident
BTS buffer, which is part of the DS save area. The BTS buffer can be configured to be circular so that the most
recent branch records are always available or it can be configured to generate an interrupt when the buffer is
nearly full so that all the branch records can be saved. The BTINT flag (bit 8) can be used to enable the generation
of interrupt when the BTS buffer is full. See Section 20.4.9.2, “Setting Up the DS Save Area,” for additional details.
Setting this flag (BTS) alone can greatly reduce the performance of the processor. CPL-qualified branch trace
storing mechanism can help mitigate the performance impact of sending/logging branch trace messages.
20.4.6 CPL-Qualified Branch Trace Mechanism
CPL-qualified branch trace mechanism is available to a subset of Intel 64 and IA-32 processors that support the
branch trace storing mechanism. The processor supports the CPL-qualified branch trace mechanism if
CPUID.01H:ECX[4] =1.
The CPL-qualified branch trace mechanism is described in Section 20.4.9.4. System software can selectively
specify CPL qualification to not send/store Branch Trace Messages associated with a specified privilege level. Two
bit fields, BTS_OFF_USR (bit 10) and BTS_OFF_OS (bit 9), are provided in the debug control register to specify the
CPL of BTMs that will not be logged in the BTS buffer or sent on the bus.
20.4.7 Freezing LBR and Performance Counters on PMI
Many issues may generate a performance monitoring interrupt (PMI); a PMI service handler will need to determine
cause to handle the situation. Two capabilities that allow a PMI service routine to improve branch tracing and
performance monitoring are available for processors supporting architectural performance monitoring version 2 or
Vol. 3B
20-15
DEBUG, BRANCH PROFILE, TSC, AND INTEL® RESOURCE DIRECTOR TECHNOLOGY (INTEL® RDT) FEATURES
greater (i.e., CPUID.0AH:EAX[7:0] > 1). These capabilities provides the following interface in IA32_DEBUGCTL to
reduce runtime overhead of PMI servicing, profiler-contributed skew effects on analysis or counter metrics:
• Freezing LBRs on PMI (bit 11) - Allows the PMI service routine to ensure the content in the LBR stack are
associated with the target workload and not polluted by the branch flows of handling the PMI. Depending on the
version ID enumerated by CPUID.0AH:EAX.VERSION[7:0], two flavors are supported:
- Legacy Freeze_LBR_on_PMI is supported for ArchPerfMonVerID <= 3 and ArchPerfMonVerID >1. If
IA32_DEBUGCTL.Freeze_LBR_On_PMI = 1, the LBR is frozen on the overflowed condition of the buffer
area, the processor clears the LBR bit (bit 0) in IA32_DEBUGCTL. Software must then re-enable IA32_DE-
BUGCTL.LBR to resume recording branches. When using this feature, software should be careful about
writes to IA32_DEBUGCTL to avoid re-enabling LBRs by accident if they were just disabled.
- Streamlined Freeze_LBR_on_PMI is supported for ArchPerfMonVerID >= 4. If IA32_DEBUGCTL.Freeze_L-
BR_On_PMI = 1, the processor behaves as follows:
• sets IA32_PERF_GLOBAL_STATUS.LBR_Frz =1 to disable recording, but does not change the LBR bit
(bit 0) in IA32_DEBUGCTL. The LBRs are frozen on the overflowed condition of the buffer area.
• Freezing PMCs on PMI (bit 12) - Allows the PMI service routine to ensure the content in the performance
counters are associated with the target workload and not polluted by the PMI and activities within the PMI
service routine. Depending on the version ID enumerated by CPUID.0AH:EAX.VERSION[7:0], two flavors are
supported:
- Legacy Freeze_PerfMon_on_PMI is supported for ArchPerfMonVerID <= 3 and ArchPerfMonVerID >1. If
IA32_DEBUGCTL.Freeze_PerfMon_On_PMI = 1, the performance counters are frozen on the counter
overflowed condition when the processor clears the IA32_PERF_GLOBAL_CTRL MSR (see Figure 22-3). The
PMCs affected include both general-purpose counters and fixed-function counters (see Section 22.6.2.1,
“Fixed-function Performance Counters”). Software must re-enable counts by writing 1s to the corre-
sponding enable bits in IA32_PERF_GLOBAL_CTRL before leaving a PMI service routine to continue counter
operation.
- Streamlined Freeze_PerfMon_on_PMI is supported for ArchPerfMonVerID >= 4. The processor behaves as
follows:
• sets IA32_PERF_GLOBAL_STATUS.CTR_Frz =1 to disable counting on a counter overflow condition, but
does not change the IA32_PERF_GLOBAL_CTRL MSR.
Freezing LBRs and PMCs on PMIs (both legacy and streamlined operation) occur when one of the following applies:
• A performance counter had an overflow and was programmed to signal a PMI in case of an overflow.
- For the general-purpose counters; enabling PMI is done by setting bit 20 of the IA32_PERFEVTSELx
register.
- For the fixed-function counters; enabling PMI is done by setting the 3rd bit in the corresponding 4-bit
control field of the MSR_PERF_FIXED_CTR_CTRL register (see Figure 22-1) or IA32_FIXED_CTR_CTRL MSR
(see Figure 22-2).
• The PEBS buffer is almost full and reaches the interrupt threshold.
• The BTS buffer is almost full and reaches the interrupt threshold.
Table 20-3 compares the interaction of the processor with the PMI handler using the legacy versus streamlined
Freeza_PerfMon_On_PMI interface.
20-16
Vol. 3B

DEBUG, BRANCH PROFILE, TSC, AND INTEL® RESOURCE DIRECTOR TECHNOLOGY (INTEL® RDT) FEATURES
Table 20-3. Legacy and Streamlined Operation with Freeze_PerfMon_On_PMI = 1, Counter Overflowed
Legacy Freeze_PerfMon_On_PMI
Streamlined Freeze_PerfMon_On_PMI
Comment
Processor freezes the counters on
Processor freezes the counters on overflow
Unchanged
overflow
Processor clears
Processor set IA32_PERF_GLOBAL_STATUS.CTR_FTZ
IA32_PERF_GLOBAL_CTRL
Handler reads
mask = RDMSR(0x38E)
Similar
IA32_PERF_GLOBAL_STATUS (0x38E) to
examine which counter(s) overflowed
Handler services the PMI
Handler services the PMI
Unchanged
Handler writes 1s to
Handler writes mask into
IA32_PERF_GLOBAL_OVF_CTL (0x390)
IA32_PERF_GLOBAL_OVF_RESET (0x390)
Processor clears
Processor clears IA32_PERF_GLOBAL_STATUS
Unchanged
IA32_PERF_GLOBAL_STATUS
Handler re-enables
None
Reduced software overhead
IA32_PERF_GLOBAL_CTRL
20.4.8 LBR Stack
The last branch record stack and top-of-stack (TOS) pointer MSRs are supported across Intel 64 and IA-32
processor families. However, the number of MSRs in the LBR stack and the valid range of TOS pointer value can
vary between different processor families. Table 20-4 lists the LBR stack size and TOS pointer range for several
processor families according to the CPUID signatures of DisplayFamily_DisplayModel encoding (see the CPUID
instruction in Chapter 3 of the Intel® 64 and IA-32 Architectures Software Developer’s Manual, Volume 2A).
Table 20-4. LBR Stack Size and TOS Pointer Range
DisplayFamily_DisplayModel
Size of LBR Stack
Component of an LBR Entry
Range of TOS Pointer
06_5CH, 06_5FH
32
FROM_IP, TO_IP
0 to 31
06_4EH, 06_5EH, 06_8EH, 06_9EH, 06_55H,
32
FROM_IP, TO_IP, LBR_INFO1
0 to 31
06_66H, 06_7AH, 06_67H, 06_6AH, 06_6CH,
06_7DH, 06_7EH, 06_8CH, 06_8DH, 06_6AH,
06_A5H, 06_A6H, 06_A7H, 06_A8H, 06_86H,
06_8AH, 06_96H, 06_9CH
06_3DH, 06_47H, 06_4FH, 06_56H, 06_3CH,
16
FROM_IP, TO_IP
0 to 15
06_45H, 06_46H, 06_3FH, 06_2AH, 06_2DH,
06_3AH, 06_3EH, 06_1AH, 06_1EH, 06_1FH,
06_2EH, 06_25H, 06_2CH, 06_2FH
06_17H, 06_1DH, 06_0FH
4
FROM_IP, TO_IP
0 to 3
06_37H, 06_4AH, 06_4CH, 06_4DH, 06_5AH,
8
FROM_IP, TO_IP
0 to 7
06_5DH, 06_1CH, 06_26H, 06_27H, 06_35H,
06_36H
NOTES:
1. See Section 20.12.
Vol. 3B
20-17
DEBUG, BRANCH PROFILE, TSC, AND INTEL® RESOURCE DIRECTOR TECHNOLOGY (INTEL® RDT) FEATURES
The last branch recording mechanism tracks not only branch instructions (e.g., JMP, Jcc, LOOP, and CALL instruc-
tions), but also other operations that cause a change in the instruction pointer (e.g., external interrupts, traps, and
faults). The branch recording mechanisms generally employs a set of MSRs, referred to as last branch record (LBR)
stack. The size and exact locations of the LBR stack are generally model-specific (see Chapter 2, “Model-Specific
Registers (MSRs)‚” in the Intel® 64 and IA-32 Architectures Software Developer’s Manual, Volume 4, for model-
specific MSR addresses).
• Last Branch Record (LBR) Stack - The LBR consists of N pairs of MSRs (N is listed in the LBR stack size
column of Table 20-4) that store source and destination address of recent branches (see Figure 20-3):
- MSR_LASTBRANCH_0_FROM_IP (address is model specific) through the next consecutive (N-1) MSR
address store source addresses.
- MSR_LASTBRANCH_0_TO_IP (address is model specific) through the next consecutive (N-1) MSR address
store destination addresses.
• Last Branch Record Top-of-Stack (TOS) Pointer - The lowest significant M bits of the TOS Pointer MSR
(MSR_LASTBRANCH_TOS, address is model specific) contains an M-bit pointer to the MSR in the LBR stack that
contains the most recent branch, interrupt, or exception recorded. The valid range of the M-bit POS pointer is
given in Table 20-4.
20.4.8.1 LBR Stack and Intel® 64 Processors
LBR MSRs are 64-bits. In 64-bit mode, last branch records store the full address. Outside of 64-bit mode, the upper
32-bits of branch addresses will be stored as 0.
MSR_LASTBRANCH_0_FROM_IP through MSR_LASTBRANCH_(N-1)_FROM_IP
63
0
Source Address
MSR_LASTBRANCH_0_TO_IP through MSR_LASTBRANCH_(N-1)_TO_IP
63
0
Destination Address
Figure 20-4. 64-bit Address Layout of LBR MSR
Software should query an architectural MSR IA32_PERF_CAPABILITIES[5:0] about the format of the address that
is stored in the LBR stack. Four formats are defined by the following encoding:
- 000000B (32-bit record format) - Stores 32-bit offset in current CS of respective source/destination,
- 000001B (64-bit LIP record format) - Stores 64-bit linear address of respective source/destination,
- 000010B (64-bit EIP record format) - Stores 64-bit offset (effective address) of respective
source/destination.
- 000011B (64-bit EIP record format) and Flags - Stores 64-bit offset (effective address) of respective
source/destination. Misprediction info is reported in the upper bit of 'FROM' registers in the LBR stack. See
LBR stack details below for flag support and definition.
- 000100B (64-bit EIP record format), Flags, and TSX - Stores 64-bit offset (effective address) of
respective source/destination. Misprediction and TSX info are reported in the upper bits of ‘FROM’ registers
in the LBR stack.
- 000101B (64-bit EIP record format), Flags, TSX, and LBR_INFO - Stores 64-bit offset (effective
address) of respective source/destination. Misprediction, TSX, and elapsed cycles since the last LBR update
are reported in the LBR_INFO MSR stack.
- 000110B (64-bit LIP record format), Flags, and Cycles - Stores 64-bit linear address (CS.Base +
effective address) of respective source/destination. Misprediction info is reported in the upper bits of
20-18
Vol. 3B
DEBUG, BRANCH PROFILE, TSC, AND INTEL® RESOURCE DIRECTOR TECHNOLOGY (INTEL® RDT) FEATURES
'FROM' registers in the LBR stack. Elapsed cycles since the last LBR update are reported in the upper 16 bits
of the 'TO' registers in the LBR stack (see Section 20.6).
- 000111B (64-bit LIP record format), Flags, and LBR_INFO - Stores 64-bit linear address (CS.Base
+ effective address) of respective source/destination. Misprediction, and elapsed cycles since the last LBR
update are reported in the LBR_INFO MSR stack.
Processor’s support for the architectural MSR IA32_PERF_CAPABILITIES is provided by CPUID.01H:ECX.PERF_CA-
PABILITIES (bit 15).
20.4.8.2 LBR Stack and IA-32 Processors
The LBR MSRs in IA-32 processors introduced prior to Intel 64 architecture store the 32-bit “To Linear Address” and
“From Linear Address” using the high and low half of each 64-bit MSR.
20.4.8.3 Last Exception Records and Intel 64 Architecture
Intel 64 and IA-32 processors also provide MSRs that store the branch record for the last branch taken prior to an
exception or an interrupt. The location of the last exception record (LER) MSRs are model specific. The MSRs that
store last exception records are 64-bits. If IA-32e mode is disabled, only the lower 32-bits of the address is
recorded. If IA-32e mode is enabled, the processor writes 64-bit values into the MSR. In 64-bit mode, last excep-
tion records store 64-bit addresses; in compatibility mode, the upper 32-bits of last exception records are cleared.
20.4.9 BTS and DS Save Area
The Debug store (DS) feature flag (bit 21), returned by CPUID.01H:EDX[21] indicates that the processor
provides the debug store (DS) mechanism. The DS mechanism allows:
• BTMs to be stored in a memory-resident BTS buffer. See Section 20.4.5, “Branch Trace Store (BTS).”
• Processor event-based sampling (PEBS) also uses the DS save area provided by debug store mechanism. The
capability of PEBS varies across different microarchitectures. See Section 22.6.2.4, “Processor Event Based
Sampling (PEBS),” and the relevant PEBS sub-sections across the core PMU sections in Chapter 22, “Perfor-
mance Monitoring.”
When CPUID.01H:EDX[21] is set:
• The BTS_UNAVAILABLE and PEBS_UNAVAILABLE flags in the IA32_MISC_ENABLE MSR indicate (when clear)
the availability of the BTS and PEBS facilities, including the ability to set the BTS and BTINT bits in the
appropriate DEBUGCTL MSR.
• The IA32_DS_AREA MSR exists and points to the DS save area.
The debug store (DS) save area is a software-designated area of memory that is used to collect the following two
types of information:
• Branch records - When the BTS flag in the IA32_DEBUGCTL MSR is set, a branch record is stored in the BTS
buffer in the DS save area whenever a taken branch, interrupt, or exception is detected.
• PEBS records - When a performance counter is configured for PEBS, a PEBS record is stored in the PEBS
buffer in the DS save area after the counter overflow occurs. This record contains the architectural state of the
processor (state of the 8 general purpose registers, EIP register, and EFLAGS register) at the next occurrence
of the PEBS event that caused the counter to overflow. When the state information has been logged, the
counter is automatically reset to a specified value, and event counting begins again. The content layout of a
PEBS record varies across different implementations that support PEBS. See Section 22.6.2.4.2 for details of
enumerating PEBS record format.
Vol. 3B
20-19
DEBUG, BRANCH PROFILE, TSC, AND INTEL® RESOURCE DIRECTOR TECHNOLOGY (INTEL® RDT) FEATURES
NOTES
Prior to processors based on the Goldmont microarchitecture, PEBS facility only supports a subset
of implementation-specific precise events. See Section 22.5.3.1 for a PEBS enhancement that can
generate records for both precise and non-precise events.
The DS save area and recording mechanism are disabled on INIT, processor Reset or transition to
system-management mode (SMM) or IA-32e mode. It is similarly disabled on the generation of a
machine-check exception on 45nm and 32nm Intel Atom processors and on processors with
Netburst or Intel Core microarchitecture.
The BTS and PEBS facilities may not be available on all processors. The availability of these facilities
is indicated by the BTS_UNAVAILABLE and PEBS_UNAVAILABLE flags, respectively, in the IA32_-
MISC_ENABLE MSR (see Chapter 2, “Model-Specific Registers (MSRs)‚” in the Intel® 64 and IA-32
Architectures Software Developer’s Manual, Volume 4).
The DS save area is divided into three parts: buffer management area, branch trace store (BTS) buffer, and PEBS
buffer (see Figure 20-5). The buffer management area is used to define the location and size of the BTS and PEBS
buffers. The processor then uses the buffer management area to keep track of the branch and/or PEBS records in
their respective buffers and to record the performance counter reset value. The linear address of the first byte of
the DS buffer management area is specified with the IA32_DS_AREA MSR.
The fields in the buffer management area are as follows:
• BTS buffer base - Linear address of the first byte of the BTS buffer. This address should point to a natural
doubleword boundary.
• BTS index - Linear address of the first byte of the next BTS record to be written to. Initially, this address
should be the same as the address in the BTS buffer base field.
• BTS absolute maximum - Linear address of the next byte past the end of the BTS buffer. This address should
be a multiple of the BTS record size (12 bytes) plus 1.
• BTS interrupt threshold - Linear address of the BTS record on which an interrupt is to be generated. This
address must point to an offset from the BTS buffer base that is a multiple of the BTS record size. Also, it must
be several records short of the BTS absolute maximum address to allow a pending interrupt to be handled prior
to processor writing the BTS absolute maximum record.
• PEBS buffer base - Linear address of the first byte of the PEBS buffer. This address should point to a natural
doubleword boundary.
• PEBS index - Linear address of the first byte of the next PEBS record to be written to. Initially, this address
should be the same as the address in the PEBS buffer base field.
• PEBS absolute maximum - Linear address of the next byte past the end of the PEBS buffer. This address
should be a multiple of the PEBS record size (40 bytes) plus 1.
• PEBS interrupt threshold - Linear address of the PEBS record on which an interrupt is to be generated. This
address must point to an offset from the PEBS buffer base that is a multiple of the PEBS record size. Also, it
must be several records short of the PEBS absolute maximum address to allow a pending interrupt to be
handled prior to processor writing the PEBS absolute maximum record.
• PEBS counter reset value - A 64-bit value that the counter is to be set to when a PEBS record is written. Bits
beyond the size of the counter are ignored. This value allows state information to be collected regularly every
time the specified number of events occur.
20-20
Vol. 3B
DEBUG, BRANCH PROFILE, TSC, AND INTEL® RESOURCE DIRECTOR TECHNOLOGY (INTEL® RDT) FEATURES
IA32_DS_AREA MSR
DS Buffer Management Area
BTS Buffer
BTS Buffer Base
0H
Branch Record 0
BTS Index
4H
BTS Absolute
8H
Maximum
Branch Record 1
BTS Interrupt
Threshold
CH
PEBS Buffer Base
10H
PEBS Index
14H
PEBS Absolute
18H
Maximum
Branch Record n
PEBS Interrupt
1CH
Threshold
20H
PEBS
Counter Reset
PEBS Buffer
24H
Reserved
30H
PEBS Record 0
PEBS Record 1
PEBS Record n
Figure 20-5. DS Save Area Example1
NOTES:
1. This example represents the format for a system that supports PEBS on only one counter.
Figure 20-6 shows the structure of a 12-byte branch record in the BTS buffer. The fields in each record are as
follows:
• Last branch from - Linear address of the instruction from which the branch, interrupt, or exception was
taken.
• Last branch to - Linear address of the branch target or the first instruction in the interrupt or exception
service routine.
• Branch predicted - Bit 4 of field indicates whether the branch that was taken was predicted (set) or not
predicted (clear).
Vol. 3B
20-21

DEBUG, BRANCH PROFILE, TSC, AND INTEL® RESOURCE DIRECTOR TECHNOLOGY (INTEL® RDT) FEATURES
31
4
0
Last Branch From
0H
Last Branch To
4H
8H
Branch Predicted
Figure 20-6. 32-bit Branch Trace Record Format
Figure 20-7 shows the structure of the 40-byte PEBS records. Nominally the register values are those at the begin-
ning of the instruction that caused the event. However, there are cases where the registers may be logged in a
partially modified state. The linear IP field shows the value in the EIP register translated from an offset into the
current code segment to a linear address.
31
0
EFLAGS
0H
Linear IP
4H
EAX
8H
EBX
CH
ECX
10H
EDX
14H
ESI
18H
EDI
1CH
EBP
20H
ESP
24H
Figure 20-7. PEBS Record Format
20.4.9.1
64 Bit Format of the DS Save Area
When DTES64 = 1 (CPUID.01H:ECX[2] = 1), the structure of the DS save area is shown in Figure 20-8.
When DTES64 = 0 (CPUID.01H:ECX[2] = 0) and IA-32e mode is active, the structure of the DS save area is shown
in Figure 20-8. If IA-32e mode is not active the structure of the DS save area is as shown in Figure 20-5.
20-22
Vol. 3B
DEBUG, BRANCH PROFILE, TSC, AND INTEL® RESOURCE DIRECTOR TECHNOLOGY (INTEL® RDT) FEATURES
IA32_DS_AREA MSR
DS Buffer Management Area
BTS Buffer
BTS Buffer Base
0H
Branch Record 0
BTS Index
8H
BTS Absolute
10H
Maximum
Branch Record 1
BTS Interrupt
18H
Threshold
PEBS Buffer Base
20H
PEBS Index
28H
PEBS Absolute
30H
Maximum
Branch Record n
PEBS Interrupt
38H
Threshold
40H
PEBS
Counter Reset
PEBS Buffer
48H
Reserved
50H
PEBS Record 0
PEBS Record 1
PEBS Record n
Figure 20-8. IA-32e Mode DS Save Area Example1
NOTES:
1. This example represents the format for a system that supports PEBS on only one counter.
The IA32_DS_AREA MSR holds the 64-bit linear address of the first byte of the DS buffer management area. The
structure of a branch trace record is similar to that shown in Figure 20-6, but each field is 8 bytes in length. This
makes each BTS record 24 bytes (see Figure 20-9). The structure of a PEBS record is similar to that shown in
Figure 20-7, but each field is 8 bytes in length and architectural states include register R8 through R15. This makes
the size of a PEBS record in 64-bit mode 144 bytes (see Figure 20-10).
63
4
0
Last Branch From
0H
Last Branch To
8H
10H
Branch Predicted
Figure 20-9. 64-bit Branch Trace Record Format
Vol. 3B
20-23

DEBUG, BRANCH PROFILE, TSC, AND INTEL® RESOURCE DIRECTOR TECHNOLOGY (INTEL® RDT) FEATURES
63
0
RFLAGS
0H
RIP
8H
RAX
10H
RBX
18H
RCX
20H
RDX
28H
RSI
30H
RDI
38H
RBP
40H
RSP
48H
R8
50H
R15
88H
Figure 20-10. 64-bit PEBS Record Format
Fields in the buffer management area of a DS save area are described in Section 20.4.9.
The format of a branch trace record and a PEBS record are the same as the 64-bit record formats shown in Figure
20-9. "64-bit Branch Trace Record Format," and Figure 20-10. "64-bit PEBS Record Format,", with the exception
that the branch predicted bit is not supported by Intel Core microarchitecture or Intel Atom microarchitecture. The
64-bit record formats for BTS and PEBS apply to DS save area for all operating modes.
The procedures used to program IA32_DEBUGCTL MSR to set up a BTS buffer or a CPL-qualified BTS are described
in Section 20.4.9.3 and Section 20.4.9.4.
Required elements for writing a DS interrupt service routine are largely the same on processors that support using
DS Save area for BTS or PEBS records. However, on processors based on Intel NetBurst® microarchitecture, re-
enabling counting requires writing to CCCRs. But a DS interrupt service routine on processors supporting architec-
tural performance monitoring should:
• Re-enable the enable bits in IA32_PERF_GLOBAL_CTRL MSR if it is servicing an overflow PMI due to PEBS.
• Clear overflow indications by writing to IA32_PERF_GLOBAL_OVF_CTRL when a counting configuration is
changed. This includes bit 62 (ClrOvfBuffer) and the overflow indication of counters used in either PEBS or
general-purpose counting (specifically: bits 0 or 1; see Figure 22-3. "Layout of IA32_PERF_GLOBAL_CTRL
MSR,").
20.4.9.2 Setting Up the DS Save Area
To save branch records with the BTS buffer, the DS save area must first be set up in memory as described in the
following procedure (See Section 22.6.2.4.1, “Setting up the PEBS Buffer,” for instructions for setting up a PEBS
buffer, respectively, in the DS save area):
1. Create the DS buffer management information area in memory (see Section 20.4.9, “BTS and DS Save Area,”
and Section 20.4.9.1, “64 Bit Format of the DS Save Area”). Also see the additional notes in this section.
2. Write the base linear address of the DS buffer management area into the IA32_DS_AREA MSR.
3. Set up the performance counter entry in the xAPIC LVT for fixed delivery and edge sensitive. See Section
13.5.1, “Local Vector Table.”
20-24
Vol. 3B

DEBUG, BRANCH PROFILE, TSC, AND INTEL® RESOURCE DIRECTOR TECHNOLOGY (INTEL® RDT) FEATURES
4. Establish an interrupt handler in the IDT for the vector associated with the performance counter entry in the
xAPIC LVT.
5. Write an interrupt service routine to handle the interrupt. See Section 20.4.9.5, “Writing the DS Interrupt
Service Routine.”
The following restrictions should be applied to the DS save area.
• The recording of branch records in the BTS buffer (or PEBS records in the PEBS buffer) may not operate
properly if accesses to the linear addresses in any of the three DS save area sections cause page faults, VM
exits, or the setting of accessed or dirty flags in the paging structures (ordinary or EPT). For that reason,
system software should establish paging structures (both ordinary and EPT) to prevent such occurrences.
Implications of this may be that an operating system should allocate this memory from a non-paged pool and
that system software cannot do “lazy” page-table entry propagation for these pages. Some newer processor
generations support “lazy” EPT page-table entry propagation for PEBS; see Section 22.3.9.1 and Section
22.9.5 for more information. A virtual-machine monitor may choose to allow use of PEBS by guest software
only if EPT maps all guest-physical memory as present and read/write.
• The DS save area can be larger than a page, but the pages must be mapped to contiguous linear addresses.
The buffer may share a page, so it need not be aligned on a 4-KByte boundary. For performance reasons, the
base of the buffer must be aligned on a doubleword boundary and should be aligned on a cache line boundary.
• It is recommended that the buffer size for the BTS buffer and the PEBS buffer be an integer multiple of the
corresponding record sizes.
• The precise event records buffer should be large enough to hold the number of precise event records that can
occur while waiting for the interrupt to be serviced.
• The DS save area should be in kernel space. It must not be on the same page as code, to avoid triggering self-
modifying code actions.
• There are no memory type restrictions on the buffers, although it is recommended that the buffers be
designated as WB memory type for performance considerations.
• Either the system must be prevented from entering A20M mode while DS save area is active, or bit 20 of all
addresses within buffer bounds must be 0.
• Pages that contain buffers must be mapped to the same physical addresses for all processes, such that any
change to control register CR3 will not change the DS addresses.
• The DS save area is expected to used only on systems with an enabled APIC. The LVT Performance Counter
entry in the APCI must be initialized to use an interrupt gate instead of the trap gate.
20.4.9.3 Setting Up the BTS Buffer
Three flags in the MSR_DEBUGCTLA MSR (see Table 20-5), IA32_DEBUGCTL (see Figure 20-3), or MSR_DE-
BUGCTLB (see Figure 20-16) control the generation of branch records and storing of them in the BTS buffer; these
are TR, BTS, and BTINT. The TR flag enables the generation of BTMs. The BTS flag determines whether the BTMs
are sent out on the system bus (clear) or stored in the BTS buffer (set). BTMs cannot be simultaneously sent to the
system bus and logged in the BTS buffer. The BTINT flag enables the generation of an interrupt when the BTS buffer
is full. When this flag is clear, the BTS buffer is a circular buffer.
Table 20-5. IA32_DEBUGCTL Flag Encodings
TR
BTS
BTINT
Description
0
X
X
Branch trace messages (BTMs) off
1
0
X
Generate BTMs
1
1
0
Store BTMs in the BTS buffer, used here as a circular buffer
1
1
1
Store BTMs in the BTS buffer, and generate an interrupt when the buffer is nearly full
The following procedure describes how to set up a DS Save area to collect branch records in the BTS buffer:
1. Place values in the BTS buffer base, BTS index, BTS absolute maximum, and BTS interrupt threshold fields of
the DS buffer management area to set up the BTS buffer in memory.
Vol. 3B
20-25

DEBUG, BRANCH PROFILE, TSC, AND INTEL® RESOURCE DIRECTOR TECHNOLOGY (INTEL® RDT) FEATURES
2. Set the TR and BTS flags in the IA32_DEBUGCTL for Intel Core Solo and Intel Core Duo processors or later
processors (or MSR_DEBUGCTLA MSR for processors based on Intel NetBurst Microarchitecture; or MSR_DE-
BUGCTLB for Pentium M processors).
3. Clear the BTINT flag in the corresponding IA32_DEBUGCTL (or MSR_DEBUGCTLA MSR; or MSR_DEBUGCTLB)
if a circular BTS buffer is desired.
NOTES
If the buffer size is set to less than the minimum allowable value (i.e., BTS absolute maximum < 1
+ size of BTS record), the results of BTS is undefined.
In order to prevent generating an interrupt, when working with circular BTS buffer, SW need to set
BTS interrupt threshold to a value greater than BTS absolute maximum (fields of the DS buffer
management area). It's not enough to clear the BTINT flag itself only.
20.4.9.4 Setting Up CPL-Qualified BTS
If the processor supports CPL-qualified last branch recording mechanism, the generation of branch records and
storing of them in the BTS buffer are determined by: TR, BTS, BTS_OFF_OS, BTS_OFF_USR, and BTINT. The
encoding of these five bits are shown in Table 20-6.
Table 20-6. CPL-Qualified Branch Trace Store Encodings
TR
BTS
BTS_OFF_OS
BTS_OFF_USR
BTINT
Description
0
X
X
X
X
Branch trace messages (BTMs) off
1
0
X
X
X
Generates BTMs but do not store BTMs
1
1
0
0
0
Store all BTMs in the BTS buffer, used here as a circular buffer
1
1
1
0
0
Store BTMs with CPL > 0 in the BTS buffer
1
1
0
1
0
Store BTMs with CPL = 0 in the BTS buffer
1
1
1
1
X
Generate BTMs but do not store BTMs
1
1
0
0
1
Store all BTMs in the BTS buffer; generate an interrupt when the
buffer is nearly full
1
1
1
0
1
Store BTMs with CPL > 0 in the BTS buffer; generate an interrupt
when the buffer is nearly full
1
1
0
1
1
Store BTMs with CPL = 0 in the BTS buffer; generate an interrupt
when the buffer is nearly full
20.4.9.5 Writing the DS Interrupt Service Routine
The BTS, non-precise event-based sampling, and PEBS facilities share the same interrupt vector and interrupt
service routine (called the debug store interrupt service routine or DS ISR). To handle BTS, non-precise event-
based sampling, and PEBS interrupts: separate handler routines must be included in the DS ISR. Use the following
guidelines when writing a DS ISR to handle BTS, non-precise event-based sampling, and/or PEBS interrupts.
• The DS interrupt service routine (ISR) must be part of a kernel driver and operate at a current privilege level of
0 to secure the buffer storage area.
• Because the BTS, non-precise event-based sampling, and PEBS facilities share the same interrupt vector, the
DS ISR must check for all the possible causes of interrupts from these facilities and pass control on to the
appropriate handler.
BTS and PEBS buffer overflow would be the sources of the interrupt if the buffer index matches/exceeds the
interrupt threshold specified. Detection of non-precise event-based sampling as the source of the interrupt is
accomplished by checking for counter overflow.
• There must be separate save areas, buffers, and state for each processor in an MP system.
• Upon entering the ISR, branch trace messages and PEBS should be disabled to prevent race conditions during
access to the DS save area. This is done by clearing TR flag in the IA32_DEBUGCTL (or MSR_DEBUGCTLA MSR)
20-26
Vol. 3B
DEBUG, BRANCH PROFILE, TSC, AND INTEL® RESOURCE DIRECTOR TECHNOLOGY (INTEL® RDT) FEATURES
and by clearing the precise event enable flag in the MSR_PEBS_ENABLE MSR. These settings should be
restored to their original values when exiting the ISR.
• The processor will not disable the DS save area when the buffer is full and the circular mode has not been
selected. The current DS setting must be retained and restored by the ISR on exit.
• After reading the data in the appropriate buffer, up to but not including the current index into the buffer, the ISR
must reset the buffer index to the beginning of the buffer. Otherwise, everything up to the index will look like
new entries upon the next invocation of the ISR.
• The ISR must clear the mask bit in the performance counter LVT entry.
• The ISR must re-enable the counters to count via IA32_PERF_GLOBAL_CTRL/IA32_PERF_GLOBAL_OVF_CTRL
if it is servicing an overflow PMI due to PEBS (or via CCCR's ENABLE bit on processor based on Intel NetBurst
microarchitecture).
• The Pentium 4 Processor and Intel Xeon Processor mask PMIs upon receiving an interrupt. Clear this condition
before leaving the interrupt handler.
20.5
LAST BRANCH, INTERRUPT, AND EXCEPTION RECORDING (INTEL® CORE™ 2
DUO AND INTEL ATOM® PROCESSORS)
The Intel Core 2 Duo processor family and Intel Xeon processors based on Intel Core microarchitecture or
enhanced Intel Core microarchitecture provide last branch interrupt and exception recording. The facilities
described in this section also apply to 45 nm and 32 nm Intel Atom processors. These capabilities are similar to
those found in Pentium 4 processors, including support for the following facilities:
• Debug Trace and Branch Recording Control - The IA32_DEBUGCTL MSR provide bit fields for software to
configure mechanisms related to debug trace, branch recording, branch trace store, and performance counter
operations. See Section 20.4.1 for a description of the flags. See Figure 20-3 for the MSR layout.
• Last branch record (LBR) stack - There are a collection of MSR pairs that store the source and destination
addresses related to recently executed branches. See Section 20.5.1.
• Monitoring and single-stepping of branches, exceptions, and interrupts
- See Section 20.4.2 and Section 20.4.3. In addition, the ability to freeze the LBR stack on a PMI request is
available.
- 45 nm and 32 nm Intel Atom processors clear the TR flag when the FREEZE_LBRS_ON_PMI flag is set.
• Branch trace messages - See Section 20.4.4.
• Last exception records - See Section 20.13.3.
• Branch trace store and CPL-qualified BTS - See Section 20.4.5.
• FREEZE_LBRS_ON_PMI flag (bit 11) - see Section 20.4.7 for legacy Freeze_LBRs_On_PMI operation.
• FREEZE_PERFMON_ON_PMI flag (bit 12) - see Section 20.4.7 for legacy Freeze_PerfMon_On_PMI
operation.
• FREEZE_WHILE_SMM (bit 14) - FREEZE_WHILE_SMM is supported if IA32_PERF_CAPABIL-
ITIES.FREEZE_WHILE_SMM[Bit 12] is reporting 1. See Section 20.4.1.
20.5.1 LBR Stack
The last branch record stack and top-of-stack (TOS) pointer MSRs are supported across Intel Core 2, Intel Atom
processor families, and Intel processors based on Intel NetBurst microarchitecture.
Four pairs of MSRs are supported in the LBR stack for Intel Core 2 processors families and Intel processors based
on Intel NetBurst microarchitecture:
• Last Branch Record (LBR) Stack
- MSR_LASTBRANCH_0_FROM_IP (address 40H) through MSR_LASTBRANCH_3_FROM_IP (address 43H)
store source addresses
Vol. 3B
20-27

DEBUG, BRANCH PROFILE, TSC, AND INTEL® RESOURCE DIRECTOR TECHNOLOGY (INTEL® RDT) FEATURES
- MSR_LASTBRANCH_0_TO_IP (address 60H) through MSR_LASTBRANCH_3_TO_IP (address 63H) store
destination addresses
• Last Branch Record Top-of-Stack (TOS) Pointer - The lowest significant 2 bits of the TOS Pointer MSR
(MSR_LASTBRANCH_TOS, address 1C9H) contains a pointer to the MSR in the LBR stack that contains the most
recent branch, interrupt, or exception recorded.
Eight pairs of MSRs are supported in the LBR stack for 45 nm and 32 nm Intel Atom processors:
• Last Branch Record (LBR) Stack
- MSR_LASTBRANCH_0_FROM_IP (address 40H) through MSR_LASTBRANCH_7_FROM_IP (address 47H)
store source addresses
- MSR_LASTBRANCH_0_TO_IP (address 60H) through MSR_LASTBRANCH_7_TO_IP (address 67H) store
destination addresses
• Last Branch Record Top-of-Stack (TOS) Pointer - The lowest significant 3 bits of the TOS Pointer MSR
(MSR_LASTBRANCH_TOS, address 1C9H) contains a pointer to the MSR in the LBR stack that contains the most
recent branch, interrupt, or exception recorded.
The address format written in the FROM_IP/TO_IP MSRS may differ between processors. Software should query
IA32_PERF_CAPABILITIES[5:0] and consult Section 20.4.8.1. The behavior of the MSR_LER_TO_LIP and the
MSR_LER_FROM_LIP MSRs corresponds to that of the LastExceptionToIP and LastExceptionFromIP MSRs found in
P6 family processors.
20.5.2 LBR Stack in Intel Atom® Processors based on the Silvermont Microarchitecture
The last branch record stack and top-of-stack (TOS) pointer MSRs are supported in Intel Atom processors based on
the Silvermont and Airmont microarchitectures. Eight pairs of MSRs are supported in the LBR stack.
LBR filtering is supported. Filtering of LBRs based on a combination of CPL and branch type conditions is supported.
When LBR filtering is enabled, the LBR stack only captures the subset of branches that are specified by MSR_L-
BR_SELECT. The layout of MSR_LBR_SELECT is described in Table 20-11.
20.6
LAST BRANCH, CALL STACK, INTERRUPT, AND EXCEPTION RECORDING
FOR PROCESSORS BASED ON GOLDMONT MICROARCHITECTURE
Processors based on the Goldmont microarchitecture extend the capabilities described in Section 20.5.2 with the
following enhancements:
• Supports new LBR format encoding 00110b in IA32_PERF_CAPABILITIES[5:0].
• Size of LBR stack increased to 32. Each entry includes MSR_LASTBRANCH_x_FROM_IP (address 0x680..0x69f)
and MSR_LASTBRANCH_x_TO_IP (address 0x6c0..0x6df).
• LBR call stack filtering supported. The layout of MSR_LBR_SELECT is described in Table 20-13.
• Elapsed cycle information is added to MSR_LASTBRANCH_x_TO_IP. Format is shown in Table 20-7.
• Misprediction info is reported in the upper bits of MSR_LASTBRANCH_x_FROM_IP. MISPRED bit format is
shown in Table 20-8.
• Streamlined Freeze_LBRs_On_PMI operation; see Section 20.12.2.
• LBR MSRs may be cleared when MWAIT is used to request a C-state that is numerically higher than C1; see
Section 20.12.3.
Table 20-7. MSR_LASTBRANCH_x_TO_IP for the Goldmont Microarchitecture
Bit Field
Bit Offset
Access
Description
Data
47:0
R/W
This is the “branch to“ address. See Section 20.4.8.1 for address format.
Cycle Count
63:48
R/W
Elapsed core clocks since last update to the LBR stack.
(Saturating)
20-28
Vol. 3B
DEBUG, BRANCH PROFILE, TSC, AND INTEL® RESOURCE DIRECTOR TECHNOLOGY (INTEL® RDT) FEATURES
20.7
LAST BRANCH, CALL STACK, INTERRUPT, AND EXCEPTION RECORDING
FOR PROCESSORS BASED ON GOLDMONT PLUS MICROARCHITECTURE
Next generation Intel Atom processors are based on the Goldmont Plus microarchitecture. Processors based on the
Goldmont Plus microarchitecture extend the capabilities described in Section 20.6 with the following changes:
• Enumeration of new LBR format: encoding 00111b in IA32_PERF_CAPABILITIES[5:0] is supported, see
Section 20.4.8.1.
• Each LBR stack entry consists of three MSRs:
- MSR_LASTBRANCH_x_FROM_IP, the layout is simplified, see Table 20-9.
- MSR_LASTBRANCH_x_TO_IP, the layout is the same as Table 20-9.
- MSR_LBR_INFO_x, stores branch prediction flag, TSX info, and elapsed cycle data. Layout is the same as
Table 20-16.
20.8
LAST BRANCH, INTERRUPT, AND EXCEPTION RECORDING FOR INTEL®
XEON PHI™ PROCESSOR 7200/5200/3200
The last branch record stack and top-of-stack (TOS) pointer MSRs are supported in the Intel® Xeon Phi™ processor
7200/5200/3200 series based on the Knights Landing microarchitecture. Eight pairs of MSRs are supported in the
LBR stack, per thread:
• Last Branch Record (LBR) Stack
- MSR_LASTBRANCH_0_FROM_IP (address 680H) through MSR_LASTBRANCH_7_FROM_IP (address 687H)
store source addresses.
- MSR_LASTBRANCH_0_TO_IP (address 6C0H) through MSR_LASTBRANCH_7_TO_IP (address 6C7H) store
destination addresses.
• Last Branch Record Top-of-Stack (TOS) Pointer - The lowest significant 3 bits of the TOS Pointer MSR
(MSR_LASTBRANCH_TOS, address 1C9H) contains a pointer to the MSR in the LBR stack that contains the
most recent branch, interrupt, or exception recorded.
LBR filtering is supported. Filtering of LBRs based on a combination of CPL and branch type conditions is supported.
When LBR filtering is enabled, the LBR stack only captures the subset of branches that are specified by MSR_L-
BR_SELECT. The layout of MSR_LBR_SELECT is described in Table 20-11.
The address format written in the FROM_IP/TO_IP MSRS may differ between processors. Software should query
IA32_PERF_CAPABILITIES[5:0] and consult Section 20.4.8.1.The behavior of the MSR_LER_TO_LIP and the
MSR_LER_FROM_LIP MSRs corresponds to that of the LastExceptionToIP and LastExceptionFromIP MSRs found in
the P6 family processors.
20.9
LAST BRANCH, INTERRUPT, AND EXCEPTION RECORDING FOR
PROCESSORS BASED ON NEHALEM MICROARCHITECTURE
The processors based on Nehalem microarchitecture and Westmere microarchitecture support last branch inter-
rupt and exception recording. These capabilities are similar to those found in Intel Core 2 processors and add addi-
tional capabilities:
• Debug Trace and Branch Recording Control - The IA32_DEBUGCTL MSR provides bit fields for software to
configure mechanisms related to debug trace, branch recording, branch trace store, and performance counter
operations. See Section 20.4.1 for a description of the flags. See Figure 20-11 for the MSR layout.
• Last branch record (LBR) stack - There are 16 MSR pairs that store the source and destination addresses
related to recently executed branches. See Section 20.9.1.
• Monitoring and single-stepping of branches, exceptions, and interrupts - See Section 20.4.2 and
Section 20.4.3. In addition, the ability to freeze the LBR stack on a PMI request is available.
Vol. 3B
20-29
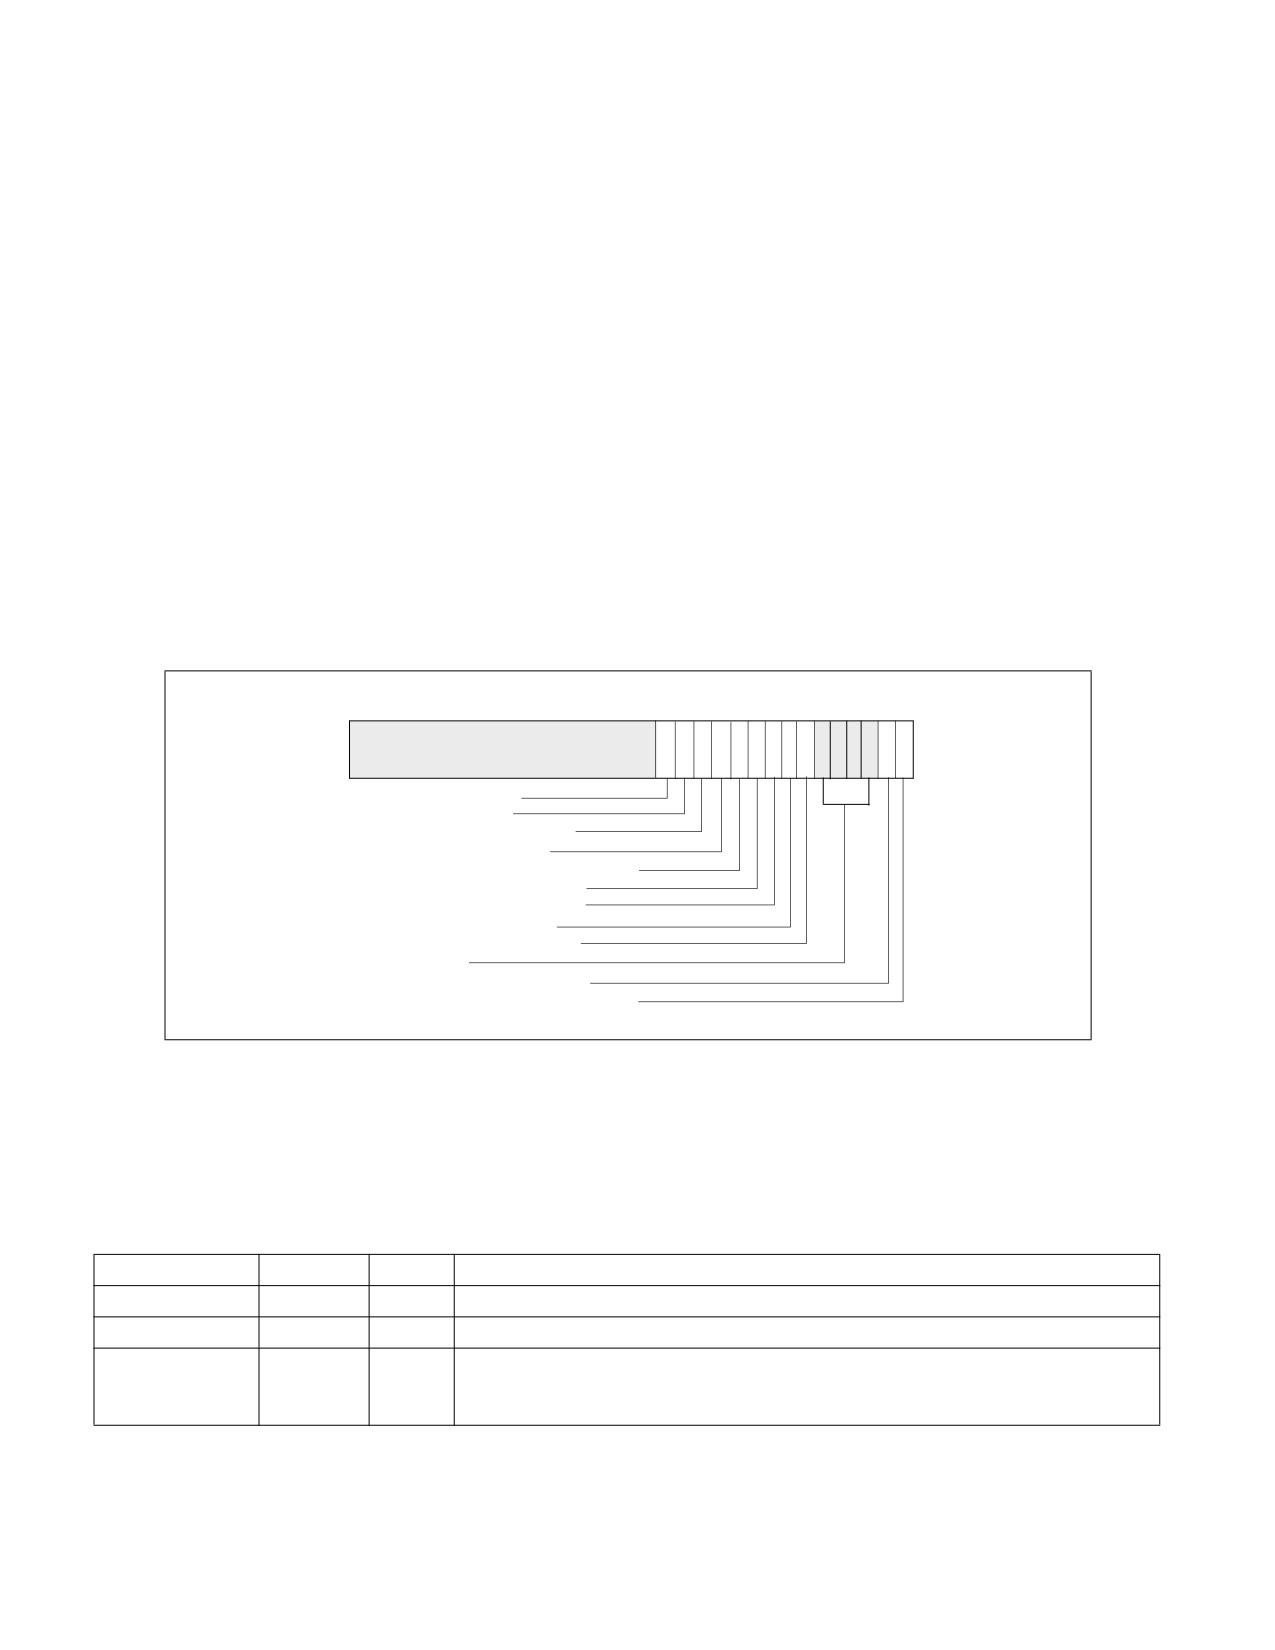
DEBUG, BRANCH PROFILE, TSC, AND INTEL® RESOURCE DIRECTOR TECHNOLOGY (INTEL® RDT) FEATURES
• Branch trace messages - The IA32_DEBUGCTL MSR provides bit fields for software to enable each logical
processor to generate branch trace messages. See Section 20.4.4. However, not all BTM messages are
observable using the Intel® QPI link.
• Last exception records - See Section 20.13.3.
• Branch trace store and CPL-qualified BTS - See Section 20.4.6 and Section 20.4.5.
• FREEZE_LBRS_ON_PMI flag (bit 11) - see Section 20.4.7 for legacy Freeze_LBRs_On_PMI operation.
• FREEZE_PERFMON_ON_PMI flag (bit 12) - see Section 20.4.7 for legacy Freeze_PerfMon_On_PMI
operation.
• UNCORE_PMI_EN (bit 13) - When set. this logical processor is enabled to receive an counter overflow
interrupt form the uncore.
• FREEZE_WHILE_SMM (bit 14) - FREEZE_WHILE_SMM is supported if IA32_PERF_CAPABIL-
ITIES.FREEZE_WHILE_SMM[Bit 12] is reporting 1. See Section 20.4.1.
Processors based on Nehalem microarchitecture provide additional capabilities:
• Independent control of uncore PMI - The IA32_DEBUGCTL MSR provides a bit field (see Figure 20-11) for
software to enable each logical processor to receive an uncore counter overflow interrupt.
• LBR filtering - Processors based on Nehalem microarchitecture support filtering of LBR based on combination
of CPL and branch type conditions. When LBR filtering is enabled, the LBR stack only captures the subset of
branches that are specified by MSR_LBR_SELECT.
31
14
13
12 11
10
9
8 7 6 5 4 3 2 1
0
Reserved
FREEZE_WHILE_SMM
UNCORE_PMI_EN
FREEZE_PERFMON_ON_PMI
FREEZE_LBRS_ON_PMI
BTS_OFF_USR - BTS off in user code
BTS_OFF_OS - BTS off in OS
BTINT - Branch trace interrupt
BTS - Branch trace store
TR - Trace messages enable
Reserved
BTF - Single-step on branches
LBR - Last branch/interrupt/exception
Figure 20-11. IA32_DEBUGCTL MSR for Processors Based on Nehalem Microarchitecture
20.9.1 LBR Stack
Processors based on Nehalem microarchitecture provide 16 pairs of MSR to record last branch record information.
The layout of each MSR pair is shown in Table 20-8 and Table 20-9.
Table 20-8. MSR_LASTBRANCH_x_FROM_IP
Bit Field
Bit Offset
Access
Description
Data
47:0
R/W
This is the “branch from” address. See Section 20.4.8.1 for address format.
SIGN_EXt
62:48
R/W
Signed extension of bit 47 of this register.
MISPRED
63
R/W
When set, indicates either the target of the branch was mispredicted and/or the
direction (taken/non-taken) was mispredicted; otherwise, the target branch was
predicted.
20-30
Vol. 3B

DEBUG, BRANCH PROFILE, TSC, AND INTEL® RESOURCE DIRECTOR TECHNOLOGY (INTEL® RDT) FEATURES
Table 20-9. MSR_LASTBRANCH_x_TO_IP
Bit Field
Bit Offset
Access
Description
Data
47:0
R/W
This is the “branch to” address. See Section 20.4.8.1 for address format
SIGN_EXt
63:48
R/W
Signed extension of bit 47 of this register.
Processors based on Nehalem microarchitecture have an LBR MSR Stack as shown in Table 20-10.
Table 20-10. LBR Stack Size and TOS Pointer Range
DisplayFamily_DisplayModel
Size of LBR Stack
Range of TOS Pointer
06_1AH
16
0 to 15
20.9.2 Filtering of Last Branch Records
MSR_LBR_SELECT is cleared to zero at RESET, and LBR filtering is disabled, i.e., all branches will be captured.
MSR_LBR_SELECT provides bit fields to specify the conditions of subsets of branches that will not be captured in
the LBR. The layout of MSR_LBR_SELECT is shown in Table 20-11.
Table 20-11. MSR_LBR_SELECT for Nehalem Microarchitecture
Bit Field
Bit Offset
Access
Description
CPL_EQ_0
0
R/W
When set, do not capture branches ending in ring 0
CPL_NEQ_0
1
R/W
When set, do not capture branches ending in ring >0
JCC
2
R/W
When set, do not capture conditional branches
NEAR_REL_CALL
3
R/W
When set, do not capture near relative calls
NEAR_IND_CALL
4
R/W
When set, do not capture near indirect calls
NEAR_RET
5
R/W
When set, do not capture near returns
NEAR_IND_JMP
6
R/W
When set, do not capture near indirect jumps
NEAR_REL_JMP
7
R/W
When set, do not capture near relative jumps
FAR_BRANCH
8
R/W
When set, do not capture far branches
Reserved
63:9
Must be zero
20.10 LAST BRANCH, INTERRUPT, AND EXCEPTION RECORDING FOR
PROCESSORS BASED ON SANDY BRIDGE MICROARCHITECTURE
Generally, all of the last branch record, interrupt, and exception recording facility described in Section 20.9, “Last
Branch, Interrupt, and Exception Recording for Processors based on Nehalem Microarchitecture,” apply to proces-
sors based on Sandy Bridge microarchitecture. For processors based on Ivy Bridge microarchitecture, the same
holds true.
One difference of note is that MSR_LBR_SELECT is shared between two logical processors in the same core. In
Sandy Bridge microarchitecture, each logical processor has its own MSR_LBR_SELECT. The filtering semantics for
“Near_ind_jmp” and “Near_rel_jmp” has been enhanced, see Table 20-12.
Vol. 3B
20-31

DEBUG, BRANCH PROFILE, TSC, AND INTEL® RESOURCE DIRECTOR TECHNOLOGY (INTEL® RDT) FEATURES
Table 20-12. MSR_LBR_SELECT for Sandy Bridge Microarchitecture
Bit Field
Bit Offset
Access
Description
CPL_EQ_0
0
R/W
When set, do not capture branches ending in ring 0
CPL_NEQ_0
1
R/W
When set, do not capture branches ending in ring >0
JCC
2
R/W
When set, do not capture conditional branches
NEAR_REL_CALL
3
R/W
When set, do not capture near relative calls
NEAR_IND_CALL
4
R/W
When set, do not capture near indirect calls
NEAR_RET
5
R/W
When set, do not capture near returns
NEAR_IND_JMP
6
R/W
When set, do not capture near indirect jumps except near indirect calls and near returns
NEAR_REL_JMP
7
R/W
When set, do not capture near relative jumps except near relative calls.
FAR_BRANCH
8
R/W
When set, do not capture far branches
Reserved
63:9
Must be zero
20.11 LAST BRANCH, CALL STACK, INTERRUPT, AND EXCEPTION RECORDING
FOR PROCESSORS BASED ON HASWELL MICROARCHITECTURE
Generally, all of the last branch record, interrupt, and exception recording facility described in Section 20.10, “Last
Branch, Interrupt, and Exception Recording for Processors based on Sandy Bridge Microarchitecture,” apply to next
generation processors based on Haswell microarchitecture.
The LBR facility also supports an alternate capability to profile call stack profiles. Configuring the LBR facility to
conduct call stack profiling is by writing 1 to the MSR_LBR_SELECT.EN_CALLSTACK[bit 9]; see Table 20-13. If
MSR_LBR_SELECT.EN_CALLSTACK is clear, the LBR facility will capture branches normally as described in Section
20.10.
Table 20-13. MSR_LBR_SELECT for Haswell Microarchitecture
Bit Field
Bit Offset
Access
Description
CPL_EQ_0
0
R/W
When set, do not capture branches ending in ring 0
CPL_NEQ_0
1
R/W
When set, do not capture branches ending in ring >0
JCC
2
R/W
When set, do not capture conditional branches
NEAR_REL_CALL
3
R/W
When set, do not capture near relative calls
NEAR_IND_CALL
4
R/W
When set, do not capture near indirect calls
NEAR_RET
5
R/W
When set, do not capture near returns
NEAR_IND_JMP
6
R/W
When set, do not capture near indirect jumps except near indirect calls and near returns
NEAR_REL_JMP
7
R/W
When set, do not capture near relative jumps except near relative calls.
FAR_BRANCH
8
R/W
When set, do not capture far branches
EN_CALLSTACK1
9
Enable LBR stack to use LIFO filtering to capture Call stack profile
Reserved
63:10
Must be zero
NOTES:
1. Must set valid combination of bits 0-8 in conjunction with bit 9 (as described below), otherwise the contents of the LBR MSRs are
undefined.
The call stack profiling capability is an enhancement of the LBR facility. The LBR stack is a ring buffer typically used
to profile control flow transitions resulting from branches. However, the finite depth of the LBR stack often become
less effective when profiling certain high-level languages (e.g., C++), where a transition of the execution flow is
accompanied by a large number of leaf function calls, each of which returns an individual parameter to form the list
20-32
Vol. 3B

DEBUG, BRANCH PROFILE, TSC, AND INTEL® RESOURCE DIRECTOR TECHNOLOGY (INTEL® RDT) FEATURES
of parameters for the main execution function call. A long list of such parameters returned by the leaf functions
would serve to flush the data captured in the LBR stack, often losing the main execution context.
When the call stack feature is enabled, the LBR stack will capture unfiltered call data normally, but as return
instructions are executed the last captured branch record is flushed from the on-chip registers in a last-in first-out
(LIFO) manner. Thus, branch information relative to leaf functions will not be captured, while preserving the call
stack information of the main line execution path.
The configuration of the call stack facility is summarized below:
• Set IA32_DEBUGCTL.LBR (bit 0) to enable the LBR stack to capture branch records. The source and target
addresses of the call branches will be captured in the 16 pairs of From/To LBR MSRs that form the LBR stack.
• Program the Top of Stack (TOS) MSR that points to the last valid from/to pair. This register is incremented by
1, modulo 16, before recording the next pair of addresses.
• Program the branch filtering bits of MSR_LBR_SELECT (bits 0:8) as desired.
• Program the MSR_LBR_SELECT to enable LIFO filtering of return instructions with:
- The following bits in MSR_LBR_SELECT must be set to ‘1’: JCC, NEAR_IND_JMP, NEAR_REL_JMP,
FAR_BRANCH, EN_CALLSTACK;
- The following bits in MSR_LBR_SELECT must be cleared: NEAR_REL_CALL, NEAR-IND_CALL, NEAR_RET;
- At most one of CPL_EQ_0, CPL_NEQ_0 is set.
Note that when call stack profiling is enabled, “zero length calls” are excluded from writing into the LBRs. (A “zero
length call” uses the attribute of the call instruction to push the immediate instruction pointer on to the stack and
then pops off that address into a register. This is accomplished without any matching return on the call.)
20.11.1 LBR Stack Enhancement
Processors based on Haswell microarchitecture provide 16 pairs of MSR to record last branch record information.
The layout of each MSR pair is enumerated by IA32_PERF_CAPABILITIES[5:0] = 04H, and is shown in Table 20-14
and Table 20-9.
Table 20-14. MSR_LASTBRANCH_x_FROM_IP with TSX Information
Bit Field
Bit Offset
Access
Description
Data
47:0
R/W
This is the “branch from” address. See Section 20.4.8.1 for address format.
SIGN_EXT
60:48
R/W
Signed extension of bit 47 of this register.
TSX_ABORT
61
R/W
When set, indicates a TSX Abort entry
LBR_FROM: EIP at the time of the TSX Abort
LBR_TO: EIP of the start of HLE region, or EIP of the RTM Abort Handler
IN_TSX
62
R/W
When set, indicates the entry occurred in a TSX region
MISPRED
63
R/W
When set, indicates either the target of the branch was mispredicted and/or the
direction (taken/non-taken) was mispredicted; otherwise, the target branch was
predicted.
20.12 LAST BRANCH, CALL STACK, INTERRUPT, AND EXCEPTION RECORDING
FOR PROCESSORS BASED ON SKYLAKE MICROARCHITECTURE
Processors based on the Skylake microarchitecture provide a number of enhancement with storing last branch
records:
• enumeration of new LBR format: encoding 00101b in IA32_PERF_CAPABILITIES[5:0] is supported, see Section
20.4.8.1.
• Each LBR stack entry consists of a triplets of MSRs:
Vol. 3B
20-33

DEBUG, BRANCH PROFILE, TSC, AND INTEL® RESOURCE DIRECTOR TECHNOLOGY (INTEL® RDT) FEATURES
- MSR_LASTBRANCH_x_FROM_IP, the layout is simplified, see Table 20-9.
- MSR_LASTBRANCH_x_TO_IP, the layout is the same as Table 20-9.
- MSR_LBR_INFO_x, stores branch prediction flag, TSX info, and elapsed cycle data.
• Size of LBR stack increased to 32.
Processors based on the Skylake microarchitecture support the same LBR filtering capabilities as described in
Table 20-13.
Table 20-15. LBR Stack Size and TOS Pointer Range
DisplayFamily_DisplayModel
Size of LBR Stack
Range of TOS Pointer
06_4EH, 06_5EH
32
0 to 31
20.12.1 MSR_LBR_INFO_x MSR
The layout of each MSR_LBR_INFO_x MSR is shown in Table 20-16.
Table 20-16. MSR_LBR_INFO_x
Bit Field
Bit Offset
Access
Description
Cycle Count
15:0
R/W
Elapsed core clocks since last update to the LBR stack.
(saturating)
Reserved
60:16
R/W
Reserved
TSX_ABORT
61
R/W
When set, indicates a TSX Abort entry
LBR_FROM: EIP at the time of the TSX Abort
LBR_TO: EIP of the start of HLE region OR
EIP of the RTM Abort Handler
IN_TSX
62
R/W
When set, indicates the entry occurred in a TSX region.
MISPRED
63
R/W
When set, indicates either the target of the branch was mispredicted and/or the
direction (taken/non-taken) was mispredicted; otherwise, the target branch was
predicted.
20.12.2 Streamlined Freeze_LBRs_On_PMI Operation
The FREEZE_LBRS_ON_PMI feature causes the LBRs to be frozen on a hardware request for a PMI. This prevents
the LBRs from being overwritten by new branches, allowing the PMI handler to examine the control flow that
preceded the PMI generation. Architectural performance monitoring version 4 and above supports a streamlined
FREEZE_LBRs_ON_PMI operation for PMI service routine that replaces the legacy FREEZE_LBRs_ON_PMI operation
(see Section 20.4.7).
While the legacy FREEZE_LBRS_ON_PMI clear the LBR bit in the IA32_DEBUGCTL MSR on a PMI request, the
streamlined FREEZE_LBRS_ON_PMI will set the LBR_FRZ bit in IA32_PERF_GLOBAL_STATUS. Branches will not
cause the LBRs to be updated when LBR_FRZ is set. Software can clear LBR_FRZ at the same time as it clears over-
flow bits by setting the LBR_FRZ bit as well as the needed overflow bit when writing to IA32_PERF_GLOBAL_STA-
TUS_RESET MSR.
This streamlined behavior avoids race conditions between software and processor writes to IA32_DEBUGCTL that
are possible with FREEZE_LBRS_ON_PMI clearing of the LBR enable.
20-34
Vol. 3B
DEBUG, BRANCH PROFILE, TSC, AND INTEL® RESOURCE DIRECTOR TECHNOLOGY (INTEL® RDT) FEATURES
20.12.3 LBR Behavior and Deep C-State
When MWAIT is used to request a C-state that is numerically higher than C1, then LBR state may be initialized to
zero depending on optimized “waiting” state that is selected by the processor The affected LBR states include the
FROM, TO, INFO, LAST_BRANCH, LER, and LBR_TOS registers. The LBR enable bit and LBR_FROZEN bit are not
affected. The LBR-time of the first LBR record inserted after an exit from such a C-state request will be zero.
20.13 LAST BRANCH, INTERRUPT, AND EXCEPTION RECORDING (PROCESSORS
BASED ON INTEL NETBURST® MICROARCHITECTURE)
Pentium 4 and Intel Xeon processors based on Intel NetBurst microarchitecture provide the following methods for
recording taken branches, interrupts, and exceptions:
• Store branch records in the last branch record (LBR) stack MSRs for the most recent taken branches,
interrupts, and/or exceptions in MSRs. A branch record consist of a branch-from and a branch-to instruction
address.
• Send the branch records out on the system bus as branch trace messages (BTMs).
• Log BTMs in a memory-resident branch trace store (BTS) buffer.
To support these functions, the processor provides the following MSRs and related facilities:
• MSR_DEBUGCTLA MSR - Enables last branch, interrupt, and exception recording; single-stepping on taken
branches; branch trace messages (BTMs); and branch trace store (BTS). This register is named DebugCtlMSR
in the P6 family processors.
• Debug store (DS) feature flag (CPUID.01H:EDX.DS[21]) - Indicates that the processor provides the
debug store (DS) mechanism, which allows BTMs to be stored in a memory-resident BTS buffer.
• CPL-qualified debug store (DS) feature flag (CPUID.01H:ECX.DS_CPL[4]) - Indicates that the
processor provides a CPL-qualified debug store (DS) mechanism, which allows software to selectively skip
sending and storing BTMs, according to specified current privilege level settings, into a memory-resident BTS
buffer.
• IA32_MISC_ENABLE MSR - Indicates that the processor provides the BTS facilities.
• Last branch record (LBR) stack - The LBR stack is a circular stack that consists of four MSRs (MSR_LAST-
BRANCH_0 through MSR_LASTBRANCH_3) for the Pentium 4 and Intel Xeon processor family [CPUID family
0FH, models 0H-02H]. The LBR stack consists of 16 MSR pairs (MSR_LASTBRANCH_0_FROM_IP through
MSR_LASTBRANCH_15_FROM_IP and MSR_LASTBRANCH_0_TO_IP through MSR_LASTBRANCH_15_TO_IP)
for the Pentium 4 and Intel Xeon processor family [CPUID family 0FH, model 03H].
• Last branch record top-of-stack (TOS) pointer - The TOS Pointer MSR contains a 2-bit pointer (0-3) to
the MSR in the LBR stack that contains the most recent branch, interrupt, or exception recorded for the
Pentium 4 and Intel Xeon processor family [CPUID family 0FH, models 0H-02H]. This pointer becomes a 4-bit
pointer (0-15) for the Pentium 4 and Intel Xeon processor family [CPUID family 0FH, model 03H]. See also:
Table 20-17, Figure 20-12, and Section 20.13.2, “LBR Stack for Processors Based on Intel NetBurst® Microar-
chitecture.”
• Last exception record - See Section 20.13.3, “Last Exception Records.”
20.13.1 MSR_DEBUGCTLA MSR
The MSR_DEBUGCTLA MSR enables and disables the various last branch recording mechanisms described in the
previous section. This register can be written to using the WRMSR instruction, when operating at privilege level 0
or when in real-address mode. A protected-mode operating system procedure is required to provide user access to
this register. Figure 20-12 shows the flags in the MSR_DEBUGCTLA MSR. The functions of these flags are as
follows:
• LBR (last branch/interrupt/exception) flag (bit 0) - When set, the processor records a running trace of
the most recent branches, interrupts, and/or exceptions taken by the processor (prior to a debug exception
being generated) in the last branch record (LBR) stack. Each branch, interrupt, or exception is recorded as a
64-bit branch record. The processor clears this flag whenever a debug exception is generated (for example,
Vol. 3B
20-35

DEBUG, BRANCH PROFILE, TSC, AND INTEL® RESOURCE DIRECTOR TECHNOLOGY (INTEL® RDT) FEATURES
when an instruction or data breakpoint or a single-step trap occurs). See Section 20.13.2, “LBR Stack for
Processors Based on Intel NetBurst® Microarchitecture.”
•
BTF (single-step on branches) flag (bit 1) - When set, the processor treats the TF flag in the EFLAGS
register as a “single-step on branches” flag rather than a “single-step on instructions” flag. This mechanism
allows single-stepping the processor on taken branches. See Section 20.4.3, “Single-Stepping on Branches.”
•
TR (trace message enable) flag (bit 2) - When set, branch trace messages are enabled. Thereafter, when
the processor detects a taken branch, interrupt, or exception, it sends the branch record out on the system bus
as a branch trace message (BTM). See Section 20.4.4, “Branch Trace Messages.”
31
7
6
5 4 3 2 1 0
Reserved
BTS_OFF_USR - Disable storing non-CPL_0 BTS
BTS_OFF_OS - Disable storing CPL_0 BTS
BTINT - Branch trace interrupt
BTS - Branch trace store
TR - Trace messages enable
BTF - Single-step on branches
LBR - Last branch/interrupt/exception
Figure 20-12. MSR_DEBUGCTLA MSR for Pentium 4 and Intel Xeon Processors
•
BTS (branch trace store) flag (bit 3) - When set, enables the BTS facilities to log BTMs to a memory-
resident BTS buffer that is part of the DS save area. See Section 20.4.9, “BTS and DS Save Area.”
•
BTINT (branch trace interrupt) flag (bits 4) - When set, the BTS facilities generate an interrupt when the
BTS buffer is full. When clear, BTMs are logged to the BTS buffer in a circular fashion. See Section 20.4.5, “Branch
Trace Store (BTS).”
•
BTS_OFF_OS (disable ring 0 branch trace store) flag (bit 5) - When set, enables the BTS facilities to
skip sending/logging CPL_0 BTMs to the memory-resident BTS buffer. See Section 20.13.2, “LBR Stack for
Processors Based on Intel NetBurst® Microarchitecture.”
•
BTS_OFF_USR (disable ring 0 branch trace store) flag (bit 6) - When set, enables the BTS facilities to
skip sending/logging non-CPL_0 BTMs to the memory-resident BTS buffer. See Section 20.13.2, “LBR Stack for
Processors Based on Intel NetBurst® Microarchitecture.”
NOTE
The initial implementation of BTS_OFF_USR and BTS_OFF_OS in MSR_DEBUGCTLA is shown in
Figure 20-12. The BTS_OFF_USR and BTS_OFF_OS fields may be implemented on other model-
specific debug control register at different locations.
See Chapter 2, “Model-Specific Registers (MSRs)‚” in the Intel® 64 and IA-32 Architectures Software Developer’s
Manual, Volume 4, for a detailed description of each of the last branch recording MSRs.
20.13.2 LBR Stack for Processors Based on Intel NetBurst® Microarchitecture
The LBR stack is made up of LBR MSRs that are treated by the processor as a circular stack. The TOS pointer
(MSR_LASTBRANCH_TOS MSR) points to the LBR MSR (or LBR MSR pair) that contains the most recent (last)
branch record placed on the stack. Prior to placing a new branch record on the stack, the TOS is incremented by 1.
When the TOS pointer reaches it maximum value, it wraps around to 0. See Table 20-17 and Figure 20-12.
20-36
Vol. 3B

DEBUG, BRANCH PROFILE, TSC, AND INTEL® RESOURCE DIRECTOR TECHNOLOGY (INTEL® RDT) FEATURES
Table 20-17. LBR MSR Stack Size and TOS Pointer Range for the Pentium® 4 and the Intel® Xeon® Processor Family
DisplayFamily_DisplayModel
Size of LBR Stack
Range of TOS Pointer
Family 0FH, Models 0H-02H; MSRs at locations 1DBH-1DEH.
4
0 to 3
Family 0FH, Models; MSRs at locations 680H-68FH.
16
0 to 15
Family 0FH, Model 03H; MSRs at locations 6C0H-6CFH.
16
0 to 15
The registers in the LBR MSR stack and the MSR_LASTBRANCH_TOS MSR are read-only and can be read using the
RDMSR instruction.
Figure 20-13 shows the layout of a branch record in an LBR MSR (or MSR pair). Each branch record consists of two
linear addresses, which represent the “from” and “to” instruction pointers for a branch, interrupt, or exception. The
contents of the from and to addresses differ, depending on the source of the branch:
• Taken branch - If the record is for a taken branch, the “from” address is the address of the branch instruction
and the “to” address is the target instruction of the branch.
• Interrupt - If the record is for an interrupt, the “from” address the return instruction pointer (RIP) saved for
the interrupt and the “to” address is the address of the first instruction in the interrupt handler routine. The RIP
is the linear address of the next instruction to be executed upon returning from the interrupt handler.
• Exception - If the record is for an exception, the “from” address is the linear address of the instruction that
caused the exception to be generated and the “to” address is the address of the first instruction in the
exception handler routine.
CPUID Family 0FH, Models 0H-02H
MSR_LASTBRANCH_0 through MSR_LASTBRANCH_3
63
32 - 31
0
To Linear Address
From Linear Address
CPUID Family 0FH, Model 03H-04H
MSR_LASTBRANCH_0_FROM_IP through MSR_LASTBRANCH_15_FROM_IP
63
32 - 31
0
Reserved
From Linear Address
MSR_LASTBRANCH_0_TO_IP through MSR_LASTBRANCH_15_TO_IP
63
32 - 31
0
Reserved
To Linear Address
Figure 20-13. LBR MSR Branch Record Layout for the Pentium 4 and Intel® Xeon® Processor Family
Additional information is saved if an exception or interrupt occurs in conjunction with a branch instruction. If a
branch instruction generates a trap type exception, two branch records are stored in the LBR stack: a branch
record for the branch instruction followed by a branch record for the exception.
If a branch instruction is immediately followed by an interrupt, a branch record is stored in the LBR stack for the
branch instruction followed by a record for the interrupt.
20.13.3 Last Exception Records
The Pentium 4, Intel Xeon, Pentium M, Intel® Core™ Solo, Intel® Core™ Duo, Intel® Core™2 Duo, Intel® Core™ i7
and Intel Atom® processors provide two MSRs (the MSR_LER_TO_LIP and the MSR_LER_FROM_LIP MSRs) that
duplicate the functions of the LastExceptionToIP and LastExceptionFromIP MSRs found in the P6 family processors.
Vol. 3B
20-37

DEBUG, BRANCH PROFILE, TSC, AND INTEL® RESOURCE DIRECTOR TECHNOLOGY (INTEL® RDT) FEATURES
The MSR_LER_TO_LIP and MSR_LER_FROM_LIP MSRs contain a branch record for the last branch that the
processor took prior to an exception or interrupt being generated.
20.14 LAST BRANCH, INTERRUPT, AND EXCEPTION RECORDING (INTEL® CORE™
SOLO AND INTEL® CORE™ DUO PROCESSORS)
Intel Core Solo and Intel Core Duo processors provide last branch interrupt and exception recording. This capability
is almost identical to that found in Pentium 4 and Intel Xeon processors. There are differences in the stack and in
some MSR names and locations.
Note the following:
• IA32_DEBUGCTL MSR - Enables debug trace interrupt, debug trace store, trace messages enable,
performance monitoring breakpoint flags, single stepping on branches, and last branch. IA32_DEBUGCTL MSR
is located at register address 01D9H.
See Figure 20-14 for the layout and the entries below for a description of the flags:
- LBR (last branch/interrupt/exception) flag (bit 0) - When set, the processor records a running trace
of the most recent branches, interrupts, and/or exceptions taken by the processor (prior to a debug
exception being generated) in the last branch record (LBR) stack. For more information, see the “Last
Branch Record (LBR) Stack” below.
- BTF (single-step on branches) flag (bit 1) - When set, the processor treats the TF flag in the EFLAGS
register as a “single-step on branches” flag rather than a “single-step on instructions” flag. This mechanism
allows single-stepping the processor on taken branches. See Section 20.4.3, “Single-Stepping on
Branches,” for more information about the BTF flag.
- TR (trace message enable) flag (bit 6) - When set, branch trace messages are enabled. When the
processor detects a taken branch, interrupt, or exception; it sends the branch record out on the system bus
as a branch trace message (BTM). See Section 20.4.4, “Branch Trace Messages,” for more information
about the TR flag.
- BTS (branch trace store) flag (bit 7) - When set, the flag enables BTS facilities to log BTMs to a
memory-resident BTS buffer that is part of the DS save area. See Section 20.4.9, “BTS and DS Save Area.”
- BTINT (branch trace interrupt) flag (bits 8) - When set, the BTS facilities generate an interrupt when
the BTS buffer is full. When clear, BTMs are logged to the BTS buffer in a circular fashion. See Section 20.4.5,
“Branch Trace Store (BTS),” for a description of this mechanism.
31
8 7 6 5 4 3 2 1
0
Reserved
BTINT - Branch trace interrupt
BTS - Branch trace store
TR - Trace messages enable
Reserved
BTF - Single-step on branches
LBR - Last branch/interrupt/exception
Figure 20-14. IA32_DEBUGCTL MSR for Intel® Core™ Solo and Intel® Core™ Duo Processors
• Debug store (DS) feature flag (bit 21), returned by the CPUID instruction - Indicates that the
processor provides the debug store (DS) mechanism, which allows BTMs to be stored in a memory-resident
BTS buffer. See Section 20.4.5, “Branch Trace Store (BTS).”
• Last Branch Record (LBR) Stack - The LBR stack consists of 8 MSRs (MSR_LASTBRANCH_0 through
MSR_LASTBRANCH_7); bits 31-0 hold the ‘from’ address, bits 63-32 hold the ‘to’ address (MSR addresses start
at 40H). See Figure 20-15.
20-38
Vol. 3B

DEBUG, BRANCH PROFILE, TSC, AND INTEL® RESOURCE DIRECTOR TECHNOLOGY (INTEL® RDT) FEATURES
• Last Branch Record Top-of-Stack (TOS) Pointer - The TOS Pointer MSR contains a 3-bit pointer (bits 2-
0) to the MSR in the LBR stack that contains the most recent branch, interrupt, or exception recorded. For Intel
Core Solo and Intel Core Duo processors, this MSR is located at register address 01C9H.
For compatibility, the Intel Core Solo and Intel Core Duo processors provide two 32-bit MSRs (the
MSR_LER_TO_LIP and the MSR_LER_FROM_LIP MSRs) that duplicate functions of the LastExceptionToIP and Last-
ExceptionFromIP MSRs found in P6 family processors.
For details, see Section 20.12, “Last Branch, Call Stack, Interrupt, and Exception Recording for Processors based
on Skylake Microarchitecture,” and Section 2.20, “MSRs In Intel® Core™ Solo and Intel® Core™ Duo Processors,”
in the Intel® 64 and IA-32 Architectures Software Developer’s Manual, Volume 4.
MSR_LASTBRANCH_0 through MSR_LASTBRANCH_7
63
32 - 31
0
T
o Linear Address
From Linear Address
Figure 20-15. LBR Branch Record Layout for the Intel® Core™ Solo and Intel® Core™ Duo Processor
20.15 LAST BRANCH, INTERRUPT, AND EXCEPTION RECORDING (PENTIUM M
PROCESSORS)
Like the Pentium 4 and Intel Xeon processor family, Pentium M processors provide last branch interrupt and excep-
tion recording. The capability operates almost identically to that found in Pentium 4 and Intel Xeon processors.
There are differences in the shape of the stack and in some MSR names and locations. Note the following:
• MSR_DEBUGCTLB MSR - Enables debug trace interrupt, debug trace store, trace messages enable,
performance monitoring breakpoint flags, single stepping on branches, and last branch. For Pentium M
processors, this MSR is located at register address 01D9H. See Figure 20-16 and the entries below for a
description of the flags.
- LBR (last branch/interrupt/exception) flag (bit 0) - When set, the processor records a running trace
of the most recent branches, interrupts, and/or exceptions taken by the processor (prior to a debug
exception being generated) in the last branch record (LBR) stack. For more information, see the “Last
Branch Record (LBR) Stack” bullet below.
- BTF (single-step on branches) flag (bit 1) - When set, the processor treats the TF flag in the EFLAGS
register as a “single-step on branches” flag rather than a “single-step on instructions” flag. This mechanism
allows single-stepping the processor on taken branches. See Section 20.4.3, “Single-Stepping on
Branches,” for more information about the BTF flag.
- PBi (performance monitoring/breakpoint pins) flags (bits 5-2) - When these flags are set, the
performance monitoring/breakpoint pins on the processor (BP0#, BP1#, BP2#, and BP3#) report
breakpoint matches in the corresponding breakpoint-address registers (DR0 through DR3). The processor
asserts then deasserts the corresponding BPi# pin when a breakpoint match occurs. When a PBi flag is
clear, the performance monitoring/breakpoint pins report performance events. Processor execution is not
affected by reporting performance events.
- TR (trace message enable) flag (bit 6) - When set, branch trace messages are enabled. When the
processor detects a taken branch, interrupt, or exception, it sends the branch record out on the system bus
as a branch trace message (BTM). See Section 20.4.4, “Branch Trace Messages,” for more information
about the TR flag.
- BTS (branch trace store) flag (bit 7) - When set, enables the BTS facilities to log BTMs to a memory-
resident BTS buffer that is part of the DS save area. See Section 20.4.9, “BTS and DS Save Area.”
- BTINT (branch trace interrupt) flag (bits 8) - When set, the BTS facilities generate an interrupt when
the BTS buffer is full. When clear, BTMs are logged to the BTS buffer in a circular fashion. See Section 20.4.5,
“Branch Trace Store (BTS),” for a description of this mechanism.
Vol. 3B
20-39

DEBUG, BRANCH PROFILE, TSC, AND INTEL® RESOURCE DIRECTOR TECHNOLOGY (INTEL® RDT) FEATURES
31
8 7 6 5 4 3 2 1
0
Reserved
BTINT - Branch trace interrupt
BTS - Branch trace store
TR - Trace messages enable
PB3/2/1/0 - Performance monitoring breakpoint flags
BTF - Single-step on branches
LBR - Last branch/interrupt/exception
Figure 20-16. MSR_DEBUGCTLB MSR for Pentium M Processors
• Debug store (DS) feature flag (bit 21), returned by the CPUID instruction - Indicates that the
processor provides the debug store (DS) mechanism, which allows BTMs to be stored in a memory-resident
BTS buffer. See Section 20.4.5, “Branch Trace Store (BTS).”
• Last Branch Record (LBR) Stack - The LBR stack consists of 8 MSRs (MSR_LASTBRANCH_0 through
MSR_LASTBRANCH_7); bits 31-0 hold the ‘from’ address, bits 63-32 hold the ‘to’ address. For Pentium M
Processors, these pairs are located at register addresses 040H-047H. See Figure 20-17.
• Last Branch Record Top-of-Stack (TOS) Pointer - The TOS Pointer MSR contains a 3-bit pointer (bits 2-0)
to the MSR in the LBR stack that contains the most recent branch, interrupt, or exception recorded. For Pentium
M Processors, this MSR is located at register address 01C9H.
MSR_LASTBRANCH_0
through MSR_LASTBRANCH_7
63
32 - 31
0
T
o Linear Address
From Linear Address
Figure 20-17. LBR Branch Record Layout for the Pentium M Processor
For more detail on these capabilities, see Section 20.13.3, “Last Exception Records,” and Section 2.21, “MSRs In
the Pentium M Processor,” in the Intel® 64 and IA-32 Architectures Software Developer’s Manual, Volume 4.
20.16 LAST BRANCH, INTERRUPT, AND EXCEPTION RECORDING (P6 FAMILY
PROCESSORS)
The P6 family processors provide five MSRs for recording the last branch, interrupt, or exception taken by the
processor: DEBUGCTLMSR, LastBranchToIP, LastBranchFromIP, LastExceptionToIP, and LastExceptionFromIP.
These registers can be used to collect last branch records, to set breakpoints on branches, interrupts, and excep-
tions, and to single-step from one branch to the next.
See Chapter 2, “Model-Specific Registers (MSRs)‚” in the Intel® 64 and IA-32 Architectures Software Developer’s
Manual, Volume 4, for a detailed description of each of the last branch recording MSRs.
20.16.1 DEBUGCTLMSR Register
The version of the DEBUGCTLMSR register found in the P6 family processors enables last branch, interrupt, and
exception recording; taken branch breakpoints; the breakpoint reporting pins; and trace messages. This register
can be written to using the WRMSR instruction, when operating at privilege level 0 or when in real-address mode.
20-40
Vol. 3B

DEBUG, BRANCH PROFILE, TSC, AND INTEL® RESOURCE DIRECTOR TECHNOLOGY (INTEL® RDT) FEATURES
A protected-mode operating system procedure is required to provide user access to this register. Figure 20-18
shows the flags in the DEBUGCTLMSR register for the P6 family processors. The functions of these flags are as
follows:
• LBR (last branch/interrupt/exception) flag (bit 0) - When set, the processor records the source and
target addresses (in the LastBranchToIP, LastBranchFromIP, LastExceptionToIP, and LastExceptionFromIP
MSRs) for the last branch and the last exception or interrupt taken by the processor prior to a debug exception
being generated. The processor clears this flag whenever a debug exception, such as an instruction or data
breakpoint or single-step trap occurs.
31
7 6 5 4 3 2 1 0
P
P
P
P
B
L
Reserved
T
B
B
B
B
T
B
R
3
2
1
0
F
R
TR - Trace messages enable
PBi - Performance monitoring/breakpoint pins
BTF - Single-step on branches
LBR - Last branch/interrupt/exception
Figure 20-18. DEBUGCTLMSR Register (P6 Family Processors)
• BTF (single-step on branches) flag (bit 1) - When set, the processor treats the TF flag in the EFLAGS
register as a “single-step on branches” flag. See Section 20.4.3, “Single-Stepping on Branches.”
• PBi (performance monitoring/breakpoint pins) flags (bits 2 through 5) - When these flags are set,
the performance monitoring/breakpoint pins on the processor (BP0#, BP1#, BP2#, and BP3#) report
breakpoint matches in the corresponding breakpoint-address registers (DR0 through DR3). The processor
asserts then deasserts the corresponding BPi# pin when a breakpoint match occurs. When a PBi flag is clear,
the performance monitoring/breakpoint pins report performance events. Processor execution is not affected by
reporting performance events.
• TR (trace message enable) flag (bit 6) - When set, trace messages are enabled as described in Section
20.4.4, “Branch Trace Messages.” Setting this flag greatly reduces the performance of the processor. When
trace messages are enabled, the values stored in the LastBranchToIP, LastBranchFromIP, LastExceptionToIP,
and LastExceptionFromIP MSRs are undefined.
20.16.2 Last Branch and Last Exception MSRs
The LastBranchToIP and LastBranchFromIP MSRs are 32-bit registers for recording the instruction pointers for the
last branch, interrupt, or exception that the processor took prior to a debug exception being generated. When a
branch occurs, the processor loads the address of the branch instruction into the LastBranchFromIP MSR and loads
the target address for the branch into the LastBranchToIP MSR.
When an interrupt or exception occurs (other than a debug exception), the address of the instruction that was
interrupted by the exception or interrupt is loaded into the LastBranchFromIP MSR and the address of the excep-
tion or interrupt handler that is called is loaded into the LastBranchToIP MSR.
The LastExceptionToIP and LastExceptionFromIP MSRs (also 32-bit registers) record the instruction pointers for
the last branch that the processor took prior to an exception or interrupt being generated. When an exception or
interrupt occurs, the contents of the LastBranchToIP and LastBranchFromIP MSRs are copied into these registers
before the to and from addresses of the exception or interrupt are recorded in the LastBranchToIP and LastBranch-
FromIP MSRs.
These registers can be read using the RDMSR instruction.
Note that the values stored in the LastBranchToIP, LastBranchFromIP, LastExceptionToIP, and LastException-
FromIP MSRs are offsets into the current code segment, as opposed to linear addresses, which are saved in last
branch records for the Pentium 4 and Intel Xeon processors.
Vol. 3B
20-41
DEBUG, BRANCH PROFILE, TSC, AND INTEL® RESOURCE DIRECTOR TECHNOLOGY (INTEL® RDT) FEATURES
20.16.3 Monitoring Branches, Exceptions, and Interrupts
When the LBR flag in the DEBUGCTLMSR register is set, the processor automatically begins recording branches that
it takes, exceptions that are generated (except for debug exceptions), and interrupts that are serviced. Each time
a branch, exception, or interrupt occurs, the processor records the to and from instruction pointers in the Last-
BranchToIP and LastBranchFromIP MSRs. In addition, for interrupts and exceptions, the processor copies the
contents of the LastBranchToIP and LastBranchFromIP MSRs into the LastExceptionToIP and LastExceptionFromIP
MSRs prior to recording the to and from addresses of the interrupt or exception.
When the processor generates a debug exception (#DB), it automatically clears the LBR flag before executing the
exception handler, but does not touch the last branch and last exception MSRs. The addresses for the last branch,
interrupt, or exception taken are thus retained in the LastBranchToIP and LastBranchFromIP MSRs and the
addresses of the last branch prior to an interrupt or exception are retained in the LastExceptionToIP, and LastEx-
ceptionFromIP MSRs.
The debugger can use the last branch, interrupt, and/or exception addresses in combination with code-segment
selectors retrieved from the stack to reset breakpoints in the breakpoint-address registers (DR0 through DR3),
allowing a backward trace from the manifestation of a particular bug toward its source. Because the instruction
pointers recorded in the LastBranchToIP, LastBranchFromIP, LastExceptionToIP, and LastExceptionFromIP MSRs
are offsets into a code segment, software must determine the segment base address of the code segment associ-
ated with the control transfer to calculate the linear address to be placed in the breakpoint-address registers. The
segment base address can be determined by reading the segment selector for the code segment from the stack
and using it to locate the segment descriptor for the segment in the GDT or LDT. The segment base address can
then be read from the segment descriptor.
Before resuming program execution from a debug-exception handler, the handler must set the LBR flag again to re-
enable last branch and last exception/interrupt recording.
20.17 TIME-STAMP COUNTER
The Intel 64 and IA-32 architectures (beginning with the Pentium processor) define a time-stamp counter mecha-
nism that can be used to monitor and identify the relative time occurrence of processor events. The counter’s archi-
tecture includes the following components:
• TSC flag - A feature bit that indicates the availability of the time-stamp counter. The counter is available in an
if the function CPUID.01H:EDX.TSC[4] = 1.
• IA32_TIME_STAMP_COUNTER MSR (called TSC MSR in P6 family and Pentium processors) - The MSR used
as the counter.
• RDTSC instruction - An instruction used to read the time-stamp counter.
• TSD flag - A control register flag is used to enable or disable the time-stamp counter (enabled if
CR4.TSD[bit 2] = 1).
The time-stamp counter (as implemented in the P6 family, Pentium, Pentium M, Pentium 4, Intel Xeon, Intel Core
Solo and Intel Core Duo processors and later processors) is a 64-bit counter that is set to 0 following a RESET of
the processor. Following a RESET, the counter increments even when the processor is halted by the HLT instruction
or the external STPCLK# pin. Note that the assertion of the external DPSLP# pin may cause the time-stamp
counter to stop.
Processor families increment the time-stamp counter differently:
• For Pentium M processors (family [06H], models [09H, 0DH]); for Pentium 4 processors, Intel Xeon processors
(family [0FH], models [00H, 01H, or 02H]); and for P6 family processors: the time-stamp counter increments
with every internal processor clock cycle.
The internal processor clock cycle is determined by the current core-clock to bus-clock ratio. Intel®
SpeedStep® technology transitions may also impact the processor clock.
• For Pentium 4 processors, Intel Xeon processors (family [0FH], models [03H and higher]); for Intel Core Solo
and Intel Core Duo processors (family [06H], model [0EH]); for the Intel Xeon processor 5100 series and Intel
Core 2 Duo processors (family [06H], model [0FH]); for Intel Core 2 and Intel Xeon processors (family [06H],
DisplayModel [17H]); for Intel Atom processors (family [06H], DisplayModel [1CH]): the time-stamp counter
increments at a constant rate. That rate may be set by the maximum core-clock to bus-clock ratio of the
20-42
Vol. 3B
DEBUG, BRANCH PROFILE, TSC, AND INTEL® RESOURCE DIRECTOR TECHNOLOGY (INTEL® RDT) FEATURES
processor or may be set by the maximum resolved frequency at which the processor is booted. The maximum
resolved frequency may differ from the processor base frequency, see Section 22.7.2 for more detail. On
certain processors, the TSC frequency may not be the same as the frequency in the brand string.
The specific processor configuration determines the behavior. Constant TSC behavior ensures that the duration
of each clock tick is uniform and supports the use of the TSC as a wall clock timer even if the processor core
changes frequency. This is the architectural behavior moving forward.
NOTE
To determine average processor clock frequency, Intel recommends the use of performance
monitoring logic to count processor core clocks over the period of time for which the average is
required. See Section 22.6.4.5, “Counting Clocks on systems with Intel® Hyper-Threading
Technology in Processors Based on Intel NetBurst® Microarchitecture,” and https://perfmon-
events.intel.com/ for more information.
The RDTSC instruction reads the time-stamp counter and is guaranteed to return a monotonically increasing
unique value whenever executed, except for a 64-bit counter wraparound. Intel guarantees that the time-stamp
counter will not wraparound within 10 years after being reset. The period for counter wrap is longer for Pentium 4,
Intel Xeon, P6 family, and Pentium processors.
Normally, the RDTSC instruction can be executed by programs and procedures running at any privilege level and in
virtual-8086 mode. The TSD flag allows use of this instruction to be restricted to programs and procedures running
at privilege level 0. A secure operating system would set the TSD flag during system initialization to disable user
access to the time-stamp counter. An operating system that disables user access to the time-stamp counter should
emulate the instruction through a user-accessible programming interface.
The RDTSC instruction is not serializing or ordered with other instructions. It does not necessarily wait until all
previous instructions have been executed before reading the counter. Similarly, subsequent instructions may begin
execution before the RDTSC instruction operation is performed.
The RDMSR and WRMSR instructions read and write the time-stamp counter, treating the time-stamp counter as
an ordinary MSR (address 10H). In the Pentium 4, Intel Xeon, and P6 family processors, all 64-bits of the time-
stamp counter are read using RDMSR (just as with RDTSC). When WRMSR is used to write the time-stamp counter
on processors before family [0FH], models [03H, 04H]: only the low-order 32-bits of the time-stamp counter can
be written (the high-order 32 bits are cleared to 0). For family [0FH], models [03H, 04H, 06H]; for family [06H]],
model [0EH, 0FH]; for family [06H]], DisplayModel [17H, 1AH, 1CH, 1DH]: all 64 bits are writable.
20.17.1 Invariant TSC
The time stamp counter in newer processors may support an enhancement, referred to as invariant TSC.
Processor’s support for invariant TSC is indicated by CPUID.80000007H:EDX[8].
The invariant TSC will run at a constant rate in all ACPI P-, C-. and T-states. This is the architectural behavior
moving forward. On processors with invariant TSC support, the OS may use the TSC for wall clock timer services
(instead of ACPI or HPET timers). TSC reads are much more efficient and do not incur the overhead associated with
a ring transition or access to a platform resource.
20.17.2 IA32_TSC_AUX Register and RDTSCP Support
Processors based on Nehalem microarchitecture provide an auxiliary TSC register, IA32_TSC_AUX that is designed
to be used in conjunction with IA32_TSC. IA32_TSC_AUX provides a 32-bit field that is initialized by privileged
software with a signature value (for example, a logical processor ID).
The primary usage of IA32_TSC_AUX in conjunction with IA32_TSC is to allow software to read the 64-bit time
stamp in IA32_TSC and signature value in IA32_TSC_AUX with the instruction RDTSCP in an atomic operation.
RDTSCP returns the 64-bit time stamp in EDX:EAX and the 32-bit TSC_AUX signature value in ECX. The atomicity
of RDTSCP ensures that no context switch can occur between the reads of the TSC and TSC_AUX values.
Support for RDTSCP is indicated by CPUID.80000001H:EDX[27]. As with RDTSC instruction, non-ring 0 access is
controlled by CR4.TSD (Time Stamp Disable flag).
Vol. 3B
20-43
DEBUG, BRANCH PROFILE, TSC, AND INTEL® RESOURCE DIRECTOR TECHNOLOGY (INTEL® RDT) FEATURES
User mode software can use RDTSCP to detect if CPU migration has occurred between successive reads of the TSC.
It can also be used to adjust for per-CPU differences in TSC values in a NUMA system.
20.17.3 Time-Stamp Counter Adjustment
Software can modify the value of the time-stamp counter (TSC) of a logical processor by using the WRMSR instruc-
tion to write to the IA32_TIME_STAMP_COUNTER MSR (address 10H). Because such a write applies only to that
logical processor, software seeking to synchronize the TSC values of multiple logical processors must perform these
writes on each logical processor. It may be difficult for software to do this in a way that ensures that all logical
processors will have the same value for the TSC at a given point in time.
The synchronization of TSC adjustment can be simplified by using the 64-bit IA32_TSC_ADJUST MSR (address
3BH). Like the IA32_TIME_STAMP_COUNTER MSR, the IA32_TSC_ADJUST MSR is maintained separately for each
logical processor. A logical processor maintains and uses the IA32_TSC_ADJUST MSR as follows:
• On RESET, the value of the IA32_TSC_ADJUST MSR is 0.
• If an execution of WRMSR to the IA32_TIME_STAMP_COUNTER MSR adds (or subtracts) value X from the TSC,
the logical processor also adds (or subtracts) value X from the IA32_TSC_ADJUST MSR.
• If an execution of WRMSR to the IA32_TSC_ADJUST MSR adds (or subtracts) value X from that MSR, the logical
processor also adds (or subtracts) value X from the TSC.
Unlike the TSC, the value of the IA32_TSC_ADJUST MSR changes only in response to WRMSR (either to the MSR
itself, or to the IA32_TIME_STAMP_COUNTER MSR). Its value does not otherwise change as time elapses. Software
seeking to adjust the TSC can do so by using WRMSR to write the same value to the IA32_TSC_ADJUST MSR on
each logical processor.
Processor support for the IA32_TSC_ADJUST MSR is indicated by CPUID.07H.00H:EBX.TSC_ADJUST (bit 1).
20.17.4 Invariant Time-Keeping
The invariant TSC is based on the invariant timekeeping hardware (called Always Running Timer or ART), that runs
at the core crystal clock frequency. The ratio defined by CPUID.15H expresses the frequency relationship between
the ART hardware and TSC.
If CPUID.15H:EBX[31:0] != 0 and CPUID.80000007H:EDX.TSC_INVARIANT = 1, the following linearity relation-
ship holds between TSC and the ART hardware:
TSC_Value = (ART_Value * CPUID.15H:EBX[31:0])/CPUID.15H:EAX[31:0] + K
Where 'K' is an offset that can be adjusted by a privileged agent1.
When ART hardware is reset, both invariant TSC and K are also reset.
20.18 INTEL® RESOURCE DIRECTOR TECHNOLOGY (INTEL® RDT) MONITORING
FEATURES
The Intel Resource Director Technology (Intel RDT) feature set provides a set of monitoring capabilities including
Cache Monitoring Technology (CMT) and Memory Bandwidth Monitoring (MBM). The Intel® Xeon® processor E5 v3
family introduced resource monitoring capability in each logical processor to measure specific platform shared
resource metrics, for example, L3 cache occupancy. The programming interface for these monitoring features is
described in this section. Two features within the monitoring feature set provided are described - Cache Monitoring
Technology (CMT) and Memory Bandwidth Monitoring.
Cache Monitoring Technology (CMT) allows an Operating System, Hypervisor or similar system management agent
to determine the usage of cache by applications running on the platform. The initial implementation is directed at
L3 cache monitoring (currently the last level cache in most server platforms).
1. IA32_TSC_ADJUST MSR and the TSC-offset field in the VM execution controls of VMCS are some of the common interfaces that priv-
ileged software can use to manage the time stamp counter for keeping time
20-44
Vol. 3B
DEBUG, BRANCH PROFILE, TSC, AND INTEL® RESOURCE DIRECTOR TECHNOLOGY (INTEL® RDT) FEATURES
Memory Bandwidth Monitoring (MBM), introduced in the Intel® Xeon® processor E5 v4 family, builds on the CMT
infrastructure to allow monitoring of bandwidth from one level of the cache hierarchy to the next - in this case
focusing on the L3 cache, which is typically backed directly by system memory. As a result of this implementation,
memory bandwidth can be monitored.
The monitoring mechanisms described provide the following key shared infrastructure features:
• A mechanism to enumerate the presence of the monitoring capabilities within the platform (via a CPUID feature
bit).
• A framework to enumerate the details of each sub-feature (including CMT and MBM, as discussed later, via
CPUID leaves and sub-leaves).
• A mechanism for the OS or Hypervisor to indicate a software-defined ID for each of the software threads (appli-
cations, virtual machines, etc.) that are scheduled to run on a logical processor. These identifiers are known as
Resource Monitoring IDs (RMIDs).
• Mechanisms in hardware to monitor cache occupancy and bandwidth statistics as applicable to a given product
generation on a per software-id basis.
• Mechanisms for the OS or Hypervisor to read back the collected metrics such as L3 occupancy or Memory
Bandwidth for a given software ID at any point during runtime.
20.18.1 Overview of Cache Monitoring Technology and Memory Bandwidth Monitoring
The shared resource monitoring features described in this chapter provide a layer of abstraction between applica-
tions and logical processors through the use of Resource Monitoring IDs (RMIDs). Each logical processor in the
system can be assigned an RMID independently, or multiple logical processors can be assigned to the same RMID
value (e.g., to track an application with multiple threads). For each logical processor, only one RMID value is active
at a time. This is enforced by the IA32_PQR_ASSOC MSR, which specifies the active RMID of a logical processor.
Writing to this MSR by software changes the active RMID of the logical processor from an old value to a new value.
The underlying platform shared resource monitoring hardware tracks cache metrics such as cache utilization and
misses as a result of memory accesses according to the RMIDs and reports monitored data via a counter register
(IA32_QM_CTR). The specific event types supported vary by generation and can be enumerated via CPUID. To
read back monitored data, software configures an event selection MSR (IA32_QM_EVTSEL) to specify which metric
is to be reported and the specific RMID for which the data should be returned.
Processor support of the monitoring framework and sub-features such as CMT is reported via the CPUID instruc-
tion. The resource type available to the monitoring framework is enumerated via a new leaf function in CPUID.
Reading and writing to the monitoring MSRs requires the RDMSR and WRMSR instructions.
The Cache Monitoring Technology feature set provides the following unique mechanisms:
• A mechanism to enumerate the presence and details of the CMT feature as applicable to a given level of the
cache hierarchy, independent of other monitoring features.
• CMT-specific event codes to read occupancy for a given level of the cache hierarchy.
The Memory Bandwidth Monitoring feature provides the following unique mechanisms:
• A mechanism to enumerate the presence and details of the MBM feature as applicable to a given level of the
cache hierarchy, independent of other monitoring features.
• MBM-specific event codes to read bandwidth out to the next level of the hierarchy and various sub-event codes
to read more specific metrics as discussed later (e.g., total bandwidth vs. bandwidth only from local memory
controllers on the same package).
20.18.2 Enabling Monitoring: Usage Flow
Figure 20-19 illustrates the key steps for OS/VMM to detect support of shared resource monitoring features such
as CMT and enable resource monitoring for available resource types and monitoring events.
Vol. 3B
20-45

DEBUG, BRANCH PROFILE, TSC, AND INTEL® RESOURCE DIRECTOR TECHNOLOGY (INTEL® RDT) FEATURES
On OS/VMM Initialization
On Context Switch
Periodical Resource
Selection/Reporting
PQM Capability
Set RMID to monitor
Configure event type
Enumeration
the scheduled app
Read monitored data
CPUID[
WRMSR
RDMSR/WRMSR
CPUID.07H.00H:EBX[12]
IA32_PQR_ASSOC.RMID
IA32_QM_EVTSEL
CPUID.0FH.00H:EDX[31:1]
IA32_QM_CTR
CPUID.0FH.01H:ECX[31:0]
CPUID.0FH.01H:EDX[31:0]
CPUID.0FH.01H:EBX[31:0]
CPUID.0FH.00H:EBX[31:0]
Figure 20-19. Platform Shared Resource Monitoring Usage Flow
20.18.3 Enumeration and Detecting Support of Cache Monitoring Technology and Memory
Bandwidth Monitoring
Software can query processor support of shared resource monitoring features capabilities by executing CPUID
instruction with EAX = 07H, ECX = 0H as input. If CPUID.07H.00H:EBX.RDT_M[12] reports 1, the processor
provides the following programming interfaces for shared resource monitoring, including Cache Monitoring Tech-
nology:
• CPUID.0FH (Shared Resource Monitoring Enumeration leaf) provides information on available resource types
(see Section 20.18.4), and monitoring capabilities for each resource type (see Section 20.18.5). Note CMT and
MBM capabilities are enumerated as separate event vectors using shared enumeration infrastructure under a
given resource type.
• IA32_PQR_ASSOC.RMID: The per-logical-processor MSR, IA32_PQR_ASSOC, that OS/VMM can use to assign
an RMID to each logical processor, see Section 20.18.6.
• IA32_QM_EVTSEL: This MSR specifies an Event ID (EvtID) and an RMID which the platform uses to look up and
provide monitoring data in the monitoring counter, IA32_QM_CTR, see Section 20.18.7.
• IA32_QM_CTR: This MSR reports monitored resource data when available along with bits to allow software to
check for error conditions and verify data validity.
Software must follow the following sequence of enumeration to discover Cache Monitoring Technology capabilities:
1. Use CPUID.00H to discover the “cpuid_maxLeaf” supported in the processor;
2. If cpuid_maxLeaf >= 7, then verify CPUID.07H.00H:EBX.RDT_M[12] is set;
3. If CPUID.07H.00H:EBX.RDT_M[12] = 1, then use CPUID.0FH.00H to query available resource types that
support monitoring;
4. If CPUID.0FH.00H:EDX.CMT_L3[1] = 1, then use CPUID.0FH.01H to query the specific capabilities of L3 Cache
Monitoring Technology (CMT) and Memory Bandwidth Monitoring.
5. If CPUID.0FH.00H:EDX reports additional resource types supporting monitoring, then use CPUID.0FH.ResID for
a corresponding resource type ID (ResID) as enumerated by the bit position of CPUID.0FH.00H:EDX.
20.18.4 Monitoring Resource Type and Capability Enumeration
CPUID.0FH (Shared Resource Monitoring Enumeration leaf) provides one sub-leaf (sub-function 0) that reports
shared enumeration infrastructure, and one or more sub-functions that report feature-specific enumeration data:
• Monitoring leaf sub-function 0 enumerates available resources that support monitoring, i.e., use
CPUID.0FH.00H. In the initial implementation, L3 cache is the only resource type available. Each supported
resource type is represented by a bit in CPUID.0FH.00H:EDX[31:1]. The bit position corresponds to the sub-
leaf index (ResID) that software must use to query details of the monitoring capability of that resource type
(see Figure 20-21 and Figure 20-22). Reserved bits of CPUID.0FH.00H:EDX[31:2] correspond to unsupported
20-46
Vol. 3B

DEBUG, BRANCH PROFILE, TSC, AND INTEL® RESOURCE DIRECTOR TECHNOLOGY (INTEL® RDT) FEATURES
sub-leaves of the CPUID.0FH leaf. Additionally, CPUID.0FH.00H:EBX reports the highest RMID value of any
resource type that supports monitoring in the processor.
CPUID.0FH.00H Output: (EAX: Reserved; ECX: Reserved)
31
2
1
0
EDX
L
Reserved
3
31
0
EBX
Highest RMID Value of Any Resource Type (Zero-Based)
Figure 20-20. CPUID.0FH.00H Monitoring Resource Type Enumeration
20.18.5 Feature-Specific Enumeration
Each additional sub-leaf of CPUID.0FH.ResID enumerates the specific details for software to program monitoring
MSRs using the resource type associated with the given ResID.
Note that in future Monitoring implementations the meanings of the returned registers may vary in other sub-
leaves that are not yet defined. The registers will be specified and defined on a per-ResID basis.
CPUID.(EAX=0FH, ECX=1H) Output: (EAX: Reserved)
31
10
9
8
7
0
EAX
Reserved
Non-CPU Agent Memory L3 External Bandwidth Monitoring
Non-CPU Agent Cache Occupancy Monitoring
Enumeration of an Overflow Bit (Bit 61) in the IA32_QM_CTR MSR
Counter Width Encoded as an Offset from 24b
31
0
Upscaling
EBX
Upscaling Factor to Total Occupancy (Bytes)
Factor
31
0
ECX
Highest RMID Value of This Resource Type (Zero-Based)
MaxRMID
Figure 20-21. L3 Cache Monitoring Capability Enumeration Data (CPUID.0FH.01H)
Vol. 3B
20-47