UNCTAD REVIEW OF MARITIME TRANSPORT (2021) - page 2
1. International maritime trade and port traffic
transparent. The best solution, they say, would be to adopt enforceable contracts, which would also
act as hedges against uncertainty and enhance collaboration among shippers, carriers and forwarders
(Baker, 2021b).
Overall, since early 2020, when the pandemic first hit, the narrative for container shipping has thus shifted
dramatically. Carriers have been able to manage ship capacity so as to mitigate initial disruptions but port
and landside businesses required more time to adjust their yard and gate operations which often led to
inefficiencies in terminal operations, such as the management of container stacking (Notteboom, Pallis
and Rodrigue, 2021).
Shippers are caught in this storm and need to better manage their supply chains and adapt to lower
capacity (Drewry Maritime Research, 2021d). They should adopt proactive supply chain strategies
that anticipate delays and promote visibility. While some carriers and ports (e.g., Maersk and DP
World) are emerging as end-to-end integrators, they should spare no effort to address congestion
and service reliability and ensure that maritime trade is not undermined by the current logistical
hurdles.
Meanwhile in mid-2021 pressure in container shipping continued unabated, with shippers increasingly
worrying about the reliability of services and their ability to secure space for their shipments. On 9 July 2021,
the President of the United States signed an executive order that encourages the United States Federal
Maritime Commission “to ensure vigorous enforcement against shippers charging American exporters
exorbitant charges” (Holt, 2021). Since then, Federal maritime regulators have ordered eight container
lines to provide details showing how congestion port surcharges meet legal and regulatory requirements
(Szakonyi, 2021).
5. Container port traffic disrupted as congestion heightens and shipping
adjusts operations and schedules
For ports, the years 2020 and 2021 were highly disruptive. In 2020, global container port throughput
fell by 1.2 per cent, to 815.6 million TEU (table 1.10). For 2021, however, volume is projected to grow
by 10.1 per cent as the global economy and trade recover, along with increasing optimism arising from the
vaccine rollout (Drewry Maritime Research, 2021e). But some ports fared better than others. Antwerp, for
example, fared much better in the COVID-19 crisis than it had during the 2009 downturn.
In
2020, Asia, with nearly two-thirds of the
Table 1.10
World container port
throughput, maintained its position as the global
throughput by region,
hub for container port traffic (figure 1.10). Europe
2019-2020
was the second-largest container port handling
(million TEU and annual
region in 2020 (14.4 per cent). Together, North
percentage change)
America (7.5 per cent), Latin America and the
2019
2020
2019-2020
Caribbean (7.2 per cent), Africa (4.0 per cent),
and Oceania (1.6 per cent) accounted for the
Asia
534.8
532.7
-0.4%
remaining shares. North America and Asia
Africa
32.5
32.5
0.0%
benefited from the swift trade rebound in the
Latin America and the Caribbean
60.1
59.0
-1.8%
second half of 2020, but recurrent virus outbreaks
Europe
122.6
117.4
-4.2%
and pandemic containment measures, among
North America
62.4
61.2
-1.9%
other factors were a drag on container port traffic
Oceania
12.9
12.8
-0.8%
in Europe and other regions.
World Total
825.3
815.6
-1.2%
China’s dominance is also evident from data on
Source: UNCTAD secretariat based on data collected by
the world’s top 20 ports around half of which are
various sources, including Lloyd's List Intelligence, MDS
in China (figure 1.11). In 2020, cargo throughput
Transmodal, Dynamar B. V., Drewry Maritime Research,
in these leading ports declined, though there
Professor Jean-Paul Rodrigue, Hofstra University, as well
were some exceptions, notably Tanjung Pelepas
as information published on relevant port authorities and
container port terminals websites. In some cases, data
with growth of 7.7 per cent and Long Beach
was estimated based on liner shipping connectivity data at
which benefited from a surge in the United States
country level.
containerized imports. In the fourth quarter
Note: Data reported in the format available. In some cases,
of 2020, volumes at Long Beach rose 23 per cent.
country volumes were estimated based on secondary source
information and reported growth rates. Country totals may
Los Angeles also enjoyed 22 per cent growth in
conceal the fact that minor ports may not be included.
the last quarter of the year but still closed the year
Therefore, in some cases, data in the table may differ from
down 1.3. per cent.
actual figures.
17
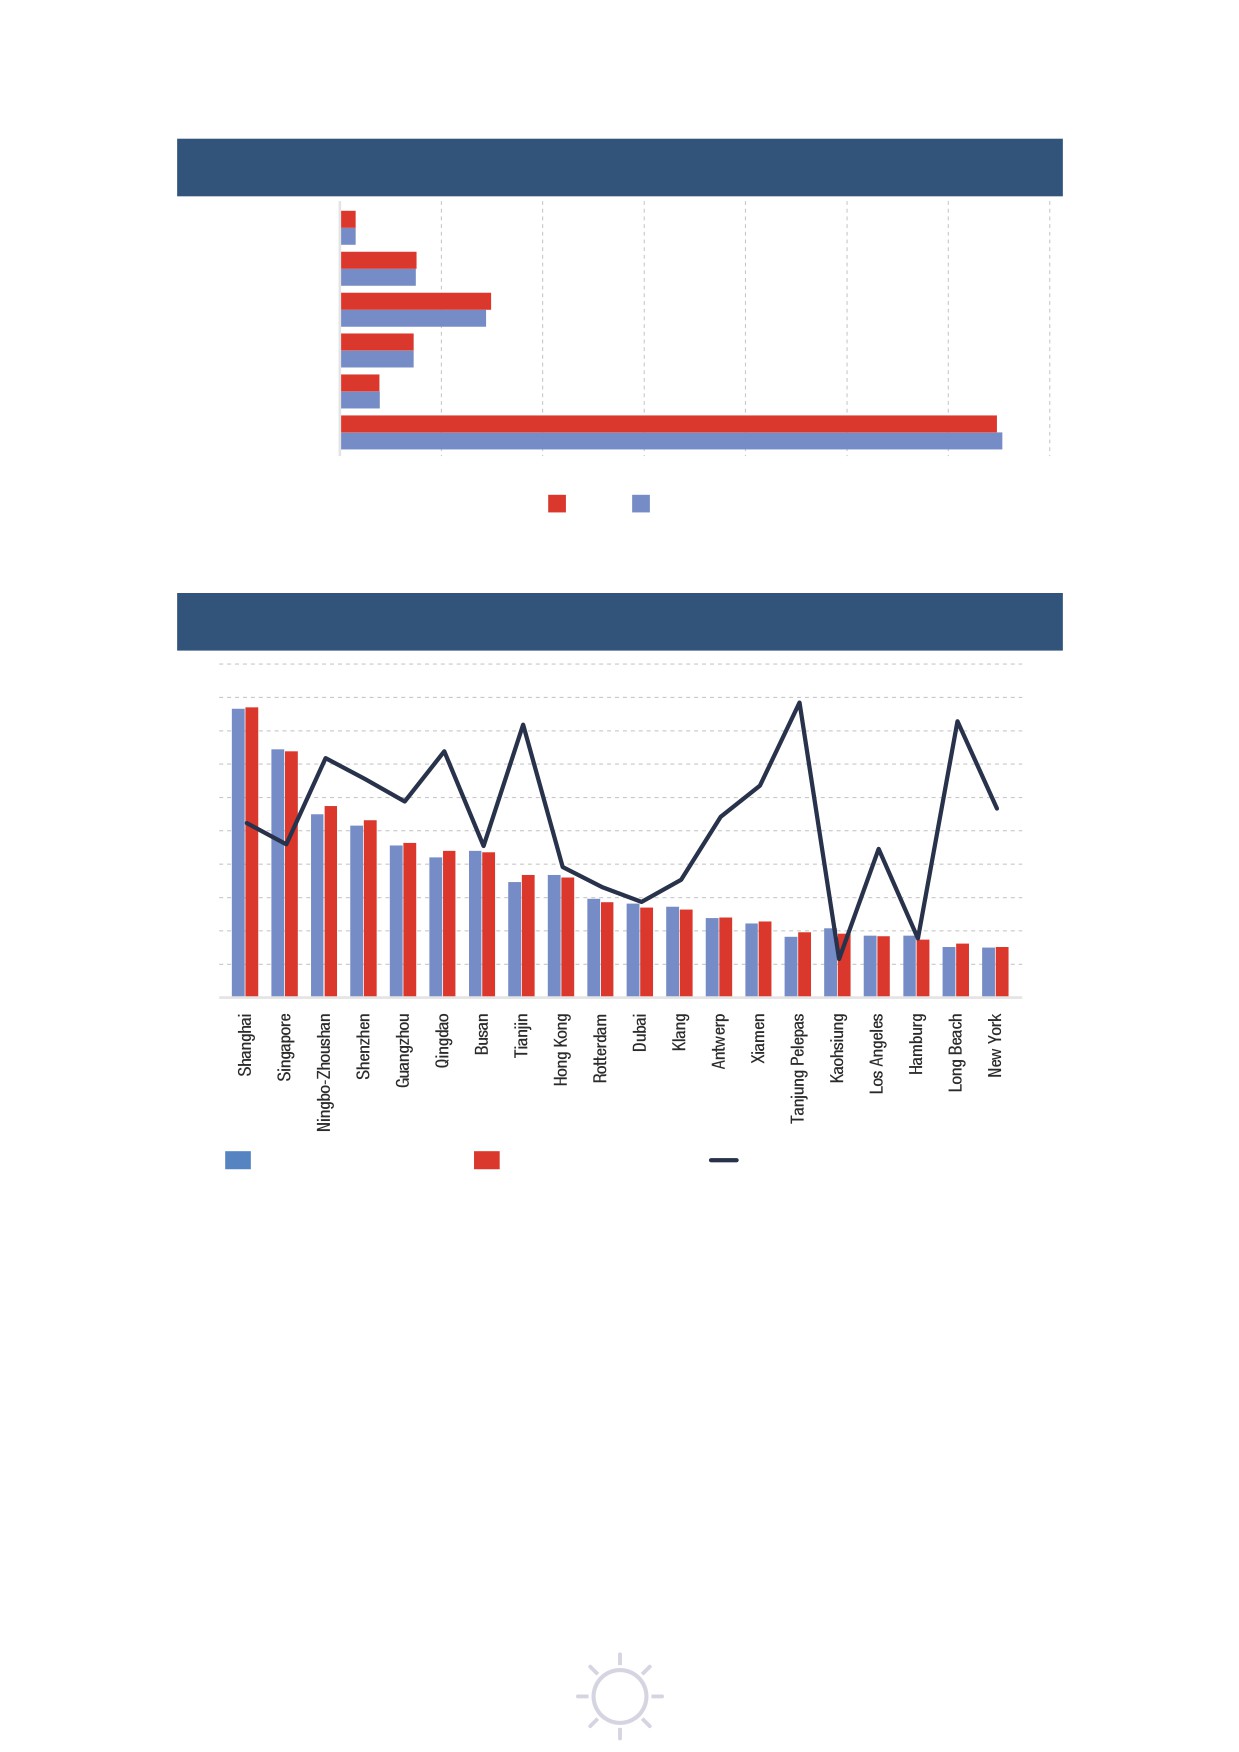
Figure 1.10
World container port throughput by region, 2019-2020
(percentage share in total TEU)
Oceania
North America
Europe
Latin America
and the Caribbean
Africa
Asia
0
10
20
30
40
50
60
70
2020
2019
Source: UNCTAD secretariat calculations, derived from table 1.10.
Figure 1.11
Leading 20 global container ports, 2019-2020
(TEU, percentage annual change)
50
10
45
8
40
6
35
4
30
2
25
0
20
-2
15
-4
10
-6
5
-8
0
-10
Million TEU 2019 - left axis
Million TEU 2020 left axis
Percentage change 2019-2020 - right axis
Source: UNCTAD based on data published on Hamburg Port Authority website (www.hafen-hamburg.de/en/statistics/top-
20-container-ports), accessed July 2021.
Nearly all leading Chinese ports increased their throughput. Shanghai saw slow growth but remained the
world’s leading port, while growth in Tianjin was 6.4 per cent and Qingdao 4.8 per cent. In Europe and
North America port performance varied. Outside this group, the fall in throughput in Colombo was caused
by pandemic-induced labour shortages and limited capacity on mainline vessels. Beirut continued to lose
traffic to Tripoli following the 2020 port explosion (Drewry Maritime Research, 2021f).
New York (+1.3 per cent) and Antwerp (+0.8 per cent) have been more resilient, while Kaohsiung
(-7.7 per cent) and Hamburg (-6.5 per cent) were severely hit. Others such the ports of Dubai (-4.3 per cent),
Rotterdam (-3.4 per cent), Klang (-2.9 per cent), and Busan (-0.9 per cent), recorded drops in volumes
handled.
The COVID-19 pandemic was a big disruptor that has created challenges but also opportunities for
the sector. Digitalization and environmental sustainability have become key pillars of the post-pandemic
recovery. Industry and governments are considering opportunities that may arise from ‘building back
better’. For example, in 2021 COSCO Shipping Ports launched a green finance framework to drive green
18
1. International maritime trade and port traffic
and smart port development (Greenport, 2021a). Elsewhere, the European Union granted €25 million to
a consortium led by the Port of Rotterdam to run pilot projects on sustainable and smart logistics. Project
partners will also design and implement digitalization and automation solutions for the energy transition
(Greenport, 2021b). Meanwhile, the United States’ $1.9-trillion spending plan includes funds earmarked
for transport infrastructure and resilience, including ports (Port Strategy, 2021).
B. OUTLOOK AND LONGER-TERM TRENDS
As the global economy moves towards its next normal, there are optimistic signs for maritime trade. Some
of the pandemic’s impacts and legacies could linger, but the short-term outlook is generally positive.
1. A positive short-term outlook but with risks and uncertainties
Global economic prospects improved by late 2020, supported by vaccine rollout in advanced regions,
the possibility of additional spending in some major economies, and the easing of containment measures
and restrictions in some parts of the world. While emerging trends are encouraging, uncertainty remains
as the sustainability of the nascent, fragile and divergent recovery depends on the pandemic's path and
a broader rollout of vaccines worldwide.
UNCTAD projects shipping volumes to increase by 4.3 per cent in 2021, and exceed their 2019 levels
(table 1.11). Containerized trade is expected to grow by 7.7 per cent. Over the 2022-2026 period, total
maritime trade is expected to grow 2.4 per cent annually - compared with 2.9 per cent over the previous
two decades. Maritime trade is projected to moderate along with GDP (IMF, 2021).
The intensified cost pressures, inefficiencies, and vulnerabilities in the maritime supply chain, driven
primarily by the COVID-19 disruption and its knock-on effects on shipping and ports, could continue
to disrupt supply chains, raising both production
costs and consumption prices. But these
Table 1.11
International maritime trade
pressures are expected to ease when global
developments forecasts,
demand patterns are normalized, manufacturing
2021-2026
(annual percentage change)
capacity comes online, and logistical assets are
optimized to improve the balance between supply
Annual
Seaborne
Growth
Years
trade flows
and demand.
4.3
2021
A further concern is trade protectionism and
3.2
2022
trade tensions between China and its trading
partners, including the United States and
2.4
2023
Total seaborne
UNCTAD
trade volume
Australia. Governments may also resort to trade
2.3
2024
protectionism to mitigate discontent and social
2.3
2025
tensions arising from the impact of COVID-19 on
2.2
2026
employment and social inequalities.
7.7
2021
On the upside, the recovery should be driven
5.9
2022
by fiscal support measures, though there are
4.7
2023
Containerized
uncertainty regarding the duration of current
UNCTAD
4.4
2024
trade volume
stimulus packages and government spending
4.2
2025
while developing countries continue to be under
4.1
2026
pressure - having limited fiscal policy space and
low access to vaccines.
4.3
2021
Total seaborne
Clarksons Research,
trade volume
3.1
2022
Other positive trends include the signing
Seaborne Trade
5.9
2021
in 2020 of the Regional Comprehensive Economic
Monitor, June 2021
Containerized
trade volume
Partnership and the coming into force of the
4.0
2022
African Continental Free Trade Area
(AfCFTA)
Source: UNCTAD secretariat based on own calculations and
in 2021. UNCTAD expects the AfCFTA to boost
forecasts published by the indicated institutions and data
intra-African trade by about
33 per cent and
providers.
cut Africa's trade deficit by 51 per cent (Saygili,
Note: Projections are based on the estimated elasticities of
maritime trade with respect to world GDP, export volumes,
Peters, Knebel, 2018). AfCFTA also has important
investment share in GDP for the 1990-2020 period as well
implications for maritime transport and services
as monthly seaborne trade data published by Clarksons
trade (box 1).
Research.
19
Box 1
Implications of AfCFTA for maritime transport in Africa
The African Continental Free Trade Area (AfCFTA) agreement entered into force in 2019, and its
implementation commenced in 2021. It aims to increase intra-African trade by eliminating import
duties, and to double this trade if non-tariff barriers are also reduced. Adequate transport infrastructure
and services in Africa, including maritime transport connectivity, are critical to the full realization of
the benefits of AfCFTA. Moreover, the AfCFTA is expected to increase demand for different modes
of transport, including maritime transport, which in turn will increase investment requirements for
infrastructure and equipment - ports and vessels in the case of maritime transport.
The Services Protocol of AfCFTA sets out principles for enhanced continental market access and
services- sector liberalization. The five priority sectors identified include transport, business services,
communication services, financial services, and tourism. AfCFTA could therefore be a game-changer for
investment in transport infrastructure and services. Maritime transport infrastructure in Africa includes
several ports across the continent which landlocked countries access through road and rail corridors.
Some of these ports are congested and located in the middle of cities.
A study by the Economic Commission for Africa, with a time horizon of 2030, provides a forecast of the
requirements for transport infrastructure, services, and equipment as a result of the implementation of
AfCFTA. The analysis shows that in 2019, maritime transport accounted for almost a quarter of total
intra-African freight transport demand (22 per cent). It indicates that the number of tons transported
by vessels with the implementation of AfCFTA would increase from 58 million to 132 million tons.
The total maritime transport share is expected to increase only by 0.6 per cent, from 22.1 per cent to
22.7 per cent in the scenario where AfCFTA and priority infrastructure projects are implemented, and
by 1.5 per cent in the scenario where AfCFTA is implemented but priority infrastructure projects are not
implemented. If priority infrastructure projects are implemented some traffic is expected to shift to rail
and road as these projects focus mainly on road and rail transport.
The study shows that countries in different subregions of the continent will experience a surge in
traffic through their ports by 2030 owing to AfCFTA, including Gabon (Central Africa), Ghana, Gambia
(West Africa), Somalia, Comoros, Mauritius (East Africa) and Mozambique, Madagascar, Namibia
(Southern Africa). The study estimates the required size of Africa's maritime transport fleet due to the
implementation of AfCFTA. In this regard, in the scenario where AfCFTA is not implemented and no
priority infrastructure projects are implemented by 2030 compared to 2019 (the baseline), the size of
the fleet is estimated to increase by 43 per cent for bulk and 40 per cent for container cargo. However,
compared to 2019 and to satisfy intra-African trade demand, the size of the fleet for bulk and container
cargo is estimated to increase by 200 per cent if AfCFTA is implemented and no infrastructure projects
are executed. In the scenario where AfCFTA and the different infrastructure projects are implemented
by 2030, the fleet is estimated to increase by 188 per cent for bulk and 180 per cent for container
cargo.
The most significant vessel demand to support trade flows resulting from AfCFTA, compared to the
baseline of 2019, is within North Africa (35 per cent of the total vessel fleet), from North Africa to East
Africa (15 per cent), and from North Africa to West Africa (11 per cent). It is worth noting that the second
priority action plan of the Programme for Infrastructure Development in Africa (PIDA PAP II), endorsed
by the Summit of African Union Heads of State in February 2021, and to be implemented between 2021
and 2030, recognizes the importance of maritime transport to Africa's socio-economic development
and regional integration. In this regard, PIDA PAP II includes the following projects:
• Maritime connectivity between the islands of Comoros;
• Construction of petroleum jetty and associated storage facilities at Albion, Mauritius; and
• Praia-Dakar Shipping and Maritime Services Project.
Source: Economic Commission for Africa (forthcoming). Implications of the African Continental Free Trade Area
for Demand of Transport Infrastructure and Services. Addis Ababa, Ethiopia.
2. Long-term outlook shaped by structural factors and lingering effects
of the pandemic
The long-term outlook will be shaped by a range of continuing structural trends. These include changing
patterns of globalization, the drive for more-resilient supply chains, changes in consumer spending and
the growth of ecommerce, the need for environmental sustainability, the global energy transition, and the
continuing uptake of digitalization.
Shift in globalization patterns
Even before the COVID-19 pandemic, global value chains were being increasingly shaped by rising demand
and new industry capabilities in the developing regions, and growth in automation and robotics, the shift
from tradeable goods to service, and limited growth in vertical specialization and global fragmentation
20
1. International maritime trade and port traffic
of production that reflect maturing value chains in China and the United States. The hyper-globalization
of the late-1990s and early-2000s appears to be decelerating. Enterprises, particularly in automotive,
computer and electronics industries, are aiming to locate production closer to demand and consumption
markets. Developing countries are increasingly consuming their own products and reducing their imports
of intermediate goods while creating more comprehensive domestic supply chains (UNCTAD, 2019).
Decisions will also be shaped by recent episodes of shipping network disruption (Suez Canal blockage,
surge in COVID-19 cases in South China), chip shortages that close car manufacturing, shipping delays
and soaring costs. Existing shifts in globalization patterns can be expected to accelerate (Yap and
Huan, 2018).
Some countries are also aiming for greater self-reliance particularly in goods considered to be strategically
valuable, such as pharmaceuticals and medical equipment, and new technology (Fitch Solutions, 2020).
This is illustrated by initiatives such as Made in China 2025, Buy American, Strategic Autonomy in Europe,
and Self-sufficient India - as well as incentives to move supply chains closer to home in Japan, the
Republic of Korea and Taiwan Province of China.
In the United States, the new administration has already indicated its intention to build supply chains that
rely less on China for strategically important products (Wood and Helfgott, 2021). And in China the recent
14th Five-Year Plan is expected to boost domestic consumption and expand the domestic market for
China's manufactured goods. It also seeks to achieve technological self-sufficiency and expand exports
(Fitch Solutions, 2021). Overall, the plan is expected to benefit shipping while promoting energy, grains,
minor bulk commodities, and chemicals imports.
While the pandemic could deepen pre-existing changes to globalization patterns, it has also reaffirmed
China's important role in sustaining international trade. With around one-third of global trade, China is
showing the resilience and determination to remain the ‘factory of the world’. West and South Asia, South
America, Western Europe and the Mediterranean regions recorded export growth in the fourth quarter
of 2020, although of a lower scale (Teodoro, 2021).
Since 2018 the United States has increased tariffs, but rather than inducing a return of production to the
United States this tended to shift manufacturing within Asia. In 2020 Cambodia, for example, took over a
large part of China's market share in United States imports of Christmas lights. During the same period,
exports of bikes to the United States from Cambodia jumped by 478 per cent and from Taiwan Province
of China by 30 per cent. Tariffs have not provoked a large-scale nearshoring and have had little impact
on ton-miles as containerized exports from China or neighbouring East Asian countries hardly affect the
distances travelled to the United States (Sand, 2020b).
Nevertheless, while China continues to lead world exports its predominance can be expected to moderate
as its economy matures and relies more on domestic than external demand. This implies that imports in
value terms are likely to increase faster than exports (Nicita and Razo, 2021), suggesting potential shifts in
shipping patterns and trade, and changes in maritime transport demand.
Nevertheless an outright reversal of globalization will be difficult. Global supply chains are the product
of years of investment, relationship-building, and knowledge acquisition, and China's large production
and logistical capacity and economies of scale are difficult to replace. This was demonstrated by the
increased imports of electronics in 2020, which triggered a shift of some production and sourcing back
to China. And while imports of machinery and electrical equipment, and computers from Mexico may
have increased over recent years, often components are exported from China to Mexico for assembly in
manufacturing facilities near the United States border (Cassidy, 2021a).
It may be fairly straightforward to change labour-intensive and low-value supply chains. Apparel and
textiles, for example, are already moving away from China to Bangladesh, Viet Nam, and Ethiopia. Turkey
is also a major producer of clothing, shipping goods to Europe. But it is more complex for mid- and
high-value-added manufacturing. For semiconductors, for example, one study estimated that only 9
to 19 per cent of trade flows could potentially shift. For car exports the estimate was 15 to 20 per cent
though for pharmaceuticals it was 38 to 60 per cent (Lund et al., 2020).
Some companies are nevertheless aiming to diversify production sites, with a ‘China +1’ strategy
and will continue to look for alternative sources which will require adjusting networks and inventory
management strategies and transport and shipping routes. This is resulting in new trade flows as
observed in the case of China-Mexico-United States, or from other countries in East Asia to the United
States. Morocco, and Central and Eastern Europe can be expected to strengthen their position as
new suppliers to the North American and European consumer market, for cars, electronics, and heavy
21
machinery (Fitch Solutions, 2020). In the long term, automation could make reshoring and nearshoring
more economically viable.
The pandemic and its fallout are likely to hasten this transition, but the outcome will likely be a blended
approach, balancing localized and global sourcing depending on product and geography (UNCTAD, 2021c).
These trends have major implications for maritime transport, as carriers need to redefine distances and
routes and offer more flexible shipping services. A reconfiguration of supply chains has implications for
vessels, sizes, ports of call, and distance travelled.
Mainstreaming supply chain resilience, risk assessment and
preparedness
Over the years, global supply chains have become more sophisticated and extensively interlinked. They
have also become vulnerable to wide-ranging risks, with more potential points of failure. This became
clear from the COVID-19 disruption which tested existing supply chains and logistics networks and their
underlying business models.
Aiming for greater supply chain resilience will mean diversifying business partners and suppliers,
improving forecasting of demand and volumes, ensuring better management of inventories and safety
stocks, and carefully rethinking the trade-offs between just-in-time and just-in-case supply chain
business models (Cassidy, 2021b). While responses may be influenced by sentiment at the height
of the pandemic, over 90 per cent of the supply chain executives that had responded to a May 2020
survey, were planning to enhance resilience (Lund et al., 2020). This can be achieved, for example by
allowing for redundancy across suppliers, nearshoring, regionalizing their supply chains, dual-sourcing
raw materials, backing up production sites, increasing inventory of critical products, strengthening
supply-chain risk management, improving end-to-end transparency, and minimizing exposure to
cybersecurity and other shocks.
Investors, rating agencies, and regulators increasingly expect ports and shipping companies to integrate
risks into their plans (Kim and Ross, 2019). For this they will need to devise and implement risk management
and business continuity strategies, and ensure visibility across extended supply networks, while building
strong relationships with key partners, including shippers and inland transport providers. To this end, they
can use new technologies that enable end-to-end visibility, collaboration, responsiveness, agility, and
optimization of operations (Koch, Vickers, and Ritzmann, 2020). It will also be important to support the
digitalization of smaller ports and inland terminals (Schwerdtfeger, 2021a).
Any effort to strengthen the resilience of the maritime supply chain would be in vain if the human resources
and labour dimension is not addressed as a matter of priority. The pandemic has underscored the critical
role of seafarers. Smooth delivery of trade by shipping and efficient handling of cargo by ports depend
mainly on their labour forces. Crew members need to rotate at the end of their contract periods. At the
height of the disruption, hundreds of thousands of seafarers could not be repatriated, while an equivalent
number were stuck at home and could not join their ships and provide for their families. As indicated
in Chapter 5, the shipping industry has asked that vaccines be secured and allocated specifically for
seafarers. In May 2021, the International Maritime Organization called on Member States to support the
fair global distribution of COVID-19 vaccines.
In support of these efforts, Singapore, as a global hub port and international maritime centre, is considering
providing vaccines to crews on vessels calling at its port (Ang, 2021). Elsewhere, in June 2021 the Royal
Association of Netherlands Shipowners launched the Vaccination Programme for Seafarers.
The growth in ecommerce and change in consumption patterns
Pandemic-induced shifts in consumption and shopping habits together with digitalization have
accelerated growth in ecommerce. In 2019, around 16 per cent of retail sales were online, a proportion
which grew in 2020 to 19 per cent (UNCTAD, 2021b). UNCTAD estimates the global ecommerce market
in 2019 at $27 trillion, equivalent to 30 per cent of GDP. Ecommerce fulfilment provides new business
opportunities - in particular for warehousing and distribution facilities at seaports, inland rail hubs, and
near airports. This can reduce supply chain uncertainties enabling retailers to keep more inventory at
hand. Retailers are also seeking properties with large container yards to store containers on chassis
(Mongelluzzo, 2021b).
Ports close to, or well-connected to, large population centres could tap this business potential (Drewry
Maritime Research, 2021d). Already, some container shipping companies and ports are positioning
themselves to emerge as door-to-door service integrators (e.g., Maersk and DP World). Container shipping
22
1. International maritime trade and port traffic
companies have recently invested in other parts of the supply chain, including warehousing, aircraft, and
distribution (Steer and Dempsey, 2021).
The imperative for environmental sustainability and the energy transition
The COVID-19 pandemic has increased the focus on environmental sustainability. Maritime transport is
facing growing pressure to decarbonize and enable an effective energy transition - both as a transporter
and user of energy. Fossil fuels make up over one-third of global maritime trade but demand for these fuels
is expected to fall, with clear implications for tankers and coal carriers, while demand is likely to increase
for ships transporting hydrogen or ammonia.
At the same time ships are also expected to shift their own fuel mix and use new ship designs to cut fossil
fuel consumption and reduce carbon emissions. To mitigate these additional costs, shipping is set to rely
on technological and operational adjustments.
Ports are also expected to play their part and become smart and green. Some governments have
earmarked some of the pandemic-induced stimulus packages for smart and green maritime transport
projects.
Acceleration in digitalization
Port authorities, shippers, and freight forwarders that had invested in digital infrastructure and
connectivity and promoted data exchange navigated more smoothly through the COVID-19 disruption
(Schewerdtfeger, 2021a). But this also widened the digital divide between developed and developing
regions. Countries that were less advanced were less able to mitigate the pandemic and diversify their
economies.
UNCTAD expects the fast shift towards digitalization to strengthen the market positions of a few digital
mega platforms. If left unaddressed, the yawning gap between under-connected and hyper-digitalized
countries will widen, exacerbating inequalities (UNCTAD, 2020b).
Investing in digital infrastructure is crucial for information sharing and effective resource planning.
Automation and smart technologies, including artificial intelligence, can solve many of the challenges
faced by the industry, such as how to process more cargo in an environmentally friendly manner
(Schewerdtfeger, 2021c). Developing countries should be supported in their efforts to implement digital
tools to advance environmental sustainability, economic efficiency, and resilience.
C. POLICY CONSIDERATIONS AND ACTION AREAS
Against the backdrop of an already more challenging global geopolitical and trade policy landscape,
the COVID-19 disruption shone light on the vulnerabilities of the global supply chains, including their
underlying maritime transportation networks. Governments are forging ahead with ‘build back better’
policies and initiatives to ensure that risks, environmental sustainability, and technology are integrated
as pre-requisites for a sustainable and resilient post-pandemic world. While maritime trade is currently in
recovery mode, the pandemic is having a lasting impact. The recovery is uneven and fragile and some
pre-existing trends are being amplified or accelerated.
Maritime transport and trade are at the forefront of these trends, and the following priority actions areas
will help the sector navigate through the transition:
• Vaccination - Strengthen international efforts to tackle the pandemic and ensure wider vaccination
across regions and within the shipping industry, with vaccination plans for seafarers topping the
priority list. A two-paced vaccine approach widening the gap between countries, populations
and economic sectors will perpetuate asynchronous recovery patterns, which may have proved
helpful in preventing a protracted downturn when the pandemic hit but raises concerns about
the sustainability of the recovery. A multi-paced vaccine-led recovery entails risks, and would
exacerbate inequalities which could culminate in social tensions and disruptions. The International
Monetary Fund estimates that $50 billion is required to end the pandemic across the world and
ensure that vaccines are accessible to developing countries. The dividend for the world economy
extends beyond saving lives, as investing in global vaccination plans could accelerate economic
recovery and generate some $9 trillion in additional global output by 2025 (Georgieva et al., 2021).
• Digital divide - Help countries and their maritime industries to catch up and close the digital gap.
The pandemic may have exacerbated the digital divide between developed and developing regions
23
and between the hyperconnected and weakly connected. Closing the gap is important and could
form part of relevant post-pandemic recovery plans and other support measures.
•
Facilitate trade - The wheels of trade and shipping kept the world going when the pandemic hit
and helped lift the world economy. Going forward, trade should be further enabled by adopting
supportive policy measures that minimize trade restrictiveness and protectionist tendencies.
•
Fiscal support - Carefully time the winding up and withdrawal of fiscal support measures, to avoid a
premature withdrawal that stifles the nascent recovery. For most developing countries where fiscal
measures similar to those in developed regions could not be deployed, international cooperation
and targeted aids are becoming crucial.
•
Stakeholder collaboration - Stakeholders in the maritime supply chain, including carriers, ports,
inland transport providers and shippers, should work together to ensure that maritime transport
remains a reliable, predictable, and efficient mode of transport that links supply chains and enables
trade. And to ensure visibility and transparency they should ensure enhanced communications, and
sharing of data and information.
•
Ecommerce - Shipping and ports should explore the business opportunities arising from growth
in ecommerce, accelerated digitalization and the growing environmental sustainability imperative,
and take these opportunities to promote profitability while also providing quality services that meet
customer and supply chain requirements.
•
Sustainability
- Expand efforts to promote environmental sustainability as part of the various
stimulus packages and post-pandemic recovery plans. Support for decarbonization under the IMO
framework should not waver, while ensuring that the implications for developing countries are well
understood.
•
Energy transition - Promote investment in fleets, technologies, and infrastructure, including ports
and hinterland connections, to support a maritime supply chain energy transition and environmental
sustainability.
•
Resilience building and future proofing - Prioritize preparedness, risk management, digitalization,
environmental sustainability, and improving data and forecasting. End-to-end visibility will increase
resilience while enhancing efficiency and productivity gains. A portfolio of measures can improve
resilience including redundancy across suppliers, dual-sourcing, backing up production sites, and
managing inventory, and stocks, along with risk management, and end-to-end transparency. Hybrid
solutions can also be envisaged, involving extended supply chains with an element of nearshoring
and reshoring.
24
1. International maritime trade and port traffic
REFERENCES
Ang I (2021). Singapore looks to vaccinate foreign seafarers during crew changes. 8 July. Tradewinds.
Baker J (2021a). Shippers renew call for block exemption to be removed. Lloyd's Loading List. 14 June.
Baker J (2021b). Shippers seek collaboration, not regulation, to fix supply chain. Lloyd’s Loading List.
23 July. www.lloydsloadinglist.com.
Clarksons Research (2020). LNG Trade and Transport 2020. London.
Clarksons Research (2021a). Shipping Review Outlook. Spring.
Clarksons Research (2021b). Seaborne Trade Monitor. Volume 8, No.6. June.
Clarksons Research (2021c). Suez Canal Blockage: Summary and Context. Briefings. 29 March.
Connolly M (2021). West coast Latin America looks to Asia for refined products. Argus Media. 28 June.
Danish Shipping Finance (2021). Shipping Market Review. May.
Danish Shipping Finance (2020). Shipping Market Review. November.
Drewry Maritime Research (2021a). Shipping Insight. April.
Drewry Maritime Research (2021b). Shipping Insights. February.
Drewry Maritime Research (2021c). Shipping Insights. May.
Drewry Maritime Research (2021d). Ports and Terminals Quarterly Insights. Quarter 2. May.
Drewry Maritime Research (2021e). Container Forecaster. Second Quarter. June.
Drewry Maritime Research (2021f). Port Quarterly Insight. Quarter 1. March.
Ebregt J (2020). The CPB World Trade Monitor: Technical description (update 2020). CPB Background
Document. CPB Netherlands Bureau for Economic Policy Analysis. The Netherlands
Economic Commission for Africa (forthcoming). Implications of the African Continental Free Trade Area for
Demand of Transport Infrastructure and Services. Addis Ababa, Ethiopia.
Economist Intelligence Unit (2021). Trade in Transition. Global Report. DP World.
Fitch Solutions (2020). Deglobalization Will Prompt Lasting Changes to Supply Chains.9 October.
Fitch Solutions (2021). China's 14th Five-Year Plan: Evolution of Policy to Meet Challenges. March 2021.
Gallagher J (2021). Congress drafting law barring ocean carriers from refusing US exports. Freight Waves.
15 June. https://www.freightwaves.com.
Georgieva K, Ghebreyesus TA Malpass D and Okonjo-Iweala N (2021). A New Commitment for Vaccine
Equity and Defeating the Pandemic. 1 June 2021. www.imf.org.
Greenport (2021a). Green finance initiative launches. 13 May 2021.
Greenport (2021b). Greenport project funding. 12 May 2021.
Global Times (2021). China-Europe freight trains jump 96 per cent in Jan-Feb, a steady pillar for BRI trade
in hard times. 8 March.
Hellenic Shipping News (2020). Guinea set to supply iron ore from 2026. 1 June.
Holt G (2021). Biden executive order could bring more scrutiny to rising container shipping costs. SP
Global. 9 July. www.spglobal.com.
IMF (2021). World Economic Outlook: Managing Divergent Recoveries. April. Washington. www.imf.org.
Jack E and Don C (2021). Lack of Tiny Parts Disrupts Auto Factories Worldwide. 13 January. New York
Times.
Knowler G (2021). Maersk signals next logistics acquisition will be billion-dollar deal. 11 May. www.JOC.com.
Koch M, Vickers P and Ritzmann S (2020). Building Supply Chain Resilience beyond COVID-19. Deloitte.
25
Lund S et al. (2020). Risk, resilience, and rebalancing in global value chains. McKinsey Global Institute.
August. www.mckinsey.com.
MDS Transmodal (2021). World Cargo Database. 16 June. www.mdst.co.uk.
Metroshipping (2021). Container vessel schedule reliability at all-time lows on a global level. 8 July.
Mongelluzzo B (2021a). US port delays force 'structural' blank sailings on Asian services. 26 January.
Journal of Commerce. www.JOC.com.
Mongelluzzo B (2021b). Record US warehousing demand to continue through 2021. 10 March. Journal
of Commerce. www.JOC.com.
Nicita A and Razo C (2021). China: The rise of a trade titan. 27 April.
Notteboom T (2021). PortEconomics.eu. 2 March.
Notteboom T, Pallis A and J-P Rodrigue (2021) “Disruptions and Resilience in Global Container
Shipping and Ports: The COVID-19 Pandemic vs the
2008-2009 Financial Crisis”, Maritime
Economics and Logistics, vol. 23, issue 2, No 1, 179-210, available at https://link.springer.com/
article/10.1057%2Fs41278-020-00180-5.
PortStrategy (2021). Thinking Big. 24 May. www.portstrategy.com.
Port Technology International (2021a). Blank sailings at Yantian rise by 300 per centas expert warns of
“massive headaches” for global economy. 20 June. www.porttechnology.org.
Port Technology International (2021b). Maersk responds to ocean congestion with new intermodal route.
21 June. www.porttechnology.org.
Sand P (2020a). Phase One' agreement boosts exports and doubles volumes from last year. 15 December.
BIMCO.
Sand P (2020b). US-China trade war reinforces change in Asia's manufacturing landscape. BIMCO.
23 September.
Sand P (2021a). Macroeconomics: shipping enjoys a higher trade multiplier as 2021 promises a slow
recovery. BIMCO. 24 February.
Sand P (2021b). Imbalance on transpacific trade increases even as surge in US imports eases. BIMCO.
24 March.
Sand P (2021c). Container shipping: continued disruption will ensure carrier profitability well into 2021.
BIMCO. 25 February.
Saygili M, Peters R, Knebel C (2018). African Continental Free Trade Area: Challenges and Opportunities
of Tariff Reductions. UNCTAD Research Paper No. 15. UNCTAD/SER.RP/2017/15/Rev.1. February.
Steer G and Dempsey H (2021). Shipping groups prepare for more 'black swan' events after Suez
blockage. 7 April. www.ft.com.
Schwerdtfeger M (2021a). CTAC 2021: Digitalise inland terminals to boost supply chain resiliency. 19 May.
Schewerdtfeger M(2021b). Smart technologies remain critical to solving ports' major challenges. 13 May.
Schewerdtfeger M (2021c) US must invest in digital infrastructure to avoid future supply chain cries.
17 May. Journal of Commerce. www.JOC.com.
Szakonyi M (2021). FMC orders carriers to justify US port congestion surcharges. 4 August. Journal of
Commerce. www.JOC.com.
Teodoro A (2021). Changing lanes: China retains ‘factory of the world’ crown amid pandemic. 3 March.
Available at https://lloydslist.maritimeintelligence.informa.com.
Tirschwell P (2021). Maersk upping ante on integrator strategy. 14 May. www.JOC.com.
UNCTAD (2019). Review of Maritime Transport 2018. Geneva and New York. Available at https://unctad.org/
system/files/official-document/rmt2018_en.pdf.
UNCTAD (2020a). Review of Maritime Transport
2020. Geneva and New York. Available at
26
1. International maritime trade and port traffic
UNCTAD (2020b). The COVID-19 Crisis: Accentuating the Need to Bridge Digital Divides. Digital Economy
Update. UNCTAD/DTL/INF/2020/1. April. Available at https://unctad.org/system/files/official-
document/dtlinf2020d1_en.pdf.
UNCTAD (2021a). Global Trade Update. World trade rebounds to record high in Q1 2021. May. Available
UNCTAD (2021b). Estimates of Global E-Commerce 2019 and Preliminary Assessment of COVID-19
Impact on Online Retail 2020. Geneva. 3 May. Available at https://unctad.org/system/files/official-
document/tn_unctad_ict4d18_en.pdf.
UNCTAD (2021c). Impact of the COVID-19 Pandemic on Trade and Development: Transitioning to a
New Normal. UNCTAD/OSG/2020/1. Geneva. Available at https://unctad.org/system/files/official-
document/osg2020d1_en.pdf.
UNDESA (2021). World Economic Situation and Prospects as of Mid-2021. United Nations. New York.
WESP2021_UPDATE.pdf.
Vanham P (2019). A brief history of globalization. World Economic Forum. 17 January. www.weforum.org.
Waters W (2021a). Demurrage and detention charges double in a year. Lloyd's Loading List. 29 June.
Waters W (2021b). South China port disruptions 'could extend to Christmas. Lloyd's Loading List. 7 July.
Waters W (2021c). Sharp increase in 'double-sailings' adds to pressure on ports. Lloyd's Loading List.
22 June.
Waters W (2021d). Blank sailings point to ocean space shortages well into the summer. Lloyd's Loading
List. 24 May.
William C (2021a). Top US Shippers: Electronics importers return to China during COVID-19. 3 June.
Journal of Commerce.
William C (2021b). Outlook 2021: Shippers face new twists, risky turns in pandemic-altered market.
4 January. Journal of Commerce.
World Trade Organization (2021). World trade primed for strong but uneven recovery after COVID-19
pandemic shock. Press/876. 31 March.
World Trade Organization (2020). Trade set to plunge as COVID-19 pandemic upends global economy.
PRESS 855. 8 April.
Wood D and Helfgott A (2021). Inclusive and transparent dialogue can fix fragile US supply chains.
23 May. The World Trade Organization (2021). World trade primed for strong but uneven recovery after
COVID-19 pandemic shock. Press/876. 31 March.
Yap J and Huan A (2018). The Good, the Bad, and the Ugly of Globalization. SIDS Directors Bulletin.
Quarter 3. www.deloitte.com.
Yoon K and Lindsay R (2019). Ports: An industry guide to enhancing resilience. Resilience Primer. Four
Twenty-Seven Inc. and Resilience Shift, United Kingdom.
Zhang H (2021). Chinese Grain Imports: Taking Centre Stage Once Again. Clarksons Research. 30 April.
27
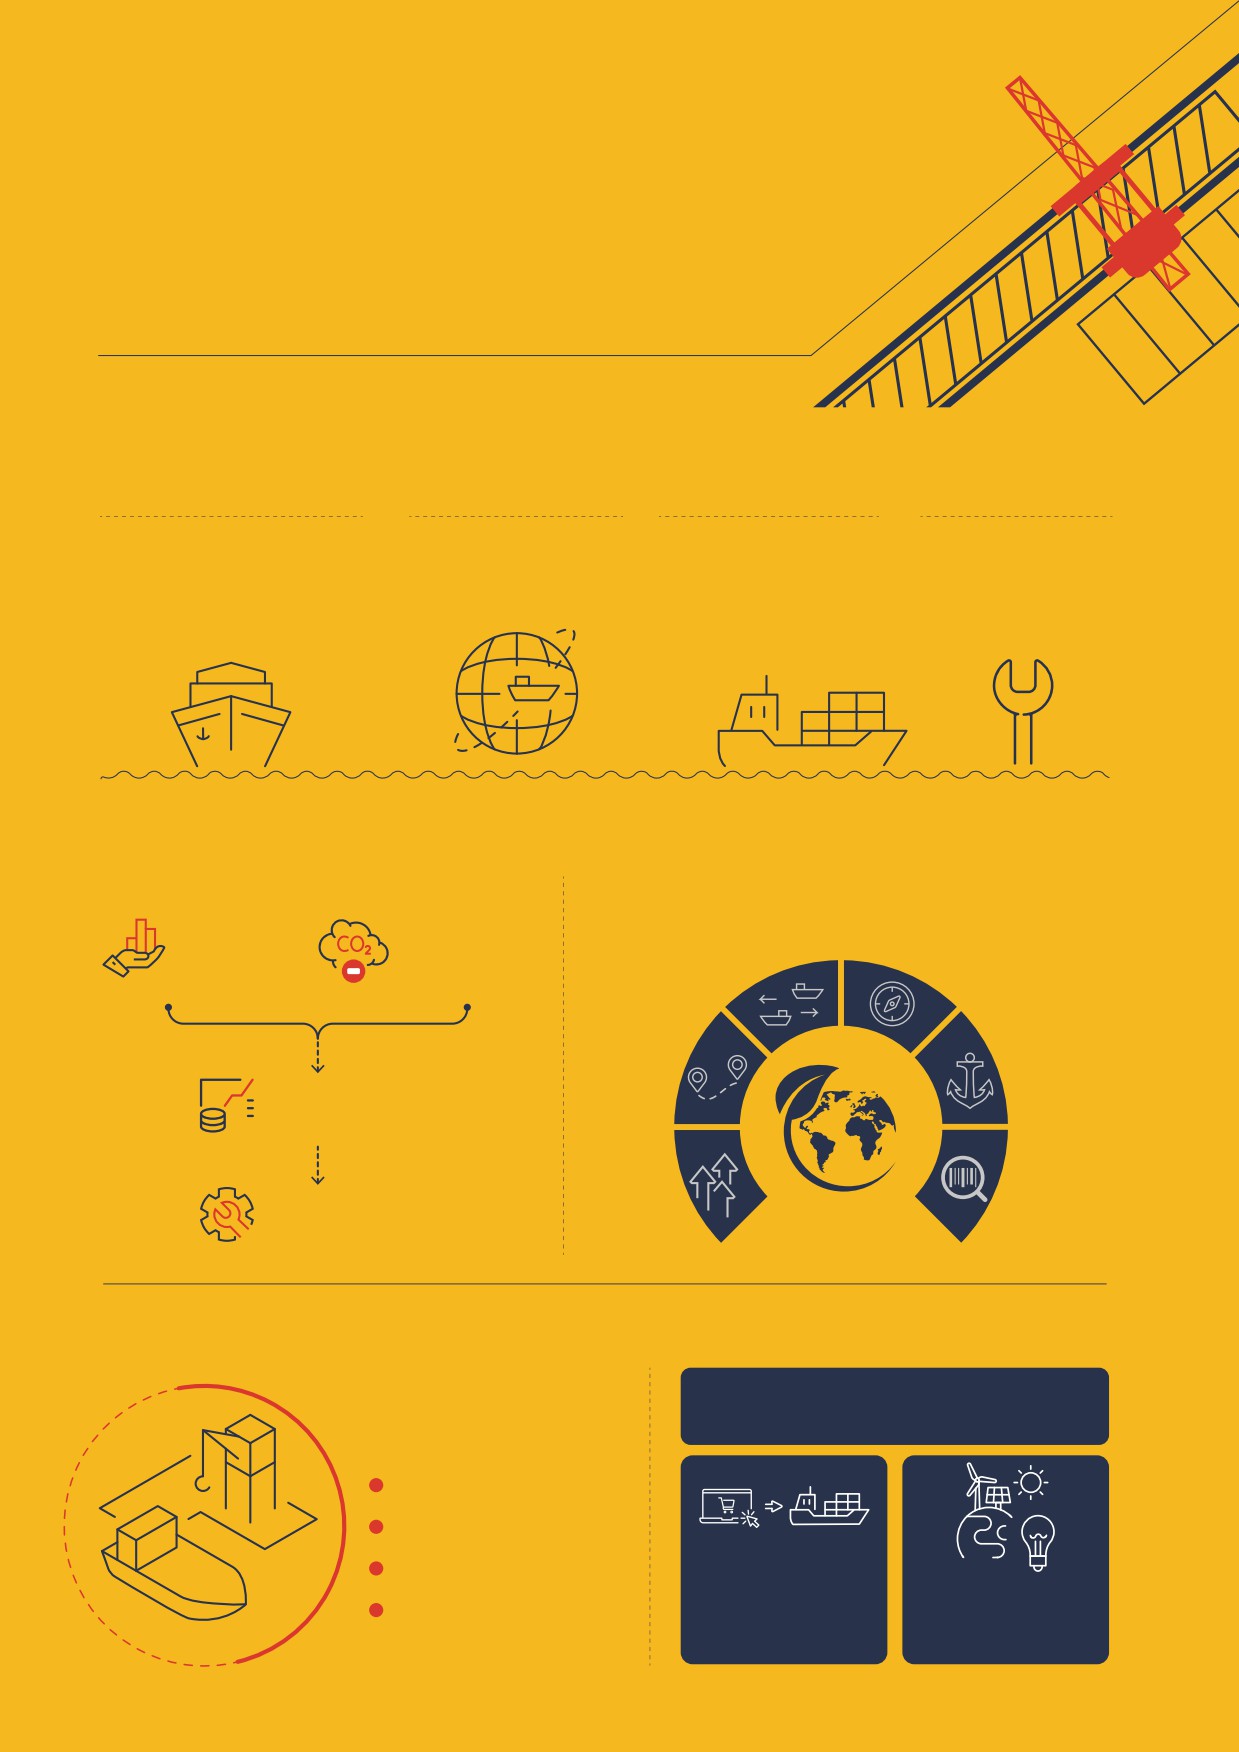
This chapter reviews the supply of maritime transport,
covering the world fleet, shipping companies, and port
services, and then adding insights from the UNCTAD
TrainForTrade Port Management Programme.
A. The world fleet - This section examines the growth of the
world fleet and changes to its structure and age. It also covers
parts of the maritime supply chain, such as shipbuilding, ship
recycling, ship ownership and ship registration. It finds that at
2
the beginning of 2021 the demand for shipping services was
exceeding supply, resulting in a surge in orders for new ships
and more activity in the second-hand market.
B. Regulation of shipping - This section examines regulatory
Maritime transport
changes, in particular decarbonization targets. It explores the
implications for the shipping industry and for shipping-related
and infrastructure
operations, fuel usage and technology. Adapting to these
changes will require significant investment at a time of great
uncertainty.
C. Port services - This section explains how the pandemic
has induced a rethink of business resilience for ports. It
also covers their strategies for capitalizing on emerging
opportunities, notably ecommerce and greener industrial
activities.
D. The impact of COVID-19 - Using data from the UNCTAD
TrainForTrade port network, this section examines the impact
of the pandemic on financial performance and on vessel and
cargo operations.
Maritime transport
services and
infrastructure supply
THE WORLD FLEET
In early 2021,
The global shipping
Ship deliveries
the world eet totalled
eet grew by
Ships between
declined by
99,800 ships
+3%
5-9 years old
-12 %
of 100 gross tons and above,
in the 12 months prior
represented the highest
in 2020
equivalent to 2,134,639,907 dwt
to 1 January 2021
proportion of the eet
of capacity
carrying capacity
SHIPPING COMPANIES AND OPERATIONS
Adapting maritime transport supply
Potential changes from the Green Transition
Trade growth
Decarbonization
targets
Fleet distribution
Routing patterns
Use of
different
Ship travel
types
distance
of vessels
Scaling up investment
to expand the eet
Maritime
Ship costs
logistics
Retro tting or replacing
costs
the existing eet
PORT SERVICES AND INFRASTRUCTURE SUPPLY
Since 2020, ports resilience
and adaptive capacity have
New opportunities from
been tested:
the COVID-19 crisis
Financial performance
Congestion
Equipment shortages
E-commerce,
smart logistic hubs
Greener
Supply chain disruption
and intermodal
industrial port
connections
activities
2. Maritime transport and infrastructure
A. THE WORLD FLEET
Table 2.1
World fleet by principal
vessel type, 2020-2021
(thousand dead-weight tons
1. Fleet structure, age, and vessel
and percentage change)
size
Percentage
change 2021
Ships are getting bigger, though
Principal types
2020
2021
over 2020
with fewer new ships the fleet is
Bulk carriers
879 725
913 032
3.79%
ageing
42.47%
42.77%
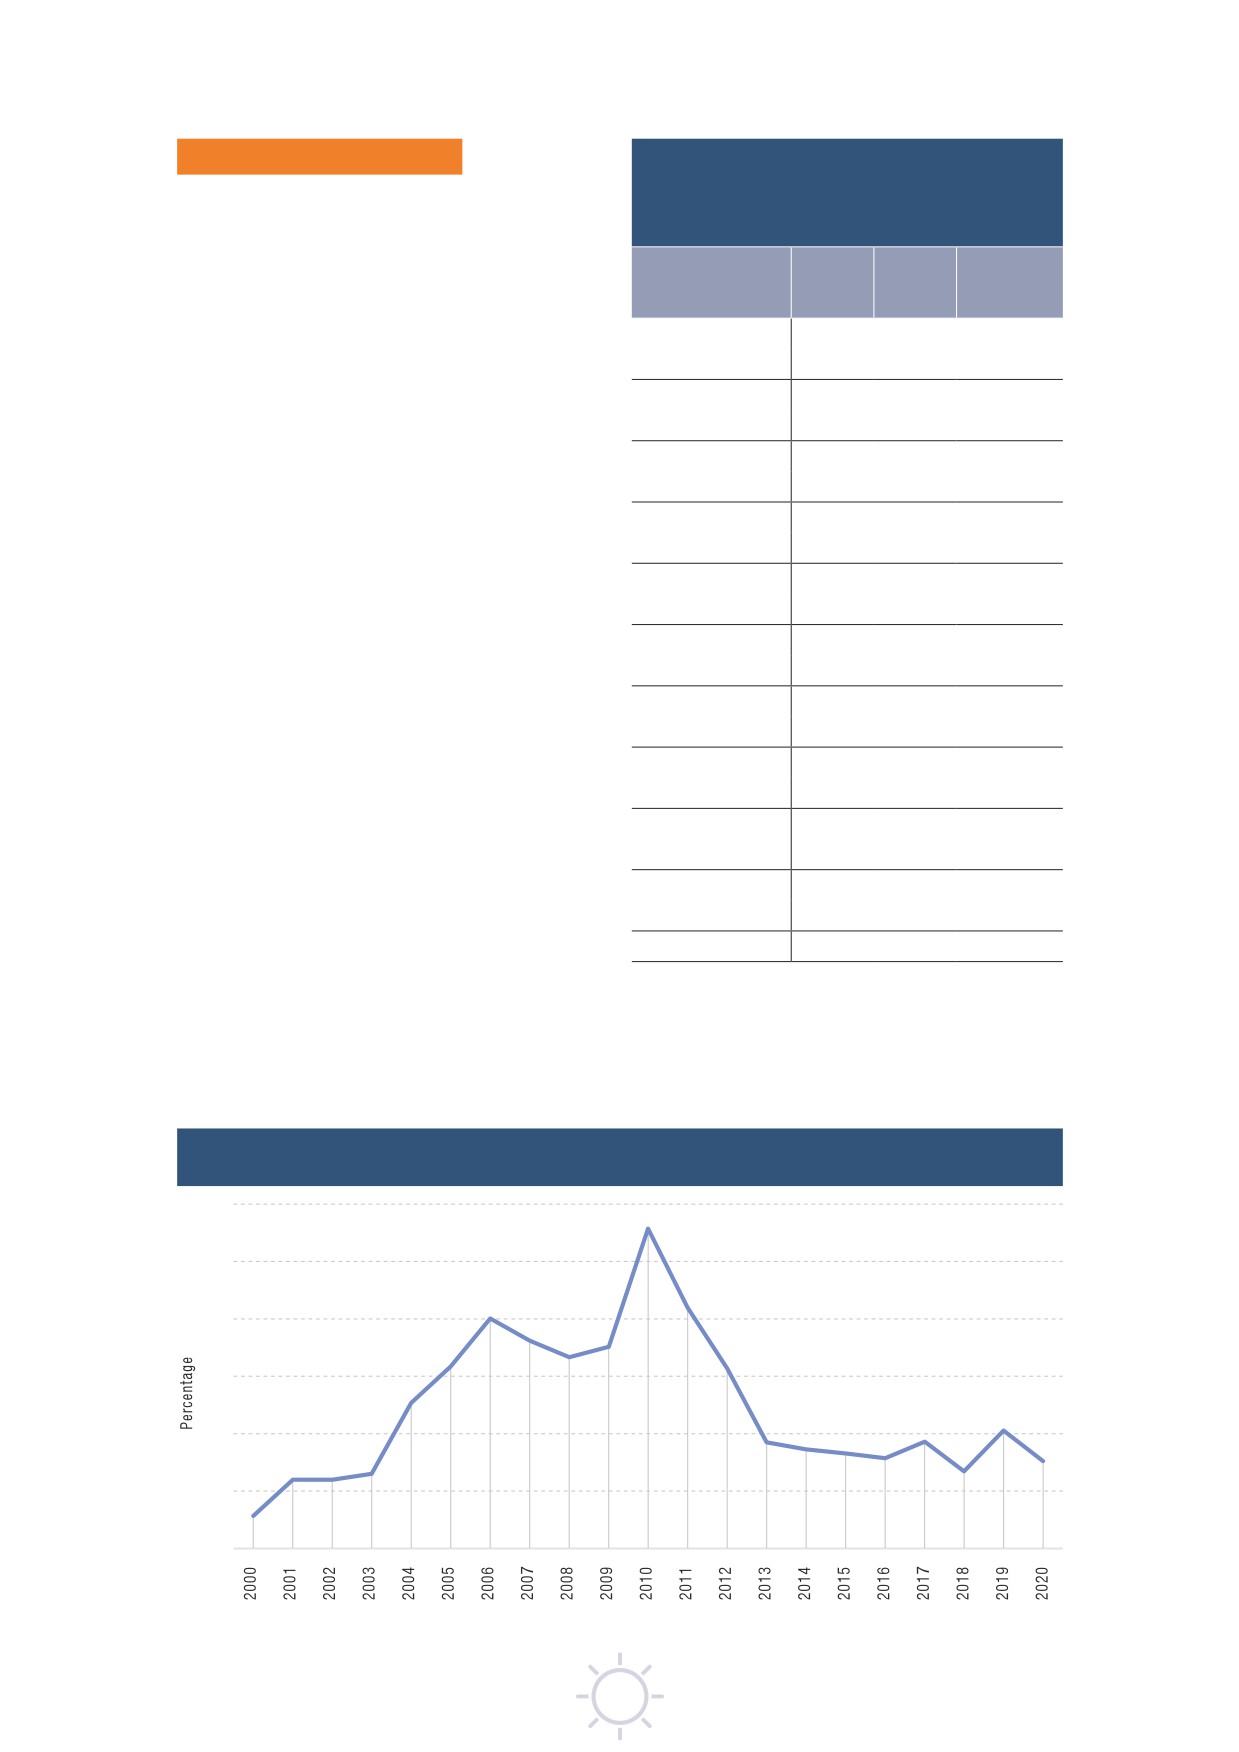
In the 12 months to 1 January 2021, the global
Oil tankers
601 342
619 148
2.96%
commercial shipping fleet grew by 3 per cent -
29.03%
29.00%
to 99,800 ships of 100 gross tons and above,
Container ships
274 973
281 784
2.48%
equivalent to
2,134,639,907 dwt of capacity
(table 2.1). But as indicated in figure 2.1, from a
13.27%
13.20%
peak of 11 per cent in 2011 this growth rate has
Other types of ship:
238 705
243 922
2.19%
slowed.
11.52%
11.43%
An increasingly important concern is the ageing
Offshore supply
84 049
84 094
0.05%
of the fleet, since older ships are generally less
4.06%
3.94%
efficient and generate higher emissions. At the
Gas carriers
73 685
77 455
5.12%
beginning of 2021, around 30 per cent of the
3.56%
3.63%
carrying capacity of the global fleet was in ships
of between five and nine years old (table 2.2).
Chemical tankers
47 480
48 858
2.90%
As indicated in figure 2.2, since 2017 this age
2.29%
2.29%
cohort has represented the highest proportion
Other/not available
25 500
25 407
-0.36%
of capacity, but its proportion and that for
1.23%
1.19%
younger vessels has been falling, while that for
Ferries and
7 992
8 109
1.46%
vessels of 10 to 14 years old has steadily been
passenger ships
rising.
0.39%
0.38%
General cargo ships
76 893
76 754
-0.18%
The age distribution varies, however, between
different economies
(figure
2.3). The oldest
3.71%
3.60%
ships are generally those in the least developed
World total
2 071 638
2 134 640
3.04%
countries (LDCs), where close to 30 per cent
Source: UNCTAD calculations, based on data from Clarksons
are more than 20 years old. Compared to the
Research.
developing group, or the developed countries,
Notes: Propelled seagoing merchant vessels of 100 gross
the LDCs also have a higher proportion of ships
tons and above, at 1 January.
of 15 to 19 years old.
Dead-weight tons for individual vessels have been estimated.
Figure 2.1
Annual growth rate of world fleet, dead-weight tonnage, 2000-2020
(percentage)
12
11.1
10
8.4
8.0
8
7.2
7.0
6.7
6.3
6.3
6
5.1
3.7
4.1
3.7
4
3.5
3.3
3.1
2.7
3.0
2.6
2.4
2.4
2
1.1
0
Source: UNCTAD calculations, based on data from Clarksons Research.
31
Table 2.2
Age distribution of world merchant fleet by vessel type,
2021 and average age 2020-2021
(percentage and average vessel size)
Years
Average age
Vessel type, country grouping by flag
More
0-4
5-9
10-14
15-19
2021
2020
of registration and indicator
than 20
World
Bulk
Percentage of total ships
18
37
24
10
10
10.6
10.2
carriers
Percentage of dead-weight tonnage
22
40
23
9
6
9.5
9.3
Average vessel size (dead-weight tonnage)
90 447
78 409
68 583
68 087
46 623
NA
NA
Container
Percentage of total ships
14
19.21
32
17
17
13.2
12.7
ships
Percentage of dead-weight tonnage
20
29
29
14
7
10.4
9.9
Average vessel size (dead-weight tonnage)
74 632
78 802
46 897
42 345
21 975
NA
NA
General
Percentage of total ships
5
10
16
9
59
27.1
26.3
cargo
Percentage of dead-weight tonnage
8
20
23
10
40
19.9
19.3
Average vessel size (dead-weight tonnage)
5 992
7 493
5 494
4 372
2 660
NA
NA
Oil tankers Percentage of total ships
14
17
21
13
35
19.5
19
Percentage of dead-weight tonnage
25
21
28
19
8.
10.9
10.4
Average vessel size (dead-weight tonnage)
96 122
65 148
72 208
80 802
12 346
NA
NA
Other
Percentage of total ships
10
17
17
9
47
23.6
23.0
types of
ships
Percentage of dead-weight tonnage
20
16
23
11
30
16.1
15.8
Average vessel size (dead-weight tonnage)
9 236
4 562
6 524
5 953
3 014
NA
NA
All ships
Percentage of total ships
11
18
19
10
42
21.6
21.1
Percentage of dead-weight tonnage
22
29
25
13
11
11.2
10.80
Average vessel size (dead-weight tonnage)
43 364
34 175
28 112
27 809
5 505
NA
NA
Developing economies (all ships)
Percentage of total ships
10
20
19
10
41
20.8
20.2
Percentage of dead-weight tonnage
21
29
22
13
15
11.9
11.6
Average vessel size (dead-weight tonnage)
33 788
24 295
18 871
21 144
6 190
NA
NA
Developed economies (all ships)
Percentage of total ships
12
17
20
10
40
21.3
20.8
Percentage of dead-weight tonnage
23
30
28
13
7
10.5
10.2
Average vessel size (dead-weight tonnage)
54 908
50 000
39 696
35 466
5 132
NA
NA
Small Islands Developing States (all ships)
Percentage of total ships
6
8
10
8
68
30.9
30.3
Percentage of dead-weight tonnage
3
30
18
20
30
17.5
17.8
Average vessel size (dead-weight tonnage)
2 009
16 865
8 077
11 326
2 036
NA
NA
Least developed countries (all ships)
Percentage of total ships
12
13
8
6
61
28.6
28.6
Percentage of dead-weight tonnage
9
19
25
18
29
17.0
16.5
Average vessel size (dead-weight tonnage)
7 551
15 032
33 414
31 782
4 956
NA
NA
Source: UNCTAD calculations, based on data from Clarksons Research.
Notes: Propelled seagoing vessels of 100 gross tons and above, as at 1 January.
Dead-weight tons for individual vessels have been estimated.
The LDC and SIDS country grouping are based on the definitions of the Office of the High Representative for the Least
Developed Countries, Landlocked Developing Countries and Small Island Developing States (UNOHRLLS). For more
information see: https://www.un.org/ohrlls/content/ldc-category and https://www.un.org/ohrlls/content/list-sids.
32
2. Maritime transport and infrastructure
Figure 2.2
Age distribution of the global fleet, share of the global carrying capacity,
2012-2021
45
40
35
5-9 years
30
10-14 years
25
0-4 years
20
15-19 years
15
20+ years
10
5
0
2012
2013
2014
2015
2016
2017
2018
2019
2020
2021
Source: UNCTAD calculations, based on data from Clarksons Research.
Notes: Propelled seagoing merchant vessels of 100 gross tons and above; beginning-of-year figures.
Figure 2.3
Age distribution of the fleet, as at beginning of 2021, per development status
groups
35
30
0-4 years
25
5-9 years
20
10-14 years
15
15-19 years
10
20+ years
5
0
Developed economies
Developing economies
Small island
Least developed countries
developing states
Source: UNCTAD calculations, based on data from Clarksons Research.
Note: The LDC and SIDS country grouping are based on the definition by UNOHRLLS. For more information see:
Increasing ship sizes: what we have learnt from the Ever Given incident
Since the early 2000s, more of the world’s cargo has been carried in mega-container ships - those with a
container capacity greater than 10,000 twenty-foot equivalent units (TEU): between 2011 and 2021 their
proportion of carrying capacity rose from 6 to almost 40 per cent (figure 2.4). In the last 10 years, there
have been 97 new ships of between 15,000 and 19,990 TEU, and since 2018 74 ships of 20,000 TEU and
above (figure 2.5). These larger ships, facilitated by technological advances, have been part of broader
corporate strategies to pursue economies of scale (Sanchez, 2021). However, this has resulted in excess
supply - ‘over-tonnaging’ - in the world’s major liner routes, with greater pressure on infrastructure and
on logistics at ports.
This pressure on infrastructure was dramatically illustrated from 23 to 29 March 2021 when the Suez Canal
was blocked by the Ever Given, a container ship with a carrying capacity of 20,000 TEU. Larger ships
are more difficult to steer, and harder and more costly to rescue in cases of collisions and groundings.
In addition to safety and salvage issues, the higher risks entail higher insurance costs. (Hayden, 2015;
Lockton, 2019; Allianz, 2019; and Boulougouris, 2021).
This is a critical issue for key nodes of the global maritime transport network such as the Suez and
Panama canals, which have constrained capacities and where any disruption sends shockwaves through
global supply chains. The Ever Given incident delayed the passage of hundreds of vessels through the
canal, disrupted global trade, and exacerbated the shortage of shipping containers, leading to congestion
33
in many ports and an increase in container freight rates (Hellenic Shipping News, 2021). As indicated in
figure 2.6, since 2012 these mega-vessels have been making more journeys through the Panama and
Suez canals.
Figure 2.4
Share of mega-vessels in the global container ship fleet carrying capacity
by TEU, 2011-2021
(percentage)
100
90
80
70
Less than
60
10,000 TEU
50
40
Megavessels
30
(more than
20
10,000 TEU)
10
0
2011
2012
2013
2014
2015
2016
2017
2018
2019
2020
2021
Source: UNCTAD calculations, based on data from Clarksons Research.
Figure 2.5
Number of mega-containerships
450
400
10,000 - 14,999 TEU
350
300
250
200
150
15,000 - 19,999 TEU
100
20,000 TEU and above
50
0
2011
2012
2013
2014
2015
2016
2017
2018
2019
2020
2021
Source: UNCTAD calculations, based on data from Clarksons Research.
Figure 2.6
Mega-vessel distinct journeys through the Panama and Suez canals,
daily averages, from 2012 until 4 June 2021
25
20
15
10
5
0
2012
2013
2014
2015
2016
2017
2018
2019
2020
2021
Panama Canal
Suez Canal
Source: UNCTAD calculations, based on data from VesselsValue.
Notes: In the case of the Panama Canal the mega-vessel category includes bulk carriers (Capesize), containerships (Neo-Panamax
and Post Panamax), gas carriers (Q Flex and VLGC) and oil tankers (VLCC). In the case of the Suez Canal, in addition to the ship
types mentioned before, the mega-vessel category includes an additional type of gas carrier (Q-Max) and containership (ULCV).
34
2. Maritime transport and infrastructure
2. Ship ownership and registration
The principal ship-owning countries mostly flag their ships abroad
As of 1 January 2021, the top three ship-owning countries, in terms of both dead-weight tons and
the commercial value of their fleets, were Greece, China, and Japan (table 2.3) (table 2.4). Over the
previous year, among the top 35 shipowners, the greatest increases in shares of carrying capacity
were in the United Arab Emirates, from 1.01 to 1.18 per cent, and Viet Nam from 0.52 to 0.59
per cent. In terms of value, the highest increases in shares of the world merchant fleet value were
in Taiwan Province of China, from 1.49 to 1.86 per cent, and the Republic of Korea, from 2.77 to
3.08 per cent.
Table 2.3
Top 25 ship-owning economies, as of 1 January 2021
(millions of United States dollars)
Ferries and
General
Country or Territory of
Bulk
Container
Offshore
Oil
Passenger
Gas
Cargo
Chemical
Other/ not
Ownership
Carriers
Ships
vessels
Tankers
Ships
Carriers
Ships
Tankers
available
Total
1
Japan
39 564
15 101
4 746
9 529
3 236
15 436
3 130
5 203
7 888
103 833
2
Greece
39 853
11 670
197
32 602
2 512
14 572
182
977
402
102 968
3
China
34 735
20 632
9 967
12 838
4 979
4 115
5 120
3 344
3 207
98 936
4
United States
3 734
1 938
15 494
5 117
51 259
1 454
1 320
1 098
791
82 206
5
Singapore
14 564
9 274
4 304
12 569
32
4 377
870
4 778
534
51 301
6
Norway
4 384
2 514
21 748
5 570
3 208
7 620
900
2 433
2 719
51 096
7
Germany
6 207
24 166
687
1 767
9 460
1 627
2 789
704
347
47 754
8
United Kingdom
4 001
7 123
10 064
3 829
5 661
5 816
791
1 354
2 239
40 878
9
China, Hong Kong SAR
11 117
12 982
73
6 288
2 387
1 114
918
269
886
36 032
10
Republic of Korea
9 123
5 363
240
5 558
433
4 791
680
1 480
2 673
30 340
11
Bermuda
5 863
2 301
5 198
5 919
8 107
297
51
27 736
12
Denmark
1 526
12 847
1 701
3 416
1 032
2 049
751
1 032
108
24 462
13
Switzerland
822
9 012
3 056
596
9 521
213
183
169
12
23 584
14
Netherlands
704
412
13 273
441
526
686
2 969
1 892
2 046
22 949
15
Taiwan Province
8 145
7 372
48
1 483
74
363
563
148
107
18 304
of China
16
Italy
1 116
6
2 441
1 866
9 475
256
1 801
418
621
18 000
17
Brazil
179
465
14 312
810
64
116
30
77
2
16 054
18
Monaco
3 390
2 004
6 381
29
3 300
26
24
15 153
19
France
374
5 325
5 183
112
1 860
476
155
132
144
13 761
20
Russian Federation
256
110
1 346
3 320
76
1 740
1 449
637
1 828
10 762
21
Turkey
3 406
1 011
677
1 269
353
131
1 793
1 156
51
9 847
22
Indonesia
1 110
1 103
1 137
2 131
2 020
565
1 174
369
51
9 659
23
Malaysia
142
110
6 748
219
19
1 811
189
150
159
9 548
24
Belgium
1 747
491
134
3 305
860
761
210
2 018
9 526
25
United Arab Emirates
1 959
469
2 858
2 361
57
544
90
621
179
9 138
Others
14 436
4 971
23 462
18 470
12 008
13 971
7 863
4 050
2 297
101 529
World total
212 455
158 771
149 093
147 764
120 282
96 110
36 470
33 026
31 384
985 356
Source: UNCTAD calculations, based on data from Clarksons Research, as of 1 January 2021 (estimated current value).
Note: Value is estimated for all commercial ships of 1,000 gross tons and above.
35
Table 2.4
Ownership of the world fleet, ranked by carrying capacity in dead-weight tons, 2021
Number of vessels
Deadweight tonnage
Foreign
flag as a
Total as a
Country or territory of
National
Foreign
percentage
percentage
ownership
flag
flag
Total
National flag
Foreign flag
Total
of total
of world
1
Greece
642
4 063
4 705
58 067 003
315 350 152
373 417 155
84.45%
17.64%
2
China
4 887
2 431
7 318
105 657 323
138 898 420
244 555 743
56.80%
11.56%
3
Japan
914
3 115
4 029
35 107 223
206 741 103
241 848 326
85.48%
11.43%
4
Singapore
1 459
1 384
2 843
73 258 302
65 805 758
139 064 059
47.32%
6.57%
5
China, Hong Kong SAR
886
878
1 764
72 367 151
31 851 549
104 218 700
30.56%
4.92%
6
Germany
198
2 197
2 395
7 437 473
78 759 307
86 196 779
91.37%
4.07%
7
Republic of Korea
787
854
1 641
15 096 916
70 995 920
86 092 836
82.46%
4.07%
8
Norway
387
1 655
2 042
1 899 017
62 144 480
64 043 497
97.03%
3.03%
9
Bermuda
13
540
553
300 925
63 733 226
64 034 151
99.53%
3.03%
10
United Kingdom
309
1 014
1 323
7 160 493
46 524 174
53 684 667
86.66%
2.54%
(excl. Channel Islands)
11
United States of America
790
1 020
1 810
10 395 172
44 576 019
54 971 191
81.09%
2.60%
(incl. Puerto Rico but
excluding Virgin Islands)
12
Taiwan Province of China
147
867
1 014
6 998 235
46 284 542
53 282 777
86.87%
2.52%
13
Monaco
0
478
478
0
43 426 478
43 426 478
100.00%
2.05%
14
Denmark
26
902
928
47 415
42 185 673
42 233 088
99.89%
2.00%
15
Belgium
108
249
357
8 974 783
21 969 171
30 943 954
71.00%
1.46%
16
Turkey
429
1 112
1 541
5 994 812
21 970 706
27 965 518
78.56%
1.32%
17
Indonesia
2 232
89
2 321
24 139 035
2 704 715
26 843 751
10.08%
1.27%
18
Switzerland
18
396
414
928 432
25 794 797
26 723 229
96.53%
1.26%
19
India
875
195
1 070
16 396 087
10 013 434
26 409 521
37.92%
1.25%
20
United Arab Emirates
119
941
1 060
525 959
24 431 420
24 957 380
97.89%
1.18%
21
Russian Federation
1 464
322
1 786
9 184 626
14 682 694
23 867 320
61.52%
1.13%
22
Iran (Islamic Republic of)
246
8
254
18 898 257
352 889
19 251 146
1.83%
0.91%
23
Netherlands
692
515
1 207
5 577 088
13 185 003
18 762 090
70.27%
0.89%
24
Saudi Arabia
151
111
262
13 397 363
3 422 203
16 819 566
20.35%
0.79%
25
Italy
481
170
651
10 296 714
5 900 509
16 197 223
36.43%
0.77%
26
Brazil
292
91
383
4 735 593
9 120 015
13 855 608
65.82%
0.65%
27
France, metropolitan
98
327
425
1 592 919
12 004 098
13 597 017
88.28%
0.64%
28
Viet Nam
929
166
1 095
9 491 311
3 043 458
12 534 769
24.28%
0.59%
29
Cyprus
134
177
311
5 166 089
7 174 723
12 340 812
58.14%
0.58%
30
Canada
210
164
374
2 569 373
7 212 024
9 781 397
73.73%
0.46%
31
Oman
5
58
63
5 704
8 926 419
8 932 123
99.94%
0.42%
32
Malaysia
456
163
619
6 587 734
2 158 859
8 746 592
24.68%
0.41%
33
Qatar
57
69
126
1 123 717
6 145 431
7 269 149
84.54%
0.34%
34
Nigeria
198
73
271
3 517 645
3 429 887
6 947 532
49.37%
0.33%
35
Sweden
90
208
298
1 004 333
5 448 524
6 452 857
84.44%
0.30%
Subtotal, top 35 shipowners
20 729
27 002
47 731
543 900 223
1 466 373 485
2 010 273 707
72.94%
94.99%
Rest of the world unknown
3 096
3 146
6 242
37 011 088
69 116 093
106 127 181
65.13%
5.01%
World
23 825
30 148
53 973
580 911 310
1 535 489 578
2 116 400 888
72.55%
100.00%
Source: UNCTAD calculations, based on data from Clarksons Research.
Notes: Propelled seagoing vessels of 1,000 gross tons and above, as of 1 January 2021. For the purposes of this table, second
and international registries are recorded as foreign or international registries, whereby, for example, ships belonging to owners
in the United Kingdom but registered in Gibraltar or on the Isle of Man are recorded as being under a foreign or international
flag. In addition, ships belonging to owners in Denmark and registered in the Danish International Ship Register account for
48 per cent of the Denmark-owned fleet in dead-weight tonnage, and ships belonging to owners in Norway registered in the
Norwegian International Ship Register account for 28 per cent of the Norway-owned fleet in dead-weight tonnage.
For a complete listing of nationally owned fleets, see http://stats.unctad.org/fleetownership.
36
2. Maritime transport and infrastructure
Rising value of the fleet: a sign of confidence?
The commercial value of a vessels depends on many considerations, including: size, type, builder, age,
classification status, certifications, ship condition and maintenance, added technology, and engine and
fuel efficiency. Values are also influenced by prevailing conditions in shipping and financial markets. As of
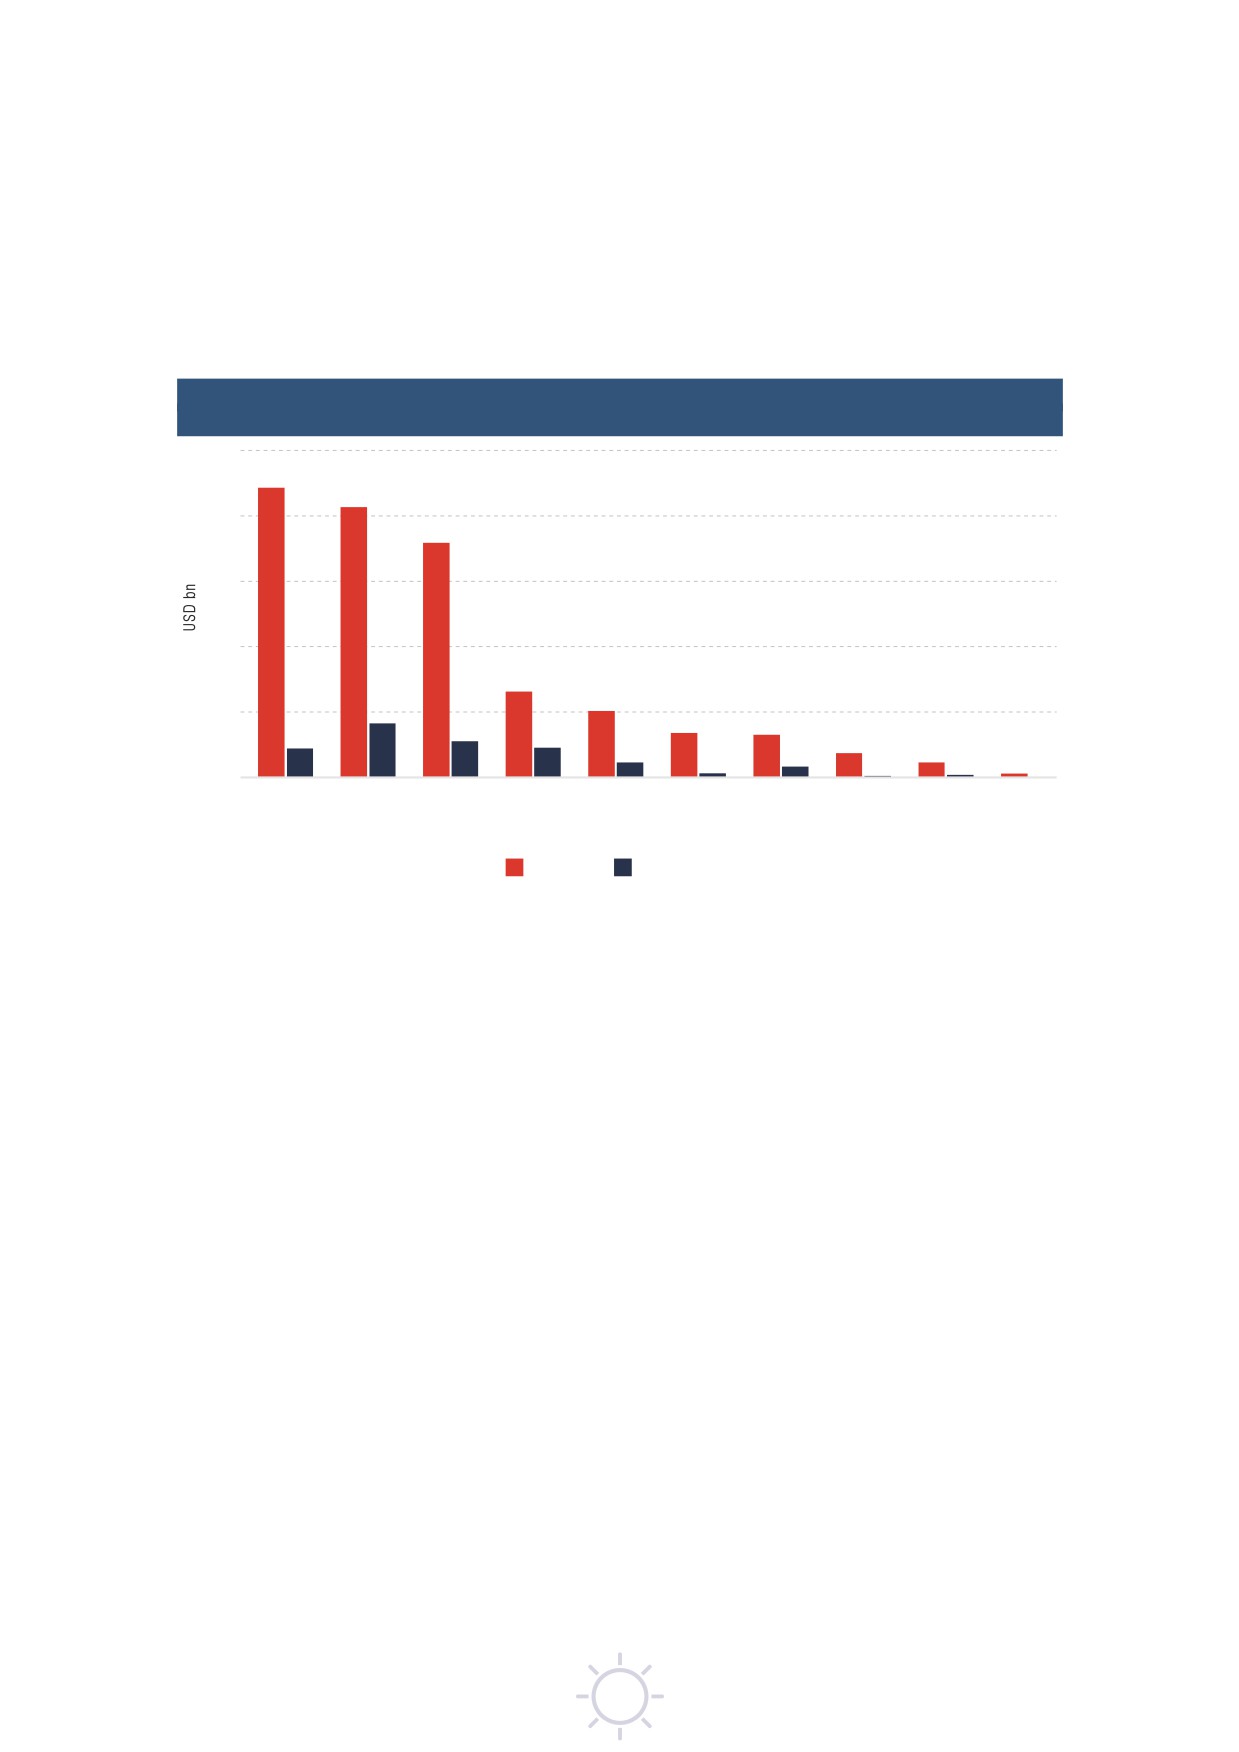
1 June 2021, the highest value was in bulk carriers at 27 per cent, followed by container ships at 25 per
cent, and tankers at 22 per cent (figure 2.7). For ships on order, the highest value was in container ships
30 per cent, followed by tankers at 20 per cent and LNG carriers at 16 per cent.
Figure 2.7
Live and on-order global fleet by ship type
(billions of United States dollars)
250
200
150
100
50
0
Bulk
Container
Oil
LNG
Offshore
Small
LPG
Vehicle
Roll-on
Reefers
carriers
ships
tankers
carriers
supply
dry cargo
carriers
carriers
roll-off
vessels
vessels
cargo ships
Live Fleet
On Order Fleet
Source: UNCTAD, based on data from VesselsValue, as of 1 June 2021.
Note: Includes all vessels above 1,000 GT.
Second-hand ship prices can be quite volatile. Since the last quarter of 2020, there have, for example,
been significant increases in the value of container ships. Between end-2020 and mid-June 2021
the Containership Secondhand Price Index increased by 71 per cent. Sales were at their highest
since 2013, reflecting the demand for smaller container ships of between 5 and 15 years old (Clarksons
Research, 2021a).
There have also been significant increases in the prices for second-hand bulk carriers. Since October 2020,
the Bulk Carrier Secondhand Price Index has been steadily increasing - during the first half of 2021
prices of various vessel sizes aged between 5 and 10 years rose by between 25 and 50 per cent
(Miller,
2021). Higher prices reflect strong short-term market confidence, based on rising commodity
prices, high earnings for bulk carriers and projections for increasing global seaborne bulk trade (Clarksons
Research, 2021b). Since the beginning of 2021, sales have been at their highest for the past five years
(Roussanoglou, 2021a).
To a great extent, selling and purchasing decisions are driven by expected future profitability
(Haralambides et al. 2005). In times of tight vessel supply, higher freight rates drive up the prices of ships
(see chapter 3). The stronger market for used vessels may also signal a return in investor confidence. By
buying second-hand ships, companies can expand rapidly by acquiring almost instantly available tonnage
(Sancricca, 2016).
Developing economies remain the main providers of ship registration
As of 1 January 2021, in terms of both carrying capacity (table 2.5) and commercial value of the fleet,
the top three flags of registration remained those of Panama, Liberia and Marshall Islands (table 2.6).
Among the top 35 flags of registration, the greatest increases were in Viet Nam by 12.1 per cent,
from 9,868 to 10,269 thousand dwt, and in the Russian Federation, by 10.4 per cent, from 9,164 to
10,899 thousand dwt. In terms of value, the greatest increase was in Nigeria whose share of the world
merchant fleet value increased from 0.50 to a 0.78 per cent.
37
Table 2.5
Leading flags of registration by dead-weight tonnage, 2021
Dead-weight
Share of
Cumulative
Share
tonnage
total world
share of
Average
Growth in
of world
(thousands
dead-weight
dead-weight
vessel size
dead-weight
Number
vessel total
dead-weight
tonnage
tonnage
(dead-weight
tonnage
Flag of registration
of vessels
(percentage)
tons)
(percentage)
(percentage)
tonnage)
2020 to 2021
1
Panama
7 980
8
344 200
16.1
16.1
43 133
4.6
2
Liberia
3 942
4
300 088
14.1
30.2
76 126
8.9
3
Marshall Islands
3 817
4
274 041
12.8
43.0
71 795
4.7
4
Hong Kong, China
2 718
3
205 092
9.6
52.6
75 457
1.8
5
Singapore
3 321
3
136 400
6.4
59.0
41 072
-2.6
6
Malta
2 137
2
116 407
5.5
64.5
54 472
0.5
7
China
6 653
7
107 583
5.0
69.5
16 171
5.0
8
Bahamas
1 323
1
74 289
3.5
73.0
56 152
-4.3
9
Greece
1 236
1
64 850
3.0
76.0
52 468
-6.0
10
Japan
5 201
5
39 091
1.8
77.9
7 516
-3.6
11
Cyprus
1 051
1
33 976
1.6
79.5
32 328
-1.6
12
Indonesia
10 427
10
28 750
1.3
80.8
2 757
6.0
13
Danish International
602
1
24 735
1.2
82.0
41 089
6.9
Register
14
Madeira
578
1
22 726
1.1
83.0
39 318
9.7
15
Norwegian Int'l Register
671
1
22 093
1.0
84.1
32 926
5.7
16
Isle of Man
319
0
22 011
1.0
85.1
68 999
-8.7
17
Iran (Islamic Republic of)
893
1
20 417
1.0
86.0
22 863
3.1
18
India
1 801
2
17 054
0.8
86.8
9 469
-2.1
19
Republic of Korea
1 904
2
15 723
0.7
87.6
8 258
4.9
20
Saudi Arabia
392
0
13 662
0.6
88.2
34 853
-1.7
21
United States
3 625
4
12 456
0.6
88.8
3 436
-0.4
22
United Kingdom
927
1
12 063
0.6
89.4
13 013
-0.2
23
Italy
1 296
1
11 255
0.5
89.9
8 685
-6.1
24
Russian Federation
2 873
3
10 899
0.5
90.4
3 794
10.4
25
Viet Nam
1 926
2
10 269
0.5
90.9
5 332
12.1
26
Malaysia
1 769
2
10 231
0.5
91.4
5 783
-1.6
27
Belgium
201
0
9 603
0.4
91.8
47 774
-4.5
28
Bermuda
147
0
8 053
0.4
92.2
54 781
3.0
29
Germany
598
1
7 618
0.4
92.6
12 740
-10.7
30
Taiwan Province of China
429
0
7 136
0.3
92.9
16 635
5.3
31
Netherlands
1 199
1
6 807
0.3
93.2
5 677
-3.4
32
Cayman Islands
160
0
6 725
0.3
93.5
42 032
0.1
33
Turkey
1 217
1
6 425
0.3
93.8
5 279
-9.2
34
Antigua and Barbuda
677
1
6 402
0.3
94.1
9 456
-3.5
35
Philippines
1 805
2
6 240
0.3
94.4
3 457
-5.3
Top 35
75 815
76
2 015 370
94.4
94.4
26 583
2.7
World total
99 800
100
2 134 640
100.0
100.0
21 389
3.0
Source: UNCTAD calculations, based on data from Clarksons Research.
Notes: Propelled seagoing merchant vessels of 100 gross tons and above, as of 1 January 2021. For a complete listing of
countries, see http://stats.unctad.org/fleet.
Dead-weight tons for individual vessels have been estimated.
38
2. Maritime transport and infrastructure
Table 2.6
Leading flags of registration, ranked by value of total tonnage, 2021
(million US dollars) and principal vessel types
Ferries and
General
Bulk
Container
Offshore
Oil
passenger
Gas
cargo
Chemical
Other/ not
Flag of Registration
carriers
ships
vessels
tankers
ships
carriers
ships
tankers
applicable
Total
1
Panama
46 903
23 289
14 056
12 065
12 786
10 108
3 768
5 260
6 314
134 550
2
Marshall Islands
32 671
8 217
12 787
26 845
1 513
14 537
430
4 470
1 917
103 388
3
Liberia
29 781
26 351
10 520
20 941
430
5 977
796
2 862
1 439
99 097
4
Bahamas
5 177
706
22 781
6 521
28 250
12 000
65
74
2 303
77 878
5
Hong Kong, China
25 050
25 442
260
10 404
42
6 439
1 318
1 687
105
70 747
6
Malta
10 205
14 925
4 240
9 448
15 166
6 407
1 740
1 661
834
64 626
7
Singapore
13 509
16 531
7 589
11 445
7 947
803
3 560
1 189
62 571
8
China
16 555
5 609
7 728
8 023
4 159
731
2 885
1 668
3 079
50 436
9
Italy
650
196
284
852
15 027
200
1 826
327
621
19 985
10
Greece
3 305
245
1
8 375
1 338
5 388
52
82
22
18 808
Subtotal top 10
183 806
121 512
80 246
114 918
78 711
69 735
13 684
21 651
17 823
702 087
Other
28 649
37 260
68 847
32 846
41 571
26 375
22 785
11 375
13 561
283 269
World total
212 455
158 771
149 093
147 764
120 282
96 110
36 470
33 026
31 384
985 356
Source: UNCTAD calculations, based on data from Clarksons Research, as at 1 January 2019 (estimated current value).
Note: Value is estimated for all commercial ships of 1,000 gross tons and above.
3. Shipbuilding, new orders and ship recycling
Two-thirds of world ship building was of dry bulk carriers and tankers
In 2020, ship deliveries declined by 12 per cent, mainly due to lockdown-induced labour shortages during
the first half of the year that disrupted marine-industrial activity. As in 2018 and 2019, the ships delivered
were mostly bulk carriers, followed by oil tankers and container ships (table 2.7). Since 2015, an increasing
proportion of shipbuilding has taken place in just four countries - China, the Republic of Korea, Japan,
and the Philippines. In 2020, their combined market share rose to 96 per cent.
Table 2.7
Deliveries of newbuildings by major vessel types and countries
of construction, 2020
(thousand gross tons)
Republic
Rest of the
Vessel type
China
of Korea
Japan
Philippines
world
Total
Percentage
Bulk carriers
15 051
1 442
9 383
551
311
26 738
46
Oil tankers
2 702
7 071
1 901
1
478
12 152
21
Container ships
2 665
5 357
394
56
200
8 671
15
Gas carriers
869
4 046
353
7
5 275
9
Ferries and passenger ships
251
64
76
1 208
1 600
3
Chemical tankers
488
88
465
55
1 095
2
General cargo
390
1
142
360
893
2
Offshore
340
101
7
118
566
1
Other
501
4
107
162
775
1
Total
23 257
18 174
12 827
608
2 898
57 765
100
Percentage
40
31
22
1
5
100
Source: UNCTAD calculations, based on data from Clarksons Research.
Notes: Propelled seagoing merchant vessels of 100 gross tons and above. For more data on other shipbuilding countries,
39
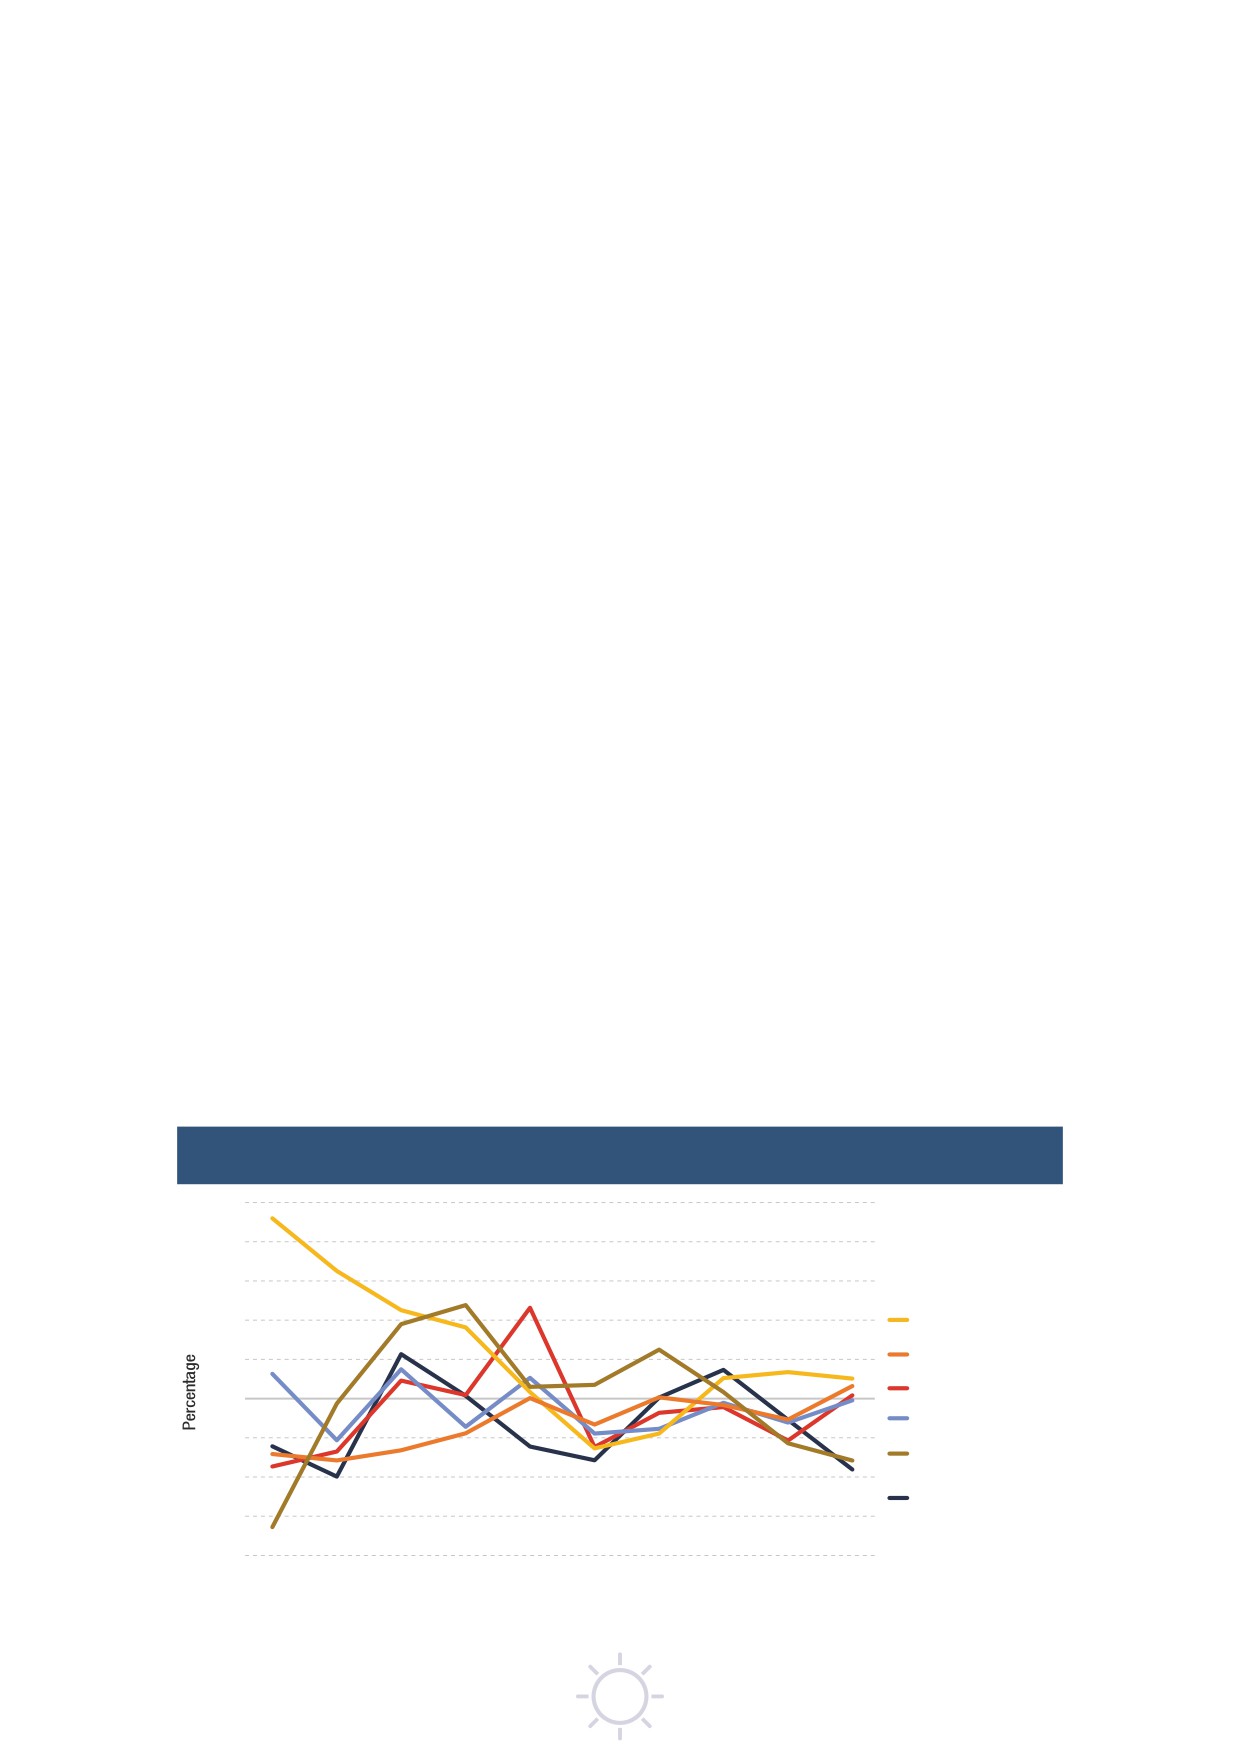
China has the largest share at around 40 per cent. Since the 1980s, based on cost advantages
and with strong government policy support, China's shipbuilding industry has sought to improve
its capabilities and expand capacity. In 1982, the shipbuilding ministry was ‘corporatized’ as the
China State Shipbuilding Corporation (CSSC) which now administers most commercial and military
shipbuilding. This prioritized development in prosperous coastal regions through decentralized
organization of diverse related industries. Focussing on international demand, the industry also had
greater access to foreign capital, and in the last two decades Chinese companies have entered into
technology-sharing agreements with foreign shipbuilders giving them access to foreign equipment,
materials and technical expertise. R&D institutes and academic organizations in China have also
enhanced their research, development and design capabilities (Market and Research News, 2021
and Medeiros et al. 2021). As a result, over recent years China has improved its building techniques
and efficiency and increased its market share not just for bulk carriers and container ships but also for
segments where it has previously not operated, such as passenger ships and LNG carriers (Hellenic
Shipping News, 2021).
New orders
Between January 2020 and January 2021, the global orderbook declined by 16 per cent. The sharpest
reductions were for bulk carriers, down 36 per cent, followed by ferries and passenger ships, down 32 per
cent. By contrast, other segments grew: liquefied gas carriers, up 10 per cent, and general cargo ships,
up 6 per cent (figure 2.8).
From a longer-term perspective, the fleet orderbook has been shrinking since
2011, reaching
165,520,744 dwt in January 2021, the lowest level for the last decade. This is largely the result of constraints
on finance combined with uncertainty over future choices of energy sources, and compounded from 2020
by the impacts of COVID-19 on trade volumes and economic activity. At the beginning of 2021, order
levels for container ships were similar to those in 2018, for bulk carriers to those in 2004-2006, and for oil
tankers to those in 2001, 2003 and 2020 (figure 2.9).
Since early 2021, however, there has been a surge of new orders. As world trade gradually recovered
during the second half of 2020 and the first half of 2021, demand for ships increased - responding
to severe fleet capacity constraints and the uptick in freight rates. In the first half of 2021, newbuild
investment was at its highest since the first half of 2014 (Bak, 2021), with record-breaking orders for
container ships - almost eight times those in the first half of 2020. New building orders were spearheaded
by those for Panamax container ships (ShipInsights, 2021). There has also been an increase for LNG
carriers (Roussanoglou, 2021b).
The largest increases in orders during this period were for Chinese and Korean shipbuilders (Maritime
Executive, 2021). However, these orders appear to be concentrated in a few shipyards - which could
increase average contract lead times and hinder fleet growth (Springer, 2021, and Walia, 2021).
Figure 2.8
Growth of world fleet orderbook, 2012-2021, percentage change in dead-weight
tonnage
100
80
60
40
Lique ed gas carriers
General cargo ships
20
Oil tankers
0
Container ships
-20
Ferries and
-40
passenger ships
Bulk carriers
-60
-80
2012
2013
2014
2015
2016
2017
2018
2019
2020
2021
Source: UNCTAD calculations, based on data from Clarksons Research.
Notes: Propelled seagoing merchant vessels of 100 gross tons and above; beginning-of-year figures.
40
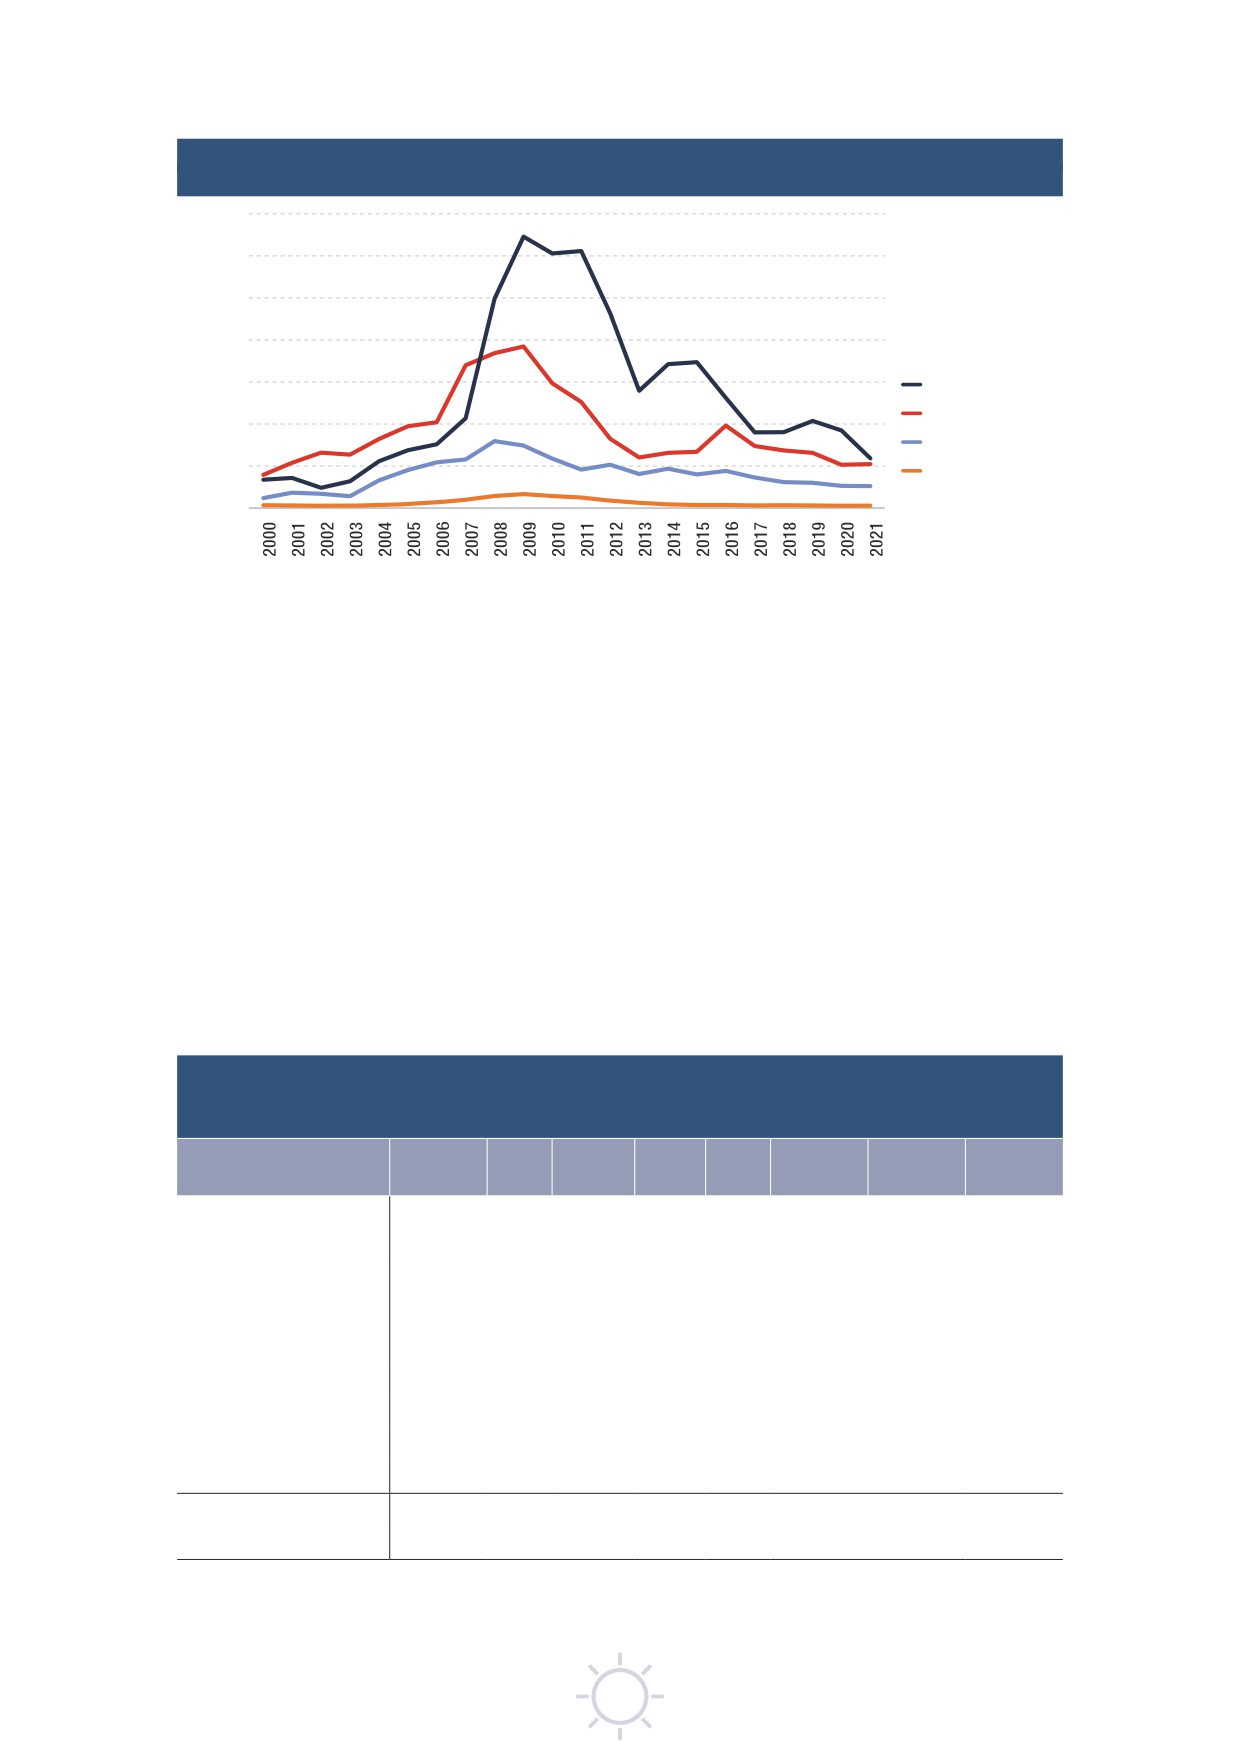
2. Maritime transport and infrastructure
Figure 2.9
World tonnage on order, selected ship types, 2000-2021
(thousand dead-weight tons)
350 000
300 000
250 000
200 000
150 000
Dry bulk carriers
Oil tankers
100 000
Container ships
50 000
General cargo ships
0
Source: UNCTAD calculations, based on data from Clarksons Research.
Notes: Propelled seagoing merchant vessels of 100 gross tons and above; beginning-of-year figures.
Ship recycling
Even through the COVID-19 disruption, the tonnage of ships sold for recycling increased by 44 per cent
in 2020, reaching 17,400,564 GT. Nevertheless, recycling levels remain lower than in the 2014-2017
period. Despite high scrap metal prices, ship owners believe they can continue to earn high incomes by
continuing to operate older vessels.
In 2020, almost half of the recycling was of bulk carriers, reflecting declining charter rates and following
the trend of recycling ageing tonnage (Jiang, 2021 and Clarksons Research, 2021c). Around two-thirds
of reported tonnage sold for recycling in 2020 was in Bangladesh and India. With the addition of Pakistan
and Turkey, the share of the top four countries reached 93 per cent (table 2.8). The highest increases in
shares were for Pakistan, by 14.7 percentage points, and for India by 3.2 percentage points.
In contrast, there were noticeable reductions in Bangladesh, by 15 percentage points, and in China by
2 percentage points. In China, this follows a ban on receiving international vessels for recycling, which
Table 2.8
Reported tonnage sold for ship recycling by major vessel type and country
of ship recycling, 2020
(thousand gross tons)
Rest of the
Vessel type
Bangladesh
India
Pakistan
Turkey
China
world
World total
Percentage
Bulk carriers
5 254
1 317
1 718
34
125
61
8 509
48.9
Container ships
160
1 428
282
206
68
2 143
12.3
Oil tankers
616
410
617
159
10
226
2 038
11.7
Offshore supply
125
257
4
308
3
273
969
5.6
Ferries and passenger ships
26
279
545
3
26
879
5.1
General cargo ships
176
219
175
203
47
29
848
4.9
Liquefied gas carriers
169
241
8
176
594
3.4
Chemical tankers
12
125
94
1
10
241
1.4
Other/ n.a.
157
786
135
9
93
1 180
6.8
Total
6 694
5 061
2 890
1 598
195
962
17 401
100.0
Percentage
38.5
29.1
16.6
9.2
1.1
5.5
100.0
Source: UNCTAD calculations, based on data from Clarksons Research.
Notes: Propelled seagoing vessels of 100 gross tons and above. Estimates for all countries available at http://stats.unctad.org/
shiprecycling.
41

entered into force in 2018. Between 2017 and 2020, China’s share of global recycling tonnage fell from 16
to 1 per cent.
The extent of ship recycling depends on a number of factors, including vessel age, freight markets, and
trade patterns (OECD, 2019). In addition, ship owners have to take into account new environment-related
regulations, such as IMO limits on the sulphur content of ship fuel oil, the IMO Ballast Water Management
Convention, and emerging IMO regulations on decarbonization. When capital expenditures for retro-fitting
older ships to comply with new regulations exceed the return on investment, owners are likely to favour
recycling.
B. SHIPPING COMPANIES AND OPERATIONS: ADAPTING MARITIME
TRANSPORT SUPPLY IN AN UNCERTAIN ENVIRONMENT
1. Expanding and renewing the global fleet
Until recently, there was a structural oversupply of maritime transport and, especially from the onset of
the pandemic, ship owners had been cutting capacity. Since 2021, however, supply has lagged behind
demand, leading to higher freight rates (UNCTAD, 2021a).
This situation poses fundamental questions about the future of maritime transport. Owners now have
to decide what ships they require to expand and renew their fleets, and must do so in an uncertain
environment. This also means taking into account significant regulatory changes, particularly those
related to decarbonization and the aim of zero emissions (Shell and Deloitte, 2020). To achieve this,
the industry needs to consider measures and technologies that can improve ship efficiency. These
include:
• Lightweight materials
• Slender hull design
• Propulsion improvement
• Bulbous bows
• Air lubrication systems
• Advanced hull coating
• Ballast water-system design
• Engine and auxiliary systems improvement
• Higher efficiency standards
Some of these options are being incorporated in newbuilds or in the orderbook but, as indicated in
table 2.9, they have yet to be widely deployed in the global fleet. Others are not yet economically viable
(Balcombe et al. 2019).
Table 2.9
Status of uptake of selected technologies in global shipping, as of 14 June 2021
Equipment type
Energy-saving technologies
Ballast water management systems
(Modern) eco-engine
Fleet, number of ships
3 929
18 925
6 698
Percent of fleet
3.9%
18.8%
6.7%
(Percent of GT capacity)
(19.0%)
(59.5%)
(25.7%)
Orderbook
254
2 078
Percent of orderbook
6.8%
55.3%
(Percent of GT capacity)
(13.2%)
(91.6%)
Source: Clarksons Research (2021). Tracking “Green” Technology Uptake - June 2021 and Eco-fleet dashboard. Shipping
Intelligence Network.
Notes: As of 14th June 2021, the global fleet (vessels above 100GT) stood at 100,500 ships, as per Clarksons data. Energy-
saving technologies encompass waste heat recovery systems, exhaust gas economizers, propeller ducts, pre-Swirl or stator
fins, rudder bulbs, rigid sails, air lubrication system, bow enhancement and solar panels. Modern eco-engine refers to a vessel
with an electronic injection main engine contracted after 1st January 2012.
Data based on reported equipment in merchant fleet, which may underestimate total uptake.
42
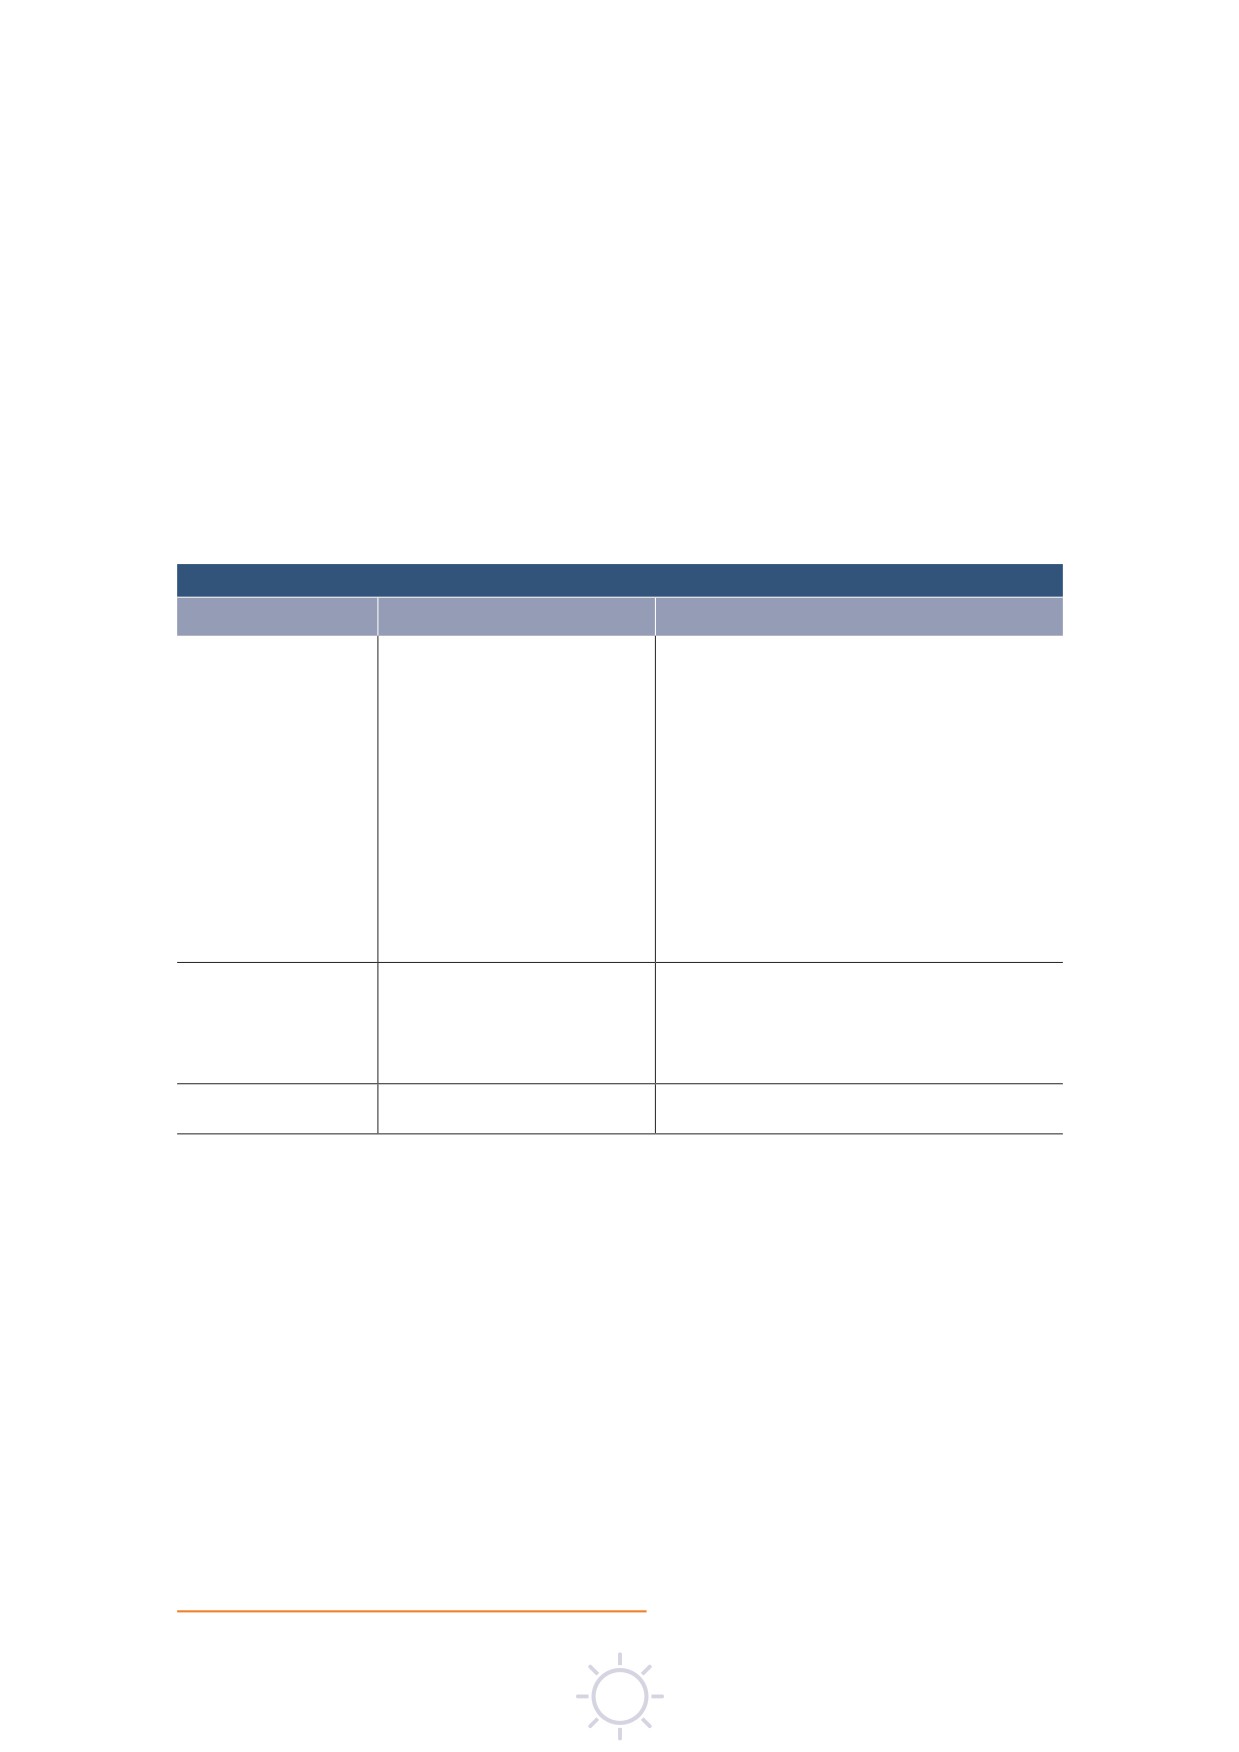
2. Maritime transport and infrastructure
Responding to this challenge will require significant investment. Expanding the fleet to cater for trade
growth over the coming three decades could cost around $0.2 trillion while retrofitting or replacing the
existing fleet over the next 30 years, could cost an additional $2.19 trillion (Ovcina, 2021).1 Since it is
impossible to renew the whole fleet by 2050, innovation and new technologies will also need to be applied
to existing vessels.
2. Decarbonization without a crystal ball
Uncertain decarbonization scenarios
In 2018, the IMO adopted a sector reduction pathway consistent with the Paris Agreement. The aim is
by 2050 to reduce total annual greenhouse gas emissions by at least 50 per cent of 2008 levels, while
reducing carbon intensity by at least 40 per cent by 2030, and 70 per cent by 2050. These objectives are
to be achieved through a combination of short-, mid- and long-term measures, with quantitative targets
until 2050. Table 2.10 summarizes some proposed measures.
Table 2.10
Some proposed IMO measures to reduce greenhouse gas emissions
Category
Subcategories
Examples of measures
Short-term measures, to be
• Technical and operational
• New operational energy-efficiency standards for new
agreed upon between 2018
energy-efficiency measures
and existing ships (EEXI)
and 2023
• Use of alternative low-carbon
• Consider and analyse the use of speed optimization and
or zero-carbon fuels for marine
reduction
propulsion and other technologies
• Developments of port infrastructure to support
alternative fuels
• Progressive tightening of standards on minimum energy
efficiency levels and emissions, based on ship design
and engine performance data (CII)
• R&D efforts on marine propulsion with alternative fuels
• Encourage the development of national action plans to
develop policies and strategies to address greenhouse
gas emissions from international shipping
Mid-term measures, to be
• Market-based measures - carbon
• Market-based measures could include an offsetting
agreed upon between 2023
pricing mechanisms to give firms
scheme, a maritime emissions trading scheme, or a
and 2030
economic incentives to emit less
carbon levy
• Operational energy efficiency
• Specify in the national action plan measures to increase
measures for new and existing ships
the uptake of low- and zero-carbon fuels
Long-term measures
• Measures to ensure zero-carbon and
(to be agreed beyond 2030)
fossil-free fuels
Sources: IMO (2018), Kachi et al. (2019).
Note: Some measures mentioned in this table have been agreed at the IMO (short-term measures including EEXI and CII)
whereas others have not.
At present, the regulatory outlook is uncertain. The IMO has yet to agree on a number of issues, such as
the market-based mechanism, and the outcome is likely to be combination of measures. Moreover, the
IMO regulations will be accompanied by those from other bodies such as the EU. On 14 July 2021 the EU
announced a series of measures:
• Including ships of 5,000 GT and above in its Emissions Trading System for all intra-EEA voyages
and for 50 per cent of voyages starting and ending in the bloc.
• Establishing greenhouse gas intensity standards for ship fuels.
• Introducing taxes on bunkers sold in the European Economic Area.
The interplay between different regulatory regimes, combined with volatility in carbon prices is generating
considerable uncertainty - which is compounded by the difficulty in modelling the outcome of each
measure (ING, 2021). Total emissions will depend on ship type, size and engine, as well as on sea routes
1
These projections exclude fuel transition-related investments, such as storage and transport of alternative fuels.
43
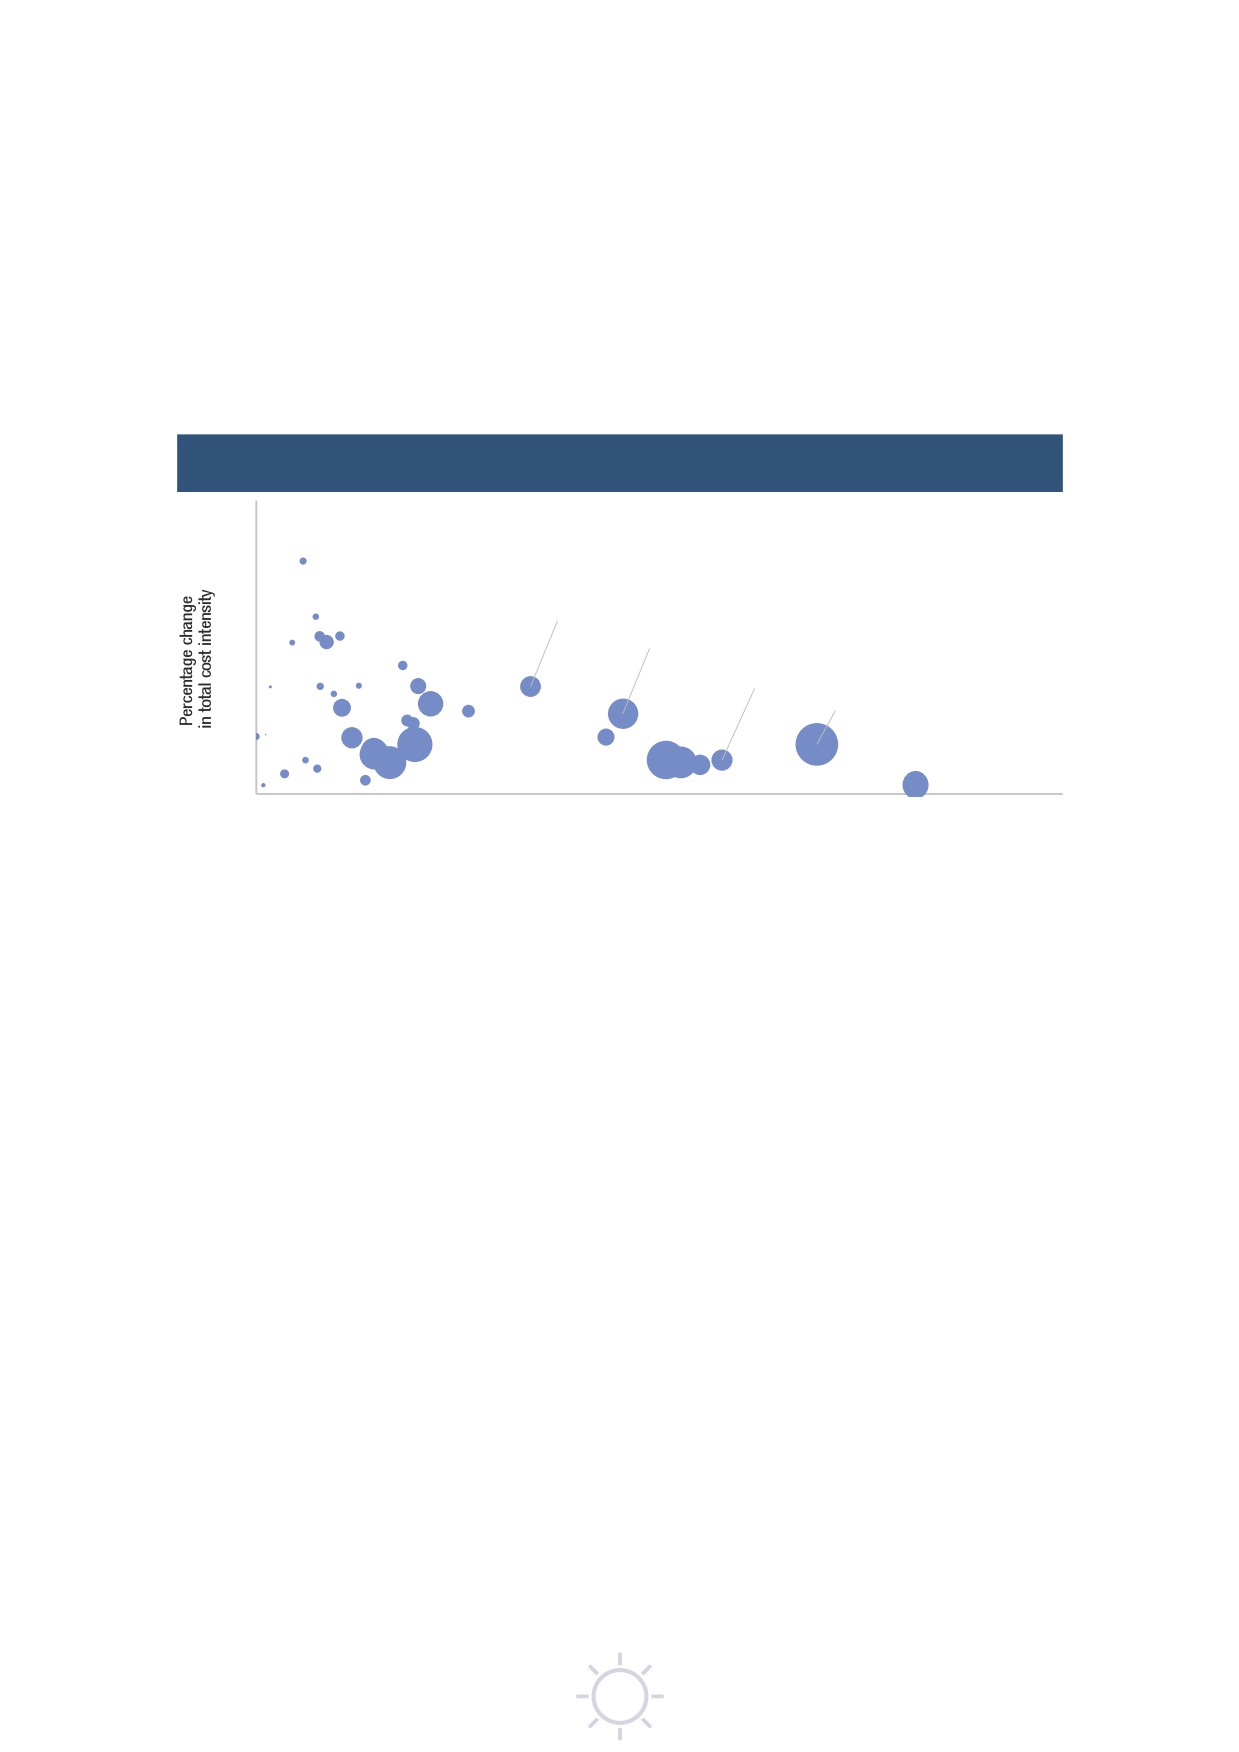
and navigation conditions - information which may not be easily accessible (Sanchez et al, 2020 and
Plevrakis, 2020).
Since 2020, UNCTAD has been collaborating with IMO on assessing the impact of short-term measures.
In a report published in 2021, UNCTAD looks at the combined impact of two measures: a new energy
standard, the energy efficiency existing ship index; and a new operational requirement, the carbon intensity
indicator (UNCTAD, 2021b). The report considers their potential impacts on ship costs, travel distances,
fleet distribution, routing patterns, and the use of different types of vessels as well as on maritime logistics
costs. The report concludes that the greatest impact will be on smaller vessels plying shorter routes and
on container ships and tanker vessels (figure 2.10).
Figure 2.10
Percentage change in cost intensity by ship segment,
average size and median distance travelled
60
Container 0-999 TEU
50
Oil tanker 5000-9999 dwt
Oil tanker 60000-79999 dwt
40
Oil tanker 120000-199999 dwt
30
Bulk carrier 60000-99999 dwt
Oil tanker 200000-+ dwt
20
Lique ed gas tanker
200000-+ cbm
10
0
1000
2000
3000
4000
5000
6000
7000
Median distance travelled (nm)
Source: UNCTAD compiled from DNV and MarineTraffic data.
Notes: Size of the bubbles stands for the average ship size per DWT. This figure represents the percentage change in
total cost intensity between (i) the most ambitious greenhouse gas reduction scenario (regulatory scenario including
both EEXI and CII requirements, with an average CII reduction requirement of 21.5 per cent between 2019 and 2030)
and (ii) the 2030 “current regulations scenario (with only adopted EEDI requirements, including those entering into force
in 2022)”.
The easiest and cheapest way to reduce emissions is to reduce ship speed. Operating at less than full
power cuts fuel consumption, and thus carbon emissions, while reducing operating costs. However,
transporting the same cargo volumes at slower speeds will also require more ships. The report estimates
that the IMO short-term measures will require 13 per cent more vessel capacity. This will entail considerable
capital expenditure and have important implications for shipbuilders. Drewry estimates that global
shipbuilding capacity is equivalent to 7 per cent of the global fleet and that, while maintaining also normal
fleet replacement and growth, increasing vessel capacity by 13 per cent would require a ramp-up period
of around five years (UNCTAD, 2021b).
The study points out that reducing speeds will also mean reconfiguring services - especially for Pacific
and Caribbean SIDS where the maritime trade typically depends on smaller cargo ships on shorter routes.
Smaller ships will also be needed, when a deep-sea liner that is going slower now needs to skip a
port - which would require more transhipment, thereby increasing costs.
Uncertain energy transition pathways
The path towards shipping decarbonization involves not just ship design and improvements in technology
but also the use of alternative fuels. As indicated in table 2.11, the shipping industry uses a range of fuels,
though the predominant ones are traditional liquid ones, such as very-low-sulphur intermediate fuel oil
(VLS IFO) and intermediate fuel oil with a maximum viscosity of 380 centistokes (IFO380), along with VLS
marine diesel oil.
There is certainly significant scope for moving the existing fleet to alternative fuels but there are many areas
of uncertainty, and the shift to net-zero fuels has barely begun. For alternative fuels it is important to ensure
their safety and consider upstream emissions from their production (see box 2.1).
44
Table 2.11
World fleet by fuel type as of 1 January 2021
Ships % of
GT % of known
TEU % of known
Dwt % of known
Fuel type
Ships
GT
TEU
dwt
Ships %
GT %
TEU %
Dwt %
known fuel type
fuel type
fuel type
fuel type
Very Low-Sulphur (VLS) Intermediate Fuel Oil (IFO)
36 188
993 715
259
18 384 210
1 534 083
046
36.26
69.08
70.97
72.11
47.12
72.26
71.29
74.54
VLS Marine Diesel Oil (MDO)
33 118
29 698
675
149 929
27 886
341
33.18
2.06
0.58
1.31
43.12
2.16
0.58
1.36
IFO 380*
3 635
283 299
533
6 949 482
437 386
040
3.64
19.69
26.83
20.56
4.73
20.60
26.95
21.25
VLS Marine Gasoil (MGO)
2 539
7 441
142
34 467
6 769
951
2.54
0.52
0.13
0.32
3.31
0.54
0.13
0.33
Ultra-Low Sulphur (ULS) MDO
381
697
587
7 000
661
627
0.38
0.05
0.03
0.03
0.50
0.05
0.03
0.03
LNG, VLS IFO
373
36 964
811
144 014
30 159
817
0.37
2.57
0.56
1.42
0.49
2.69
0.56
1.47
LNG, VLS MDO
168
10 814
060
12 703
8 190
743
0.17
0.75
0.05
0.39
0.22
0.79
0.05
0.40
IFO 180
166
7 351
589
75 955
9 536
173
0.17
0.51
0.29
0.45
0.22
0.53
0.29
0.46
ULS IFO
43
352
580
15 617
438
639
0.04
0.02
0.06
0.02
0.06
0.03
0.06
0.02
LNG, VLS MGO
37
424
846
10
430
662
0.04
0.03
0.00
0.02
0.05
0.03
0.00
0.02
LNG
32
459
380
260
139
039
0.03
0.03
0.00
0.01
0.04
0.03
0.00
0.01
MDO
22
652
797
1 629
188
652
0.02
0.05
0.01
0.01
0.03
0.05
0.01
0.01
ULS MGO
22
26
594
16
571
0.02
0.00
0.00
0.03
0.00
0.00
Biofuel
18
360
677
11 684
386
434
0.02
0.03
0.05
0.02
0.02
0.03
0.05
0.02
MGO
12
880
222
122
003
0.01
0.06
0.01
0.02
0.06
0.01
Methanol, VLS IFO
11
336
377
552
044
0.01
0.02
0.03
0.01
0.02
0.03
Ethane, VLS IFO
7
292
595
264
750
0.01
0.02
0.01
0.01
0.02
0.01
Nuclear
6
144
573
1 324
50
079
0.01
0.01
0.01
0.00
0.01
0.01
0.01
0.00
LPG, VLS IFO
5
236
752
272
690
0.01
0.02
0.01
0.01
0.02
0.01
Biofuel, LNG
4
43
851
3
907
0.00
0.00
0.00
0.01
0.00
0.00
Compressed Natural Gas (CNG), VLS MDO
3
111
058
105
325
0.00
0.01
0.00
0.00
0.01
0.01
IFO 380, LNG
2
251
144
18
400
0.00
0.02
0.00
0.00
0.02
0.00
MDO, MGO
2
183
254
16
030
0.00
0.01
0.00
0.00
0.01
0.00
Biofuel, VLS MGO
2
6
810
9
876
0.00
0.00
0.00
0.00
0.00
0.00
VLS IFO, Well Fuel
1
86
952
166
546
0.00
0.01
0.01
0.00
0.01
0.01
CNG, VLS MGO
1
30
742
31
473
0.00
0.00
0.00
0.00
0.00
0.00
LNG, MDO
1
65
314
600
22
437
0.00
0.00
0.00
0.00
0.00
0.00
0.00
0.00
IFO 380*, MGO
1
149
215
19
189
0.00
0.01
0.00
0.00
0.01
0.00
Methanol
1
51
837
10
670
0.00
0.00
0.00
0.00
0.00
0.00
Nuclear, VLS MDO
1
33
500
9
000
0.00
0.00
-
0.00
0.00
0.00
-
0.00
Unknown fuel type
22 998
63 435
988
115 238
69 356
421
23.04
4.41
0.44
3.26
Grand Total
99 800
1 438 599
714
25 904 122
2 127 304
575
100.00
100.00
100.00
100.00
World total known fuel type
76 802
1 375 163
726
25 788 884
2 057 948
154
100.00
100.00
100.00
100.00
Source: UNCTAD, based on data provided by Clarksons Research.
Notes: * Intermediate fuel oil with a maximum viscosity of 380 centistokes (<3.5 per cent sulphur).
All variations of MGO, MDO and IFO are traditional fuel types.
Alternative fuels encompass: LNG, LPG, methanol, biofuels, hydrogen, ammonia; synthetic methane and nuclear - highlighted in green.
Fuels that mention a traditional fuel type, along with an alternative fuel (for example: “Ethane, VLS IFO”; “Biofuel, VLS MGO” or “Nuclear, VLS MDO” refer to dual-fuel ships highlighted in light orange.
Box 2.1
Divided views on whether oil should be replaced by LNG
An alternative fuel already widely in use is liquefied natural gas. This is the greenest fossil energy
source, which compared to heavy fuel oil (HFO), could reduce sulphur emissions by 99 per
cent, nitrogen oxides by 80 per cent, and CO2 emissions by up to 20 per cent, along with most
particulate matters. The 2020 Sphera report demonstrated that LNG/dual-fuel engines emit fewer
grams of CO2 equivalent per kw than diesel engines. Dual-fuel engines can use existing technology,
enabling ships to be operated on different types of fuel and comply with regulations while remaining
competitive.
In January 2021 the IMO sulphur cap entered into force, prompting greater investment in bunkering
port infrastructure and in LNG-fuelled ships. Currently, these represent a small share of the fleet and of
the orderbook. But their numbers are expected to grow significantly in the 2021-2022 period.
The major disadvantage of LNG is that it consists primarily of methane which is a far more potent
greenhouse gas than CO2. Even small escapes during production or use could result in a net increase
in GHG emissions. In April 2021, the World Bank published a report that considered holistic lifecycle
emissions and highlighted the impact of LNG on climate change. It recommended countries to avoid
supporting LNG as a bunker fuel and advocated for regulation of methane emissions.
Shipping industry voices, such as Maersk and Euronav, have also questioned the suitability of LNG as a
transition fuel and point to the high costs of investing in new ships and infrastructure while not reducing
lifecycle greenhouse gas emissions - with the danger of technological lock-in since new infrastructure
with be in operation for 20 years. They also perceive such investment as extending the use of carbon
in the maritime energy supply chain and delaying the energy transition.
Sources: Gaztransport Technigaz (GTT). LNG as a marine fuel. Gilbert, P., Walsh C., Traut M., Kesieme U.,
Pazouki K. and Murphy A. (2018). Assessment of full life-cycle air emissions of alternative shipping fuels,
Journal of Cleaner Production, Volume 172, 20 January 2018. Clayton, R. (2019). LNG will be transitional fuel
for 2030, Nor-Shipping hears. Lloyds List News, 03 Jun 2019. Ovcina, J. (2020). Clarksons: 27 per cent of the
order book to run on alternative fuels. Offshore Energy, 1/12/2020. Lloyd’s Register (2021). The complexities
of the fuel supply chain as we move towards zero-carbon. 20/01/2021. World Bank (2021). The role of LNG in
the transition toward low-and zero carbon shipping. Lloyds List (2021). Is LNG really borderline greenwashing?
Lloyds’ List Shipping Podcast, 14/05/2021.
C. PORT SERVICES AND INFRASTRUCTURE SUPPLY
The past year has been very testing for port operations. The impacts of COVID-19, compounded by the
Ever Given incident in the Suez Canal, have resulted in congestion and equipment shortages and have
disrupted supply chains. Nevertheless, ports have remained operational and continued to serve diverse
flows of trade. Their experience has confirmed the importance of preparing for the unexpected and of
building resilience (box 2.2). But the COVID-19 crisis has also opened up new opportunities to diversify
and to create better links between maritime and other modes of transport.
Box 2.2
Building port resilience UNCTAD experience
The UNCTAD TrainForTrade Port Management Programme helps ports in developing countries become
more efficient and competitive. During the pandemic, the programme worked with other United Nations
entities on a joint project to keep transport networks and borders operational - by implementing
standards, guidelines, metrics, tools and methodologies to facilitate the flow of goods and services,
while containing the spread of COVID-19. The project supports governments, including customs and
other border agencies, port authorities, and the business community.
This work includes a course on Building Port Resilience Against Pandemics which addresses four
areas: crisis protocols and communications strategy; staff management, well-being, and resilience;
technology preparedness; and cargo flow continuity.
Discussions during the course indicate that building resilience requires significant changes in port
operations. These would necessarily differ from country to country but this forum allows practitioners
to discuss and exchange experience and ideas and explore responses and actions. They have
concluded that port clients, operators and governmental entities can cooperate to improve their
information systems - aiming for uniformity, consistency and predictability, while minimizing confusion
and uncertainty at times of disruption.
Key to the programme’s success is South-South cooperation. Local instructors deliver training
supported by experts from UNCTAD and other port partners.
Source: Information provided by the UNCTAD TrainForTrade Port Management Programme.
46
2. Maritime transport and infrastructure
Ecommerce, smart logistic hubs and intermodal connections
During the pandemic, consumers sought a safe way to meet their needs, leading to a boom in online
retail sales - which in 2020 amounted globally to $4.28 trillion. This trend is expected to continue: in 2022
e-retail revenues are projected to grow to $5.4 trillion (Statista, 2021).
These higher volumes, combined with expectations for rapid delivery, have boosted the demand for better
logistic facilities - in particular for sufficient warehouses to store products along with space to fulfil and
despatch orders, while also providing value-added services.
Indeed investment decisions and port planning are increasingly being influenced by the expectations
of retailers and logistic operators - who are looking to reduce costs by using seaports close to
warehousing or distribution facilities and their end markets (Drewry 2021). To avoid congestion and
ensure rapid replenishment, ports can offer storage and warehousing capacity and space for modern
logistics.
Ports are also investing in more technology for monitoring supply chains, detecting potential disruption
and generally tracking shipments to their destinations. In 2021, several Asian ports, including Sichuan
and Hainan in China, launched or announced investments in smart logistics (American Journal of
Transportation, 2021 and South China Morning Post, 2021).
To maximize ecommerce logistics operations, port operators need to be able to handle data efficiently
(Drewry, 2021). For this purpose, port logistic are increasingly relying on digitalization - for exchanging
information among customers, partners, suppliers and other actors, and for offering new services
(Logmore, 2019). For example, one of the world’s largest global terminal operators, DP World, has
acquired Syncreon, a global provider of supply chain services (van Marle, 2021).
To take advantage of ecommerce, ports also need to be well connected to their hinterlands. Using
new technology they can become smart logistic hubs that connect maritime and other modes of
transport - facilitating supply chain connections, domestically, regionally and internationally. These need to
operate in a more agile, intermodal fashion at times of congestion and disruption (Schwerdtfeger, 2021).
Box 2.3 describes how intermodal connections can be advanced by best practices, standards and
regulations.
Box 2.3
Guidance and standards for intermodal operations
The UN Economic Commission for Europe (ECE) promotes best practices and standards for sustainable
transport while also developing, and overseeing the implementation of, legal instruments. ECE aims
to support inland freight transport, by improving traffic safety, environmental performance, energy
efficiency, security and efficient service provision.
A recent ECE report, the Handbook for National Masterplans for Freight Transport and Logistics,
provides guidance to governments on how transport and logistic services can, in post-pandemic times,
contribute to economic development and recovery. The report highlights the critical importance for
intermodal operations of intelligent transport systems (ITS) and telematics that enable operators to shift
freight seamlessly across transport modes and networks - to plan routes and deliveries, and optimize
cargo flows and the use of infrastructure.
Maximizing the benefits of ITS to transport operations will mean training the workforce for increased
specialization and technological innovation, and supporting ITS research and development in cost-
efficient solutions. At the same time, there needs to be significant investment, partly through public-
private partnerships, in high-performance digital infrastructure, while ensuring efficient data exchange
and interoperability.
It is also important to agree on legal instruments and standards. An example is the 1991 European
Agreement on Important International Combined Transport Lines and related installations (AGTC). This
agreement aims to make international combined transport in the ECE region more efficient and attractive
to customers, by developing a common infrastructure quality standard for combined transport on the
main European corridors. The framework’s important nodal points include transport terminals, border
crossing points, stations for exchanging wagon groups, gauge-interchange stations, and ferry links and
ports. Facilitating modal shifts enables international freight movements while reducing the damaging
environmental impacts from transporting international freight by road.
Implementing AGTC minimum standards is expected to strengthen critical Euro-Asian railway routes
that can connect Central Asian landlocked ECE members to international markets. To avoid temporary
closure of borders as a result of pandemics, ECE is also considering an agreement for uninterrupted
operation of designated core lines of the network.
47
Box 2.3
Guidance and standards for intermodal operations (cont.)
At present, digital exchange between different modes of transport, sectors and countries is quite
fragmented, so ECE is working on digital standards for harmonizing digital exchange of data and
documents based on existing UN/CEFACT semantic standards and reference data models. These will
allow for interoperability along multimodal supply chains, using a common foundation for converting
data between modes of transport, sectors and authorities.
Tests to prove the concept are taking place. For example, UN/CEFACT and FIATA experts have
prepared a digital version of the FIATA multimodal Bill of Lading, aligned to the MMT RDM. Another test
has focused on exports of wood and cellulose from Belarus to Central Europe via Ukraine, the Black
Sea and the Danube, combining rail, road, river and maritime transport information exchanges. These
tests demonstrate the benefits of seamless data exchange between different modal consignment notes
and maritime bills of lading. Experts are also currently working on IMO/FAL forms in Ukraine with a view
to using them along multimodal transport routes.
Source: Inputs provided by the ECE Secretariat and ECE (2021) Handbook for National Masterplans for Freight
Transport and Logistics.
Greener industrial port activities
The world is now embarking on the transition to greener energy. This will be costly. Halving shipping
emissions by 2050 is estimated to require an annual average investment of between $40 to $60 billion
between 2030 and 2050. Most of this is for producing alternative fuels such as ammonia, hydrogen, and
methanol among others, while also developing new land-based infrastructure for storage and bunkering
(Krantz et al, 2020).
The energy transition has major implications for ports. Less trade in oil will reduce revenue from storing
and distributing fossil fuels. Preparing for a future without carbon fuels, ports are therefore aiming to
develop new markets and value-added services (The Conversation, 2021 and Manners-Bell, 2021). And
despite the pressures faced in 2020, many have maintained their plans for investing in environmental
sustainability
(IAPH-WPSP, 2021). These include production of alternative energy, infrastructure to
import alternative fuels, and for bunkering and storage to facilitate onward distribution (table 2.12).
Some ports have benefitted from infrastructure green recovery plans and others from incentives for
foreign investment.
Table 2.12
Industrial port projects capitalizing on green opportunities to generate
new revenue streams
Facilitating import of alternative
Alternative energy
Bunkering infrastructure
energy and storage infrastructure
• Project to develop hydrogen-based
• Pilot hydrogen filling stations in the
• Project to develop a terminal in
exports from the Port of Fujairah
port of Antwerp
Germany for import and onward
(United Arab Emirates)
distribution of LNG, encompassing
• Proposed hydrogen infrastructure at
storage and ancillary services
• Project to develop offshore wind energy
Kobe, Chita, Yokkaichi and Hibikinada
(Brunsbüttel Ports, Germany)
to generate hydrogen at North Sea Port
ports (Japan), capitalizing on existing
(Belgium)
hydrogen pipeline
Sources: Argus Media (2021): Japan studies options to cut coastal shipping emissions. ArgusMedia, 2/7/2021. OffshoreWind.
Biz (2021) Equinor, Ørsted, Boskalis Join AquaVentus Offshore Wind-to-Hydrogen Project 4/5/2021. Savvides; Nick (2021).
Antwerp and CMB team up to launch multimodal hydrogen filling station. The Loadstar, 10/6/2021. Liebig; L. (2021). The
United Arab Emirates is well placed to capitalise on the pivot to hydrogen 13/4/2021. Pekic, Sanja (2021). North Sea Port to
get hydrogen pipeline network. Offshore Energy, 3/6/2021.
There is also now greater interest in smarter and greener ports. Beyond transforming ports into
carbon-neutral ecosystems this means using new data environments and artificial intelligence to enhance
competitiveness and sustainability. Some factors affecting the development of such ports are indicated
in table 2.13.
48

2. Maritime transport and infrastructure
Table 2.13
Factors affecting the development of smart green ports
Dimension
Influencing factors
Indicators of success
Greenness
Energy-saving and emission-reducing capability
Port’s capability in saving energy and controlling pollutant
discharges
Pollution treatment capability
Responsiveness and degree in treating pollutants
Efficient utilization of resources
Whether a port has the capability to utilize resources
effectively to reduce resource waste
Environmental protection concept and policy system
Knowledge and practices of port management personnel
and policymakers in green concepts
Agility
Agile production capability
Port’s capability in fully utilizing the limited resources and
responding quickly to orders
Comprehensive logistic capability. Levels of a port’s
Whether a port adopts refined operation modes and has JIT
comprehensive logistic services and supply
capabilities
Personalization
Port-differentiated service levels
Levels of a port’s services that are different from those at
other ports
Personalized service levels for customers
Levels of personalized services provided by the port to
customers
Emergency and quick response capabilities
Port’s response capabilities to multiple emergencies and
adjustability to changes
Cooperation
International port-shipping cooperation
Degree and model of international port-shipping
cooperation
Port-city integration
Port-city cooperation
Cooperation between subsidiary and parent ports
Cooperation between subsidiary and parent ports
(international dry ports, feeder ports and inland port areas)
Intelligence*
Intelligent production infrastructure and operation
Intelligence degree of port infrastructure operation and
production
Intelligent administration
Intelligence degree of port administration
Intelligent facility security
Intelligence degree of port facility security
Innovative R&D and technology application
Port’s technical innovation R&D capability and degree of
application
Liberalization
Liberalization of trade and economic policies
Port’s liberalization degree in domestic and foreign trade
Facilitation of logistics and customs clearance
Port’s coordination with the Customs and quarantine
departments and degree of cargo transportation facilitation
Openness of investment and financing
Openness of a port in market investment and financing
Source: Chen, J.; Huang, Tiancun, Xie, X; Lee, P. and Hua, C. (2019). Constructing the Governance Framework of a Green
and Smart Port. Journal of Marine Science and Engineering.
* Defined as “more modern intelligent technologies integrated into port working environments to improve port operations”.
D. THE IMPACT OF COVID-19 ON PORTS: LESSONS FROM THE UNCTAD
TRAINFORTRADE PORT MANAGEMENT PROGRAMME
The TrainForTrade Port Management Programme brings together a strong network of ports across several
continents, for which the programme has continued to upgrade its Port Performance Scorecard (PPS). Each
April member ports complete a survey on their performance in the previous calendar year. This provides valuable
data for strategic planning within ports and for evidence-based policy analysis at regional and state levels.
The data are collected through 82 questions from which the PPS derives 26 agreed indicators under
the following categories: finance, human resources, gender, vessel operations, cargo operations, and
environment (table 2.14). The same approach has been used each year since the inception of the PPS
in 2012 thus ensuring consistency and comparability over time.
For the current scorecard for the five-year period 2016-2020, 51 port entities provided 3,301 data
points - an average of 98 data points per indicator. Around half of the ports were small, less than five
million tons, or medium, between five million and 10 million tons. The annual volume throughput for the
largest port in the sample was 80.9 million tons and for the smallest was 1.5 million tons. Two-thirds were
landlord ports - owning the basic infrastructure and leasing it out to operators - or used a mixed model.
49
Table 2.14
Port Performance Scorecard indicators, 2016-2020
Category
Indicator number
Indicator
Number of values
Mean
Finance
1
EBITDA / revenue (operating margin)
98
33.1%
2
Labour / revenue
102
22.9%
3
Vessel dues / revenue
101
15.8%
4
Cargo dues / revenue
101
36.7%
5
Concession fees / revenue
91
13.7%
6
Rents / Revenue
96
5.7%
Human resources
7
Tons / employee
108
65 054
8
Revenue / employee
101
$189 180
9
EBITDA / employee
97
$98 029
10
Labour cost / employee
96
$32 985
11
Training cost / wages
96
1.3%
Gender
12
Female participation rate - all categories
108
17.5%
12.1
Female participation rate - management
108
42.0%
12.2
Female participation rate - operations
100
16.0%
12.3
Female participation rate - cargo handling
74
5.7%
12.4
Female participation rate - other employees
46
29.1%
Vessel operations
13
Average waiting time (hours)
92
14
14
Average gross tonnage per vessel
106
18 184
15.1
Average of oil tanker arrivals
114
9.8%
15.2
Average of bulk carrier arrivals
115
10.5%
15.3
Average of container ship arrivals
114
30.7%
15.4
Average of cruise ship arrivals
113
1.1%
15.5
Average of general cargo ship arrivals
116
27.4%
15.6
Average of other ship arrivals
114
22.5%
Cargo operations
16
Average tonnage per arrival (all)
117
8 162 t
17
Tons per working hour, dry or solid bulk
77
317 t
18
Tons per hour, liquid bulk
55
367 t
19
Boxes per ship hour at berth
70
27
20
Twenty-foot equivalent unit dwell time (days)
63
6
21
Tons per hectare (all)
107
141 704 t
22
Tons per berth meter (all)
113
6 482 t
23
Total passengers on ferries
89
959 899
24
Total passengers on cruise ships
92
91 068
Environment
25
Investment in environmental projects / Total CAPEX
54
6.3%
26
Environmental expenditure/revenue
77
1.8%
Source: UNCTAD, based on data provided by selected member ports of the TrainForTrade network.
Abbreviations: CAPEX, capital expenditure; EBITDA, earnings before interest, taxes, depreciation and amortization.
50
2. Maritime transport and infrastructure
1. Impact of COVID-19 pandemic across the TFT port network
In 2020, the COVID-19 pandemic had a significant impact on ports worldwide. As well as creating
health risks for port workers and seafarers in all regions it also substantially reduced the volume of trade.
Between 2016 and 2018 cargoes had been growing at a median value of five per cent per year and
revenues by six per cent. In 2020, however, volumes fell by 4 per cent and revenues by 9 per cent
(figure 2.11). The impacts on individual ports are illustrated in box 2.4, by the experience of the Port of
Gijon in Spain, and in box 2.5, by the port system in Peru.
Figure 2.11
Cargo and revenue, 2016-2020
(percentage change)
8
6
4
2
Cargo
0
-2
Revenue
-4
-6
-8
-10
2016
2017
2018
2019
2020
Source: UNCTAD, based on data provided by selected member ports of the TrainForTrade network.
Box 2.4
Port performance analysis of the Port of Gijon in 2020
Although 2020 was a tough year for ports in general, and for Europeans in particular, for the port of
Gijon it was what we could call the ‘perfect storm’.
On the one hand, COVID-19 hit. On the other hand, the fight for a more sustainable world caused the
closure of the five thermal power plants that the port served; consequently causing a loss of five million
tons of coal. In addition, the shutdown of an Arcelor Mittal blast furnace caused a loss of almost four
million tons.
Other traffic, such as the import, mix and export of coals from Russia to the Maghreb helped offset
the large losses mentioned above. And despite the ‘three storms’, the Port of Gijon has firmly held
the wheel while at the same time helping its clients, allowing them to delay payments for a year and
rewarding companies affected by COVID-19.
Losses meant a 7 per cent drop over the previous year (2019). The total tons handled, amounted to
16 million tons. Traffic was broken down into 80 per cent solid bulks, 12 per cent general merchandise
and 8 per cent made up of liquid bulks.
Iron ore, steel coal and cement made the port the first in solid bulk in the Spanish port system. Other
solid bulks, like cereals and fertilizers, contributed to its leadership.
As for general merchandise, 75 per cent was containerized, with 85,000 TEU moved. This represented
75 per cent of the port’s hinterland and is expected to expand in the coming years following a new
rail connection with the centre of the country. The remaining 25 per cent of the total, 1.5 million ton of
general merchandise, was steel products.
Liquid bulks represented 8 per cent of the mix - petroleum products, gasoline, and gasoil, intended for
final consumption.
Despite the wind and seas from the bow, financial results have been positive and increased by a little
over two million euros. The year 2021 is born full of new projects and hopes that will undoubtedly help
turn the page of these challenging times.
Source: Port Authority of Gijon.
51
Box 2.5
Port performance analysis of the national port system in Peru in 2020
In Peru, in 2020 there was a 10.9 per cent fall in volumes to 97.4 million tons while the number of
containers (in TEU) handled remained stable nationally. However, there was a drop in container traffic
at the larger international terminals of 3 per cent compared to 2019 due to the impact of the COVID-19
health emergency (see table).
The main types of goods, containers, solid bulk, and break-bulk cargo, decreased by 0.3 per cent,
3.7 per cent and 4.9 per cent, respectively, as shown in the table, which illustrates the movement of
cargo at public and private port terminals for 2019/2020.
Change (%)
Type of Merchandise
Unit of measure
Year 2019
Year 2020
2020/2019
TEU
2 678 258
2 654 289
-0.9%
LoLo containers
units
1 618 433
1 592 256
-1.6%
tons
25 905 625
25 832 736
-0.3%
Break Bulk
tons
4 057 174
3 858 419
-4.9%
Bulk Solids
tons
12 165 301
11 714 440
-3.7%
Bulk Solid Minerals
tons
33 122 675
27 978 125
-15.5%
Liquid Bulks
tons
33 756 658
27 883 897
-17.4%
RoRo
tons
333 213
207 063
-37.9%
Total Load
tons
109 340 647
97 474 680
-10.9%
However, these reductions are moderate compared to those for bulk minerals, liquid, and roro cargo,
which decreased by 15.5 per cent, 17.4 per cent, and 37.9 per cent, respectively.
During the year 2020, the National port system handled a total of 2.6 million TEUs, presenting a slight
drop of 0.9 per cent, compared to the year 2019.
Source: National Port Authority of Peru.
Financial performance
Financial performance of ports can be measured as the average gross revenue per ton of cargo. This
ranged from $1.9 per ton in Europe, and $2.26 in Asia, to $5.31 in Africa. At the global level the sources
of revenues are indicated in figure 2.12, showing the split between port dues on vessels and cargo
throughput, port service charges, and income derived from land and concession rights.
Around half of revenues come from vessel and cargo charges for the use of primary port infrastructure.
This proportion is likely to fall over time with the development of digitalized ports and energy hubs, using
either the concession or landlord model.
Profitability is measured as earnings before interest, taxes, depreciation, and amortization (EBITDA).
Businesses with high demands for infrastructure investment require elevated levels of EBITDA to be
sustainable. In 2020 average profitability declined by 12 per cent in Europe, by 17 per cent in Asia and
by 25 per cent in Africa. Latin America showed no
change. These declines can be partly explained
Figure 2.12
Average revenue mix of
by the impacts of COVID-19, though in Africa
ports, 2016-2020
there must be other major factors since volumes
and revenues showed only a minor impact from
the pandemic.
Other
Cargo dues
28%
37%
In performance terms, the reported numbers
show a falloff in 2020. While there have been
profitability drops in other periods this decline can
be partially explained by the COVID-19 pandemic.
Rents
5%
Last year the scorecard covered the
period
2015-2019, for which EBITDA as
Concession fe
dues
14%
16%
a proportion of revenue was
38.8 per cent
(indicator
1). The
2021 scorecard covered the
Source: UNCTAD, based on data provided by selected
member ports of the TrainForTrade network.
period
2016-2020 for which the proportion
52
2. Maritime transport and infrastructure
declined to 33 per cent. The impact was, however, lower in Europe where averages remained at 59 per
cent and in Latin America at 41 per cent.
A high-level comparison of revenue profiles shows the mix between port dues on vessels and cargos, port
service charges and incomes derived from lands and concession rights. Between 2020 and 2021 scorecards,
the proportion of total capital expenditure for environmental purposes fell from 7.2 to 6.4 per cent, while the
proportion of operating costs for environmental purposes fell from 2.3 to 1.8 per cent. In some countries the
environmental data are difficult to extract since they can be embedded in the total capital or operating spends.
Gender equality
Sustainable Development Goal 5.5 calls for full and effective participation of women and equal opportunities
for leadership at all levels of decision making in political, economic, and public life. In this respect, ports
still do not perform well. Between 2020 and 2021 scorecards, the average female proportion of the port
entity workforce fell slightly, from 17.6 to 17.5 per cent. The proportion in Europe is significantly higher at
24.8 per cent, though most of these women work in management or administration.
Overall, the figures are more encouraging for management and administrative roles. Between 2020 and 2021
scorecards, the proportion of women rose from 38 to 42 per cent. Asia led the way at 52 per cent, followed by
Europe at 39 per cent. Female participation is however far lower for cargo handling and port operations. There
is thus still a lot to be done to achieve the SDG target to “Achieve gender equality and empower all women
and girls.” Box 2.6 illustrates how the Philippines Ports Authority is making the changes to meet this objective.
Box 2.6
Gender and development in the Philippine Ports Authority and its journey
The Philippine Ports Authority (PPA), under the present leadership of Atty. Jay Daniel R. Santiago,
General Manager, has continued its commitment to institutionalize gender and development (GAD) in
all the ports under its jurisdiction. For SDG 5: “Gender Equality” PPA now satisfies target 5.5 “Ensure
women’s participation and leadership in decision-making”.
The port industry in the Philippines is undeniably male-dominated. However, in recent years, women
have been making remarkable progress, within the Authority particularly at management levels and
PPA continues to put a premium on women’s empowerment. In its GAD journey there have been many
firsts in entrusting some of highest managerial positions to female officers: first female Assistant General
Manager on Finance and Administration (executive level); first female Port Manager (managerial level in
field offices); and first female Department Manager (managerial level in head office).
As of May 2021, women made up half of PPA’s workforce, amounting to 1,026 female personnel. The
highest women-occupied positions are at the middle management level with two department managers,
five port managers and 56 division managers. Some women employees are also taking male-dominated
positions such as terminal supervisor, safety officer, civil security officer, engineer, terminal operations
officer, or industrial security officer. This shows that the authority values the immense contributions of
women employees in the areas of decision-making, management, operations, and even security.
To further strengthen GAD initiatives the Authority ensures compliance with statutory laws upholding the
welfare and development of Filipino women. For instance, PPA strictly observes the provisions of the
General Appropriations Act and Republic Act 9710, also known as the Magna Carta of Women, which
directs government agencies to formulate a GAD plan, the cost of which shall be not less than 5 per cent
of the annual budget. Annually, PPA appropriates 5 per cent of its corporate budget for implementing
the Authority’s GAD plans and programmes. Among the GAD flagship projects and programmes are the
construction of gender-neutral facilities and halfway houses, along with capacity-building to increase
awareness among employees.
In recent years, PPA has been crafting and implementing gender-responsive policies, plans and
programmes to advocate gender equality and women’s empowerment. This has been given an added
impetus by the UNCTAD TrainForTrade port management programme in the Philippines. Many women
have participated in the three cohorts of the programme and more are expected to join subsequent cycles.
Source: Philippine Ports Authority.
Vessel and cargo operations
PPS data provide interesting insights into the differences between regions. At the global level, for
the 2016-2020 period, compared with the previous five-year average, the average cargo load per vessel
per arrival rose from 7,865 to 8,162 tons, a 3.9 per cent increase (indicator 16). However, these average
loads vary greatly between regions, reflecting different types of operations and distances to market. Asia,
for example, has a high proportion of passenger ferry operations and an average load of only 2,313 tons,
53
while Africa on average has longer journeys made by larger vessels and an average load of 15,681 tons.
Globally, there was little change in average vessel size which rose from 18,124 to 18,184 Gross Tons (GT)
(indicator 14) in the 2016-2020 period compared with the previous five-year average (2015-2019).
One of the most direct impacts of COVID-19 was on the number of passengers. For the 2016-2020 period,
compared with the previous five-year average, passenger numbers fell by 34 per cent (indicator 23). There
was similar fall in the number of cruise passengers, by 28 per cent (indicator 24). Between years 2019
and 2020 only, the number of passengers on ferries fell by 71 per cent and on cruise ships by 76 per cent.
Overall, modern ports show many similarities in their financial and operations data as well as in their
declared policy profiles and corporate structures. Nonetheless, each port entity has its own unique
characteristics. Some may have greater autonomy on pricing while for others this might require national-
level approval. Control over major investments, however, appears to be retained at the political level.
The pandemic has accelerated digitalization and decarbonization and key theme of future data analysis
will be on how performance levels are affected by such changes.
E. SUMMARY AND POLICY CONSIDERATIONS
This chapter has provided recent information in some key areas:
• Fleet size - Between 1 January 2020 and 1 January 2021, the world fleet grew at the historically
low rate of 3 per cent, reaching 99,800 ships of 100 gross tons and above, equivalent to 2.13 billion
dwt of capacity in January 2021. Ships delivered in 2020 were mostly bulk carriers, followed by oil
tankers and container ships. During this period, ship deliveries declined by 12 per cent, partly due
to lockdown-induced labour shortages for marine-industrial activity. The number of ships sold for
recycling increased in 2020, although levels remained low by historical standards.
• Ship orders - During 2020, ship ordering declined by 16 per cent, continuing the downward trend
observed in previous years, though newbuilding orders surged during the first half of 2021. As
owners and operators tried to cope with tight vessel supply, they turned to the second-hand
market, leading to higher second-hand prices. In several shipping segments, the current imbalance
between supply and demand has pushed up freight rates.
• Regulation - Regulatory changes to align shipping operations with decarbonization targets, along
with the energy transition creates an uncertain environment that will affect shipping, trade and
energy use and entail significant costs. The short-term measure agreed recently at the IMO could
affect ship costs, ship travel distance, fleet distribution, routing patterns, and use of different types
of vessels and may increase maritime logistics costs. Slow steaming to reduce fuel consumption
could result in the need to increase the number of ships.
To cater for the high demand for ships, shipping companies will need to expand their fleets and scale
up investment. Meeting the decarbonization target will require retrofitting or replacement. In developing
countries in particular it will be important to assess the implications of regulatory measures. For replacing
older vessels with larger and more fuel-efficient ships and making the corresponding landside investments,
investors will need more predictable regulatory environments, and greater certainty when trialling and
scaling up alternative fuels.
While adding to the pressures, the pandemic has often accelerated necessary changes. Many ports
for example, are embracing new strategies, capitalizing on ecommerce opportunities and preparing for
a future without carbon fuels by embarking on greener industrial port activities - evolving into green
smart ports that can become catalytic hubs for revenue generation and industrial growth. Key to all these
changes is digitalization which is redefining port business success and facilitating intermodal operations.
Both seaports and inland ports will need support to keep up with digitalization, so as to function efficiently
and seize opportunities as they arise.
54
2. Maritime transport and infrastructure
REFERENCES
American Journal of Transportation (2021) Kalmar enters into strategic cooperation with Sichuan Port and
Shipping Investment Group in China. 09 June.
Allianz Global Corporate and Speciality (2019). Loss trends - larger vessels bring bigger losses. Expert
Risk Articles, News and Insights.
Bak M. Newbuild Investment: On The Up Again.., Clarksons Shipping Intelligence Network. 23 July 2021.
Balcombe P, Brierley J, Lewis C, Skatvedt L, Speirs J, Hawkes A and Staffell I (2019). How to decarbonise
international shipping: options for fuels, technologies and policies. Energy Conversion and Management
Journal, 182:72-88.
Boulougouris E (2021). Suez Canal blockage: how cargo ships like Ever Given became so huge, and why
they are causing problems. The Conversation, 01 April.
Chen J, Huang T, Xie X, Lee P and Hua C (2019). Constructing the Governance Framework of a Green
and Smart Port. Journal of Marine Science and Engineering.
Clarksons Research (2021a). Container Intelligence Monthly, Volume 23, No. 6. June.
Clarksons Research (2021b). Shipping Intelligence Weekly Issue No. 1,478, 25 June.
Clarksons Research (2021c). World Shipyard Monitor. Volume 28, No. 1 January.
Clarksons Research (2021). Tracking “Green” Technology Uptake. June 2021.
Clayton R (2019). LNG will be transitional fuel for 2030, Nor-Shipping hears. Lloyds List News, 3 June.
Drewry (2021). Webinar - Container Ports & Terminals, June 2021.
ECE (2021). Handbook for National Masterplans for Freight Transport and Logistics.
Gaztransport Technigaz (GTT). LNG as a marine fuel.
Gilbert P, Walsh C, Traut M, Kesieme U, Pazouki K and Murphy A (2018). Assessment of full life-cycle air
emissions of alternative shipping fuels, Journal of Cleaner Production, Volume 172, 20 January 2018.
Hayden R (2015). Mega-ships accidents pose risks to supply chains, shippers, insurers. JOC, 30 September.
Haralambides H, Tsolakis S, and Cridland C (2005). Econometric Modelling of Newbuildings and
Secondhand Ship Prices.
Hellenic Shipping News (2021). The Suez Canal Accident and the State of Global Shipping, Port News,
19 June.
ING (2021). European power markets ease but prices remain high. 27 July 2021.
Jiang J (2021). IMO 2020 and demolition volumes Splash 24/ 7.
IAPH-WPSP (2021). Port Economic Impact Barometer One Year Report. May 2021.
IMO (2018). Note by the IMO to the UNFCCC Talanoa Dialogue: “Adoption of the initial IMO strategy
on reduction of greenhouse gas emissions from ships and existing IMO activity related to reducing
greenhouse gas emissions in the shipping sector”.
Kachi A, Mooldijk S and Warnecke C (2019). Carbon pricing options for international maritime emissions.
Krantz R, Sogaard Kand Smith T (2020). The scale of investment needed to decarbonize International
Shipping Getting to Zero Coalition, January 2020.
Lockton (2019). Re-evaluating the risk of mega ships. Lockton Insights, UK.
Logmore (2019). Digital Logistics: What Is It, and How Will It Impact Your Organization? 16 April.
Lloyds List (2021). Is LNG really borderline greenwashing? Lloyds’ List Shipping Podcast. 14 May.
Lloyd’s Register (2021). The complexities of the fuel supply chain as we move towards zero-carbon.
20 January.
Manners-Bell J (2021). Ports plan transition to hydrogen superhighway hubs. Transport Intelligence.
17 June.
55
Maritime Executive (2021). Global Orderbook at Seven-Year High After Strong Start to 2021. 6 July 2021.
Market and Research News, 2021. China Shipbuilding Industry Report 2021-2025: Depending on
COVID-19 Impacts in 2021, the Industry May Not Recover Until 2022. 15 February 2021.
Medeiros E, Cliff G, Crane K and Mulvenon, J (2021). A New Direction for China’s Defense Industry,
Chapter: China’s Shipbuilding Industry. Rand Corporation.
Miller G (2021). No letup yet in dry bulk shipping’s ‘remarkable rally’. Freight waves. 28 June.
OECD (2019). Ship recycling: an overview. OECD Directorate for Science, Technology and Innovation.
Organization of Economic Cooperation and Development and International Transport Forum (2018).
Decarbonizing Maritime Transport: Pathways to Zero-carbon shipping by 2035.
Ovcina J (2020). Clarksons: 27 per cent of the order book to run on alternative fuels. Offshore Energy.
1 December.
Ovcina J (2021) Stopford: Industry will need $3.4 trillion in the next 30 years to replace existing fleet.
Offshore Energy.15 April.
Plevrakis G (2020). Decarbonisation: energy market scenarios and the impact on the shipping fleet.
Safety4Sea. 20 May.
Roussanoglou N (2021a). Ship Acquisitions in the Dry Bulk Market Are Booming. Dry Bulk Market News
in Hellenic Shipping News. 15 June.
Roussanoglou, N (2021b). Ship Owners Order more Container Ships and LNG Carriers. Hellenic Shipping
News Worldwide.29 July 2021.
Sancricca M (2016). Second hand ships vs. new buildings: a financial perspective. 20 November.
Sanchez R (2021). Looking into the future ten years later: big full containerships and their arrival to South
American ports. Journal of Shipping and Trade 6, 2.
Sanchez R, Sanchez S and Barleta E (2020). Towards the decarbonization of international maritime
transport: findings from a methodology developed by ECLAC on shipping carbon dioxide emissions
in Latin America. UNCTAD Transport and Trade Facilitation Newsletter N°86 - Second Quarter 2020,
Article No. 56. 17 July.
Schwerdtfeger M (2021). Intermodal traffic will shape the future of US container ports. Port Technology.
21 April.
Shell; Deloitte. Decarbonising Shipping: All Hands-on Deck; Shell: The Hague, The Netherlands, 2020.
ShipInsight (2021). Container ship ordering continues record upward trend. 22 July 2021.
Springer A (2021). Newbuild Prices: On The Up In 2021 So Far. Clarksons Shipping Intelligence Network.
23 June.
Statista (2021). Retail e-commerce sales worldwide from 2014 to 2024.
The Conversation (2020). How shipping ports are being reinvented for the green energy transition. 20 June.
The Maritime Executive (2021). Ordering Surges at Asia's Biggest Shipbuilding Yards. 30 May.
UNCTAD (2021a). Container shipping in times of COVID-19: why freight rates have surged, and implications
for policymakers.
UNCTAD (2021b). Assessment of the impact of the IMO Short-Term greenhouse gas reduction Measure
on States: Assessment of impacts on maritime logistics cost, trade and GDP.
van Marle G (2021). DP World snaps up contract logistics operator Syncreon for $1.2bn. The Loadstar.
1 July.
Walia I (2021). Dry bulk higher earnings are ‘a predawn’, says Lindström. Lloyds’ List News. 29 June.
World Bank (2021). The role of LNG in the transition toward low-and zero carbon shipping.
Zhang J (2021). Alibaba logistics arm Cainiao partners with Hainan to bring smart logistics to duty-free
island province. South China Morning Post. 10 June.
56