UNCTAD REVIEW OF MARITIME TRANSPORT (2021) - page 1
TABLE OF CONTENTS
Acknowledgements
iii
Abbreviations
ix
Note
xii
Overview
xiv
1.
International maritime trade and port traffic
1
A.
Volumes of international maritime trade and port traffic
3
B.
Outlook and longer-term trends
19
C.
Policy considerations and action areas
23
2.
Maritime transport and infrastructure
29
A.
The world fleet
31
B.
Shipping companies and operations: adapting maritime transport supply
in an uncertain environment
42
C.
Port services and infrastructure supply
46
D.
The Impact of COVID-19 on ports: lessons from the UNCTAD TrainForTrade Port
Management Programme
49
E.
Summary and policy considerations
54
3.
Freight rates, maritime transport costs and their impact on prices
57
A.
Record-breaking container freight rates
59
B.
Dry bulk freight rates also reach highs
64
C.
Tanker freight rates dip to the lowest levels ever
65
D.
Economic impact of high container freight rates, particularly in smaller countries
66
E.
Structural determinants of maritime transport costs
70
F.
Summary and policy considerations
74
Technical Notes
78
4.
Key performance indicators for ports and the shipping fleet
87
A.
Port calls and turnaround times
89
B.
Liner shipping connectivity
93
C.
Port cargo handling performance
99
E.
Greenhouse gas emissions by the world fleet
105
F.
Summary and policy considerations
106
5.
The COVID-19 seafarer crisis
109
A.
Seafarers crisis - recent developments
111
B.
Seafarer crisis - implementation of the ILO Maritime Labour Convention, 2006,
as amended (MLC 2006)
115
C.
Crew changes and key worker status - other relevant international legal instruments
117
D.
The way forward
119
6.
Legal and regulatory developments and the facilitation
of maritime trade
125
A.
Technological developments in the maritime industry
127
B.
Regulatory developments relating to international shipping, climate change
and other environmental issues
128
C.
Legal and regulatory implications of the COVID-19 pandemic
133
D.
Other legal and regulatory developments affecting transportation
133
E.
Maritime transport within the WTO Trade Facilitation Agreement
135
F.
FAL Convention
139
G.
ASYCUDA ASYHUB case studies
141
H.
Summary and policy considerations
142
iv
Tables
1
World fleet by principal vessel type, 2020-2021
xvi
2
Five largest seafarer-supplying countries 2021 supplying countries 2021
xx
1.1
International maritime trade, 1970-2020
3
1.2
International maritime trade 2019-2020, by type of cargo, country group and region
4
1.3
World economic growth, 2019-2021
6
1.4
Growth in the volume of world merchandise trade, 2019-2021
7
1.5
Tanker trade, 2019-2020
11
1.6
Dry bulk trade 2019-2020
12
1.7
Major dry bulk and steel: producers, users, exporters, and importers, 2020
13
1.8
Containerized trade on East-West trade routes, 2016-2020
15
1.9
Containerized trade on major East-West trade routes, 2014-2021
15
1.10
World container port throughput by region, 2019-2020
17
1.11
International maritime trade developments forecasts, 2021-2026
19
2.1
World fleet by principal vessel type, 2020-2021
31
2.2
Age distribution of world merchant fleet by vessel type, 2021
and average age 2020-2021
32
2.3
Top 25 ship-owning economies, as of 1 January 2021
35
2.4
Ownership of the world fleet, ranked by carrying capacity in dead-weight tons, 2021
36
2.5
Leading flags of registration by dead-weight tonnage, 2021
38
2.6
Leading flags of registration, ranked by value of total tonnage, 2021 (million US dollars)
and principal vessel types
39
2.7
Deliveries of newbuildings by major vessel types and countries of construction, 2020
39
2.8
Reported tonnage sold for ship recycling by major vessel type
and country of ship recycling, 2020
41
2.9
Status of uptake of selected technologies in global shipping, as of 14 June 2021
42
2.10
Some proposed IMO measures to reduce greenhouse gas emissions
43
2.11
World fleet by fuel type as of 1 January 2021
45
2.12
Industrial port projects capitalizing on green opportunities to generate
new revenue streams
48
2.13
Factors affecting the development of smart green ports
49
2.14
Port Performance Scorecard indicators, 2016-2020
50
3.1
Contract freight rates, inter-regional, 2018-2020, $ per 40-foot container
62
4.1
Time in port, age, and vessel sizes, by vessel type, 2020, world total
90
4.2
Port calls and median time spent in port, container ships, 2020, top 25 countries
91
4.3
Top 25 ports under the World Bank IHS Markit Container Port Performance Index 2020
99
4.4
Minutes per container move, by range of call size, top 25 countries by port calls
101
4.5
Cargo and vessel handling performance for dry bulk carriers. Top 30 economies
by vessel arrivals, average values for 2018 to first half of 2021
103
4.6
Cargo and vessel handling performance for tankers. Top 30 countries
by vessel arrivals, average values for 2018 to first half of 2021
104
5.1
Neptune Declaration Crew Change Indicator, July 2021
113
5.2
Five largest seafarer-supply countries, 2021
115
6.1
Key performance indicators of the Kenya Trade Information Portal
138
v
Figures
1
International maritime trade, world gross domestic product (GDP)
and maritime trade-to-GDP ratio, 2006 to 2021
xii
2
Simulated impact of current container freight rate surge on import
and consumer price levels
xv
3
Median time in port, number of port calls, and maximum vessel sizes,
by country, container ships, 2020
xvii
1.1
International maritime trade, world gross domestic product (GDP)
and maritime trade-to-GDP ratio, 2006 to 2021
5
1.2
Participation of developing countries in international maritime trade, selected years
5
1.3
International maritime trade, by region, 2020
5
1.4
International maritime trade by cargo type, selected years
8
1.5
International maritime trade in cargo ton-miles, 2001-2021
9
1.6
World capesize dry bulk trade by exporting region in tons and ton-miles, 2019-2020
10
1.7
World ultra-large tanker trade by exporting region in ton and ton-miles , 2018-2020
10
1.8
Global containerized trade, 1996-2021
14
1.9
Global containerized trade by route, 2020
14
1.10
World container port throughput by region, 2019-2020
18
1.11
Leading 20 global container ports, 2019-2020
18
2.1
Annual growth rate of world fleet, dead-weight tonnage, 2000-2020
31
2.2
Age distribution of the global fleet, share of the global carrying capacity, 2012-2021
33
2.3
Age distribution of the fleet, as at beginning of 2021, per development status groups
33
2.4
Share of mega-vessels in the global container ship fleet carrying capacity
by TEU, 2011-2021
34
2.5
Number of mega-containerships
34
2.6
Mega-vessel distinct journeys through the Panama and Suez canals,
daily averages, from 2012 until 4 June 2021
34
2.7
Live and on-order global fleet by ship type
37
2.8
Growth of world fleet orderbook, 2012-2021, percentage change
in dead-weight tonnage
40
2.9
World tonnage on order, selected ship types, 2000-2021
41
2.10
Percentage change in cost intensity by ship segment, average size
and median distance travelled
44
2.11
Cargo and revenue, 2016-2020
51
2.12
Average revenue mix of ports, 2016-2020
52
3.1
Growth of demand and supply in container shipping, 2007-2021, percentage
59
3.2
CCFI composite index, 2011-2021 (quarterly)
60
3.3
Shanghai Containerized Freight Index weekly spot rates, 1 July 2011 to 30 July 2021,
selected routes
60
3.4
New ConTex index, July 2011-July 2021
63
3.5
Baltic Exchange Dry Index, January 2010-July 2021
65
3.6
Average weighted earnings all bulkers ($/day), July 2001-July 2021
65
3.7
Average earnings, all tankers, July 2011-July 2021
66
3.8
Simulated impact of current container freight rate surge on import
and consumer price levels
67
vi
3.9
Simulated impacts of the container freight rate surge on consumer price levels,
by country and by product
68
3.10
Simulated impacts of container freight rate surges on prices for importers,
consumers and firms, global average
69
3.11
Simulated impact of container freight rate surges on production costs,
by country and size of economy
69
3.12
Simulated dynamic impacts of container freight rate increase on industrial production
70
3.13
Transport costs for importing goods by transport mode, world, LDCs,
and LLDCs, 2016, percentage of FOB value
71
3.14
Transport costs heatmap for importing goods, all modes of transport, 2016,
percentage of FOB value
71
3.15
Maritime transport costs for importing goods and distances from trading partners
72
3.16
Maritime transport costs for importing goods, by country and size of economy
73
3.17
Impact of structural determinants on maritime transport costs for importing goods
73
3.18
Maritime transport costs by direction of the trade imbalance
74
3.19
Impacts of trade imbalance and trade volume on maritime transport costs
74
4.1
Port calls per half year, world total, 2018-2020
89
4.2
Port calls per half year, regional totals, 2018-2020
89
4.3
Container ship port calls and time in port, 2020
90
4.4
Container ship port calls and maximum ship sizes, 2020
91
4.5
Container ship port calls in Africa and time in port, 2020
92
4.6
Container ship port calls in Africa and maximum ship sizes, 2020
92
4.7
Median time in port, number of port calls, and maximum vessel sizes, per country,
container ships, 2020
92
4.8
Liner shipping connectivity index, top 10 countries, first quarter 2006
to second quarter 2021
93
4.9
Port Liner Shipping Connectivity Index, top 10 ports as of second quarter 2021,
first quarter 2006 to second quarter 2021
94
4.10
Liner Shipping Connectivity Index, country and port level, 2020
95
4.11
Trends in global container ship deployment, first quarter 2006 to second quarter 2021
96
4.12
Trends in vessel sizes and number of companies providing services,
selected countries, first quarter 2006 to second quarter 2021
97
4.13
Relationship between maximum vessel sizes, deployed capacity, and the number
of companies, second quarter 2021
98
4.14
Liner Shipping Bilateral Connectivity Index (LSBCI) and its components,
first quarter 2006 to second quarter 2021
99
4.15
Minutes per container move for container ships, by range of port call size
100
4.16
Time in port (hours) for container ships, by range of port call size
100
4.17
Correlation between time in port (hours) and minutes per container move, all call sizes
101
4.18
Correlation between time in port (hours) and minutes per container move,
only calls with 1001 to 1500 containers per call
101
4.19
Carbon dioxide emissions by vessel type, monthly, million tons, 2011-2021
105
4.20
Carbon dioxide emissions by flag state, annual, 2011-2020, million tons
106
vii
Boxes
1
Implications of AfCFTA for maritime transport in Africa
20
2.1
Divided views on whether oil should be replaced by LNG
46
2.2
Building port resilience UNCTAD experience
46
2.3
Guidance and standards for intermodal operations
47
2.4
Port performance analysis of the Port of Gijon in 2020
51
2.5
Port performance analysis of the national port system in Peru in 2020
52
2.6
Gender and development in the Philippine Ports Authority and its journey
53
3.1
Impact of COVID-19 on maritime freight rates in the Arab region
61
4.1
Port performance in Latin America and the Caribbean - differences between
types of terminals
102
5.1
The case of the Philippines
114
6.1
The Framework Agreement on Facilitation of Cross-Border Paperless Trade in Asia
and the Pacific - Maritime implications
138
6.2
IMO Compendium on Facilitation and Electronic Business
139
6.3
Components of the Digitizing Global Maritime Trade project
141
6.4
Customs formalities concerning entry or exit
142
viii
ABBREVIATIONS
AfCFTA
African Continental Free Trade Area
AGTC
European Agreement on Important International Combined Transport Lines
APEC
Asia-Pacific Economic Cooperation
ASYCUDA
Automated System for Customs Data
ASYHUB
ASYCUDA data integration system
B2B
business to business
B2G
business to government
BIMCO
Baltic and International Maritime Council
CAPEX
capital expenditure
CCFI
China Containerized Freight Index
CIF
cost, insurance and freight
CII
Carbon Intensity Indicator
CO2
carbon dioxide
CPPI
Container Port Performance Index
DGMT
Digitizing Global Maritime Trade
dwt
deadweight tonnage
EBITDA
earnings before interest, taxes, depreciation and amortization
ECA
Economic Commission for Africa
ECE
United Nations Economic Commission for Europe
ECLAC
United Nations Economic Commission for Latin America and the Caribbean
EEDI
Energy Efficiency Design Index
EEXI
Energy Efficiency Existing Ship Index
ESCAP
United Nations Economic Commission for Asia and the Pacific
ESCWA
United Nations Economic and Social Commission for Western Asia
eSW
electronic single window
eTIR
electronic International Road Transport system
EU
European Union
FAL Convention
Convention Facilitation of International Maritime Traffic
FIATA
International Federation of Freight Forwarders Associations
FOB
free on board
ix
G2B
government to business
GAD
gender and development
GDP
Gross domestic product
GT
Gigaton
GTCDIT
Global Transport Costs Dataset for International Trade
GVC
global value chain
HFO
heavy fuel oil
ICAO
International Civil Aviation Organization
ICS
Institute Of Chartered Shipbrokers
IFO
intermediate fuel oil
ILO
International Labour Organization
IMF
International Monetary Fund
IMO
International Maritime Organisation
IOM
International Organization for Migration
IOPC FUNDS
International Oil Pollution Compensation Funds
IRU
International Road Transport Union
ISM
International Safety Management
ISO
International Standards Organization
ISPS
International Ship and Port Facility Security
ITF
International Transport Workers' Federation
ITS
intelligent transport systems
kw
kilowatt
LDC
least developed country
LLDC
landlocked developing country
LNG
liquified natural gas
LPG
liquified petroleum gas
MARPOL
International Convention for the Prevention of Pollution from Ships
Convention
MASS
maritime autonomous surface ship
MDH
Maritime Declaration of Health
MDO
marine diesel oil
MEPC
IMO Marine Environment Protection Committee
MGO
marine gasoil
x
MLC
Maritime Labour Convention
MMT-RDM
Multi-Modal Transport Reference Data Model
MNSW
maritime national single window
MSC
IMO Maritime Safety Committee
MSW
maritime single window
NTFC
National Trade Facilitation Committee
OECD
Organisation for Economic Co-operation and Development
OPEC
Organization of the Petroleum Exporting Countries
PCS
port community system
PHEIC
public health emergency of international concern
PIANC
World Association for Waterborne Transport Infrastructure
PPA
Philippine Ports Authority
PPPs
public-private partnerships
PPS
Port Performance Scorecard
R&D
research and development
SCFI
Shanghai Containerized Freight Index
SID
Seafarers’ Identity Document
SIDS
small island developing states
STCW
Standards of Training, Certification and Watchkeeping for Seafarers
TEU
twenty-foot-equivalent unit
TIP
Trade Information Portal
UN/CEFACT
The United Nations Centre for Trade Facilitation and Electronic Business
UNCITRAL
United Nations Commission on International Trade Law
UNCTAD
United Nations Conference on Trade and Development
UNDESA
UN Department of Economic and Social Affairs
UNFCCC
United Nations Framework Convention on Climate Change
United Nations Office of the High Representative for the Least Developed
UNOHRLLS
Countries, Landlocked Developing Countries and Small Island
Developing States
VLSFO
very low sulphur fuel oil
WCO
World Customs Organization
WHO
World Health Organization
WIOD
World Input-Output Database
WTO
World Trade Organization
xi
NOTE
The Review of Maritime Transport is a recurrent publication prepared by the UNCTAD secretariat
since 1968 with the aim of fostering the transparency of maritime markets and analysing relevant
developments. Any factual or editorial corrections that may prove necessary, based on comments made
by Governments, will be reflected in a corrigendum to be issued subsequently.
This edition of the Review covers data and events from January 2020 until June 2021. Where possible,
every effort has been made to reflect more recent developments.
All references to dollars ($) are to United States dollars, unless otherwise stated.
“Ton” means metric ton (1,000 kg) and “mile” means nautical mile, unless otherwise stated.
Because of rounding, details and percentages presented in tables do not necessarily add up to the
totals.
Two dots (..) in a statistical table indicate that data are not available or are not reported separately.
All websites were accessed in September 2021.
The terms “countries” and “economies” refer to countries, territories or areas.
Since 2014, the Review of Maritime Transport does not include printed statistical annexes. UNCTAD
maritime statistics are accessible via the following links:
All datasets: http://stats.unctad.org/maritime
Merchant fleet by flag of registration: http://stats.unctad.org/fleet
Share of the world merchant fleet value by flag of registration: http://stats.unctad.org/vesselvalue_
registration
Merchant fleet by country of ownership: http://stats.unctad.org/fleetownership
Share of the world merchant fleet value by country of beneficial ownership: http://stats.unctad.org/
vesselvalue_ownership
Ship recycling by country: http://stats.unctad.org/shiprecycling
Shipbuilding by country in which built: http://stats.unctad.org/shipbuilding
Seafarer supply: http://stats.unctad.org/seafarersupply
Liner shipping connectivity index: http://stats.unctad.org/lsci
Liner shipping bilateral connectivity index: http://stats.unctad.org/lsbci
Container port throughput: http://stats.unctad.org/teu
Port liner shipping connectivity index: http://stats.unctad.org/plsci
Port call performance (Time spent in ports, vessel age and size), annual: http://stats.unctad.org/
portcalls_detail_a
Port call performance (Time spent in ports, vessel age & size), semi-annual: http://stats.unctad.org/
portcalls_detail_sa
Number of port calls, annual: http://stats.unctad.org/portcalls_number_a
Number of port calls, semi-annual: http://stats.unctad.org/portcalls_number_sa
Seaborne trade: http://stats.unctad.org/seabornetrade
National maritime country profiles: http://unctadstat.unctad.org/CountryProfile/en-GB/index.html
xii
Vessel groupings used in the Review of Maritime Transport
Group
Constituent ship types
Oil tankers
Oil tankers
Bulk carriers
Bulk carriers, combination carriers
General cargo ships
Multi-purpose and project vessels, roll-on roll-off cargo ships,
general cargo ships
Container ships
Fully cellular container ships
Other ships
Liquefied petroleum gas carriers, liquefied natural gas carriers,
parcel (chemical) tankers, specialized tankers, refrigerated container
ships, offshore supply vessels, tugboats, dredgers, cruise, ferries,
other non-cargo ships
Total all ships
Includes all the above-mentioned vessel types
Approximate vessel-size groups according to commonly used shipping terminology
Crude oil tankers
Ultralarge crude carrier
320,000 dead-weight tons (dwt) and above
Very large crude carrier
200,000-319,999 dwt
Suezmax crude tanker
125,000-199,999 dwt
Aframax/longe-range 2
crude tanker
85,000-124,999 dwt
Panamax/long-range 1
crude tanker
55,000-84,999 dwt
Medium-range tankers
40,000-54,999 dwt
Short-range/Handy
tankers
25,000-39,000 dwt
Dry bulk and ore carriers
Capesize bulk carrier
100,000 dwt and above
Panamax bulk carrier
65,000-99,999 dwt
Handymax bulk carrier
40,000-64,999 dwt
Handysize bulk carrier
10,000-39,999 dwt
Container ships
Neo-Panamax
Container ships that can transit the expanded locks of the Panama
Canal with up to a maximum 49 m beam and 366 m length overall;
fleets with a capacity of 12,000-14,999 20-foot equivalent units (TEUs)
include some ships that are too large to transit the expanded locks of
the Panama Canal based on current dimension restrictions.
Panamax
Container ships above 3,000 TEUs with a beam below 33.2 m, i.e., the
largest size vessels that can transit the old locks of the Panama Canal.
Post Panamax
Fleets with a capacity greater than 15,000 TEUs include some ships
that are able to transit the expanded locks.
Source: Clarksons Research.
Note: Unless otherwise indicated, the ships mentioned in the Review of Maritime Transport include all propelled seagoing
merchant vessels of 100 gross tons and above, excluding inland waterway vessels, fishing vessels, military vessels, yachts,
and fixed and mobile offshore platforms and barges (with the exception of floating production storage, offloading units and
drillships).
xiii
OVERVIEW
Maritime transport defied the COVID-19 disruption. In 2020, volumes fell less
dramatically than expected and by the end of the year had rebounded, laying
the foundations for a transformation in global supply chains and new maritime
trade patterns
The COVID-19 pandemic disrupted maritime transport, though the outcome was less damaging than
initially feared. The shock in the first half of 2020 caused maritime trade to contract by 3.8 per cent in the
year 2020. But in the second half of the year there was a nascent, if asymmetric, recovery, and by the third
quarter, volumes had returned, for both containerized trade and dry bulk commodities. However, there
has yet to be a full recovery for tanker shipping.
Maritime trade has performed better than expected partly because the COVID-19 pandemic unfolded in
phases and at different speeds, with diverging paths across regions and markets. The rebound in trade
flows was also the result of large stimulus packages, and increased consumer spending on goods, with
a growth in e-commerce, especially in the United States. Later, there was more general optimism in
advanced regions from the rollout of vaccines. But it was also partly due to unlocking pent-up demand for
cars, for example, and to restocking and inventory-building. The rebound was fairly swift because, unlike
the global financial crisis of 2009, the downturn was not synchronized across the world.
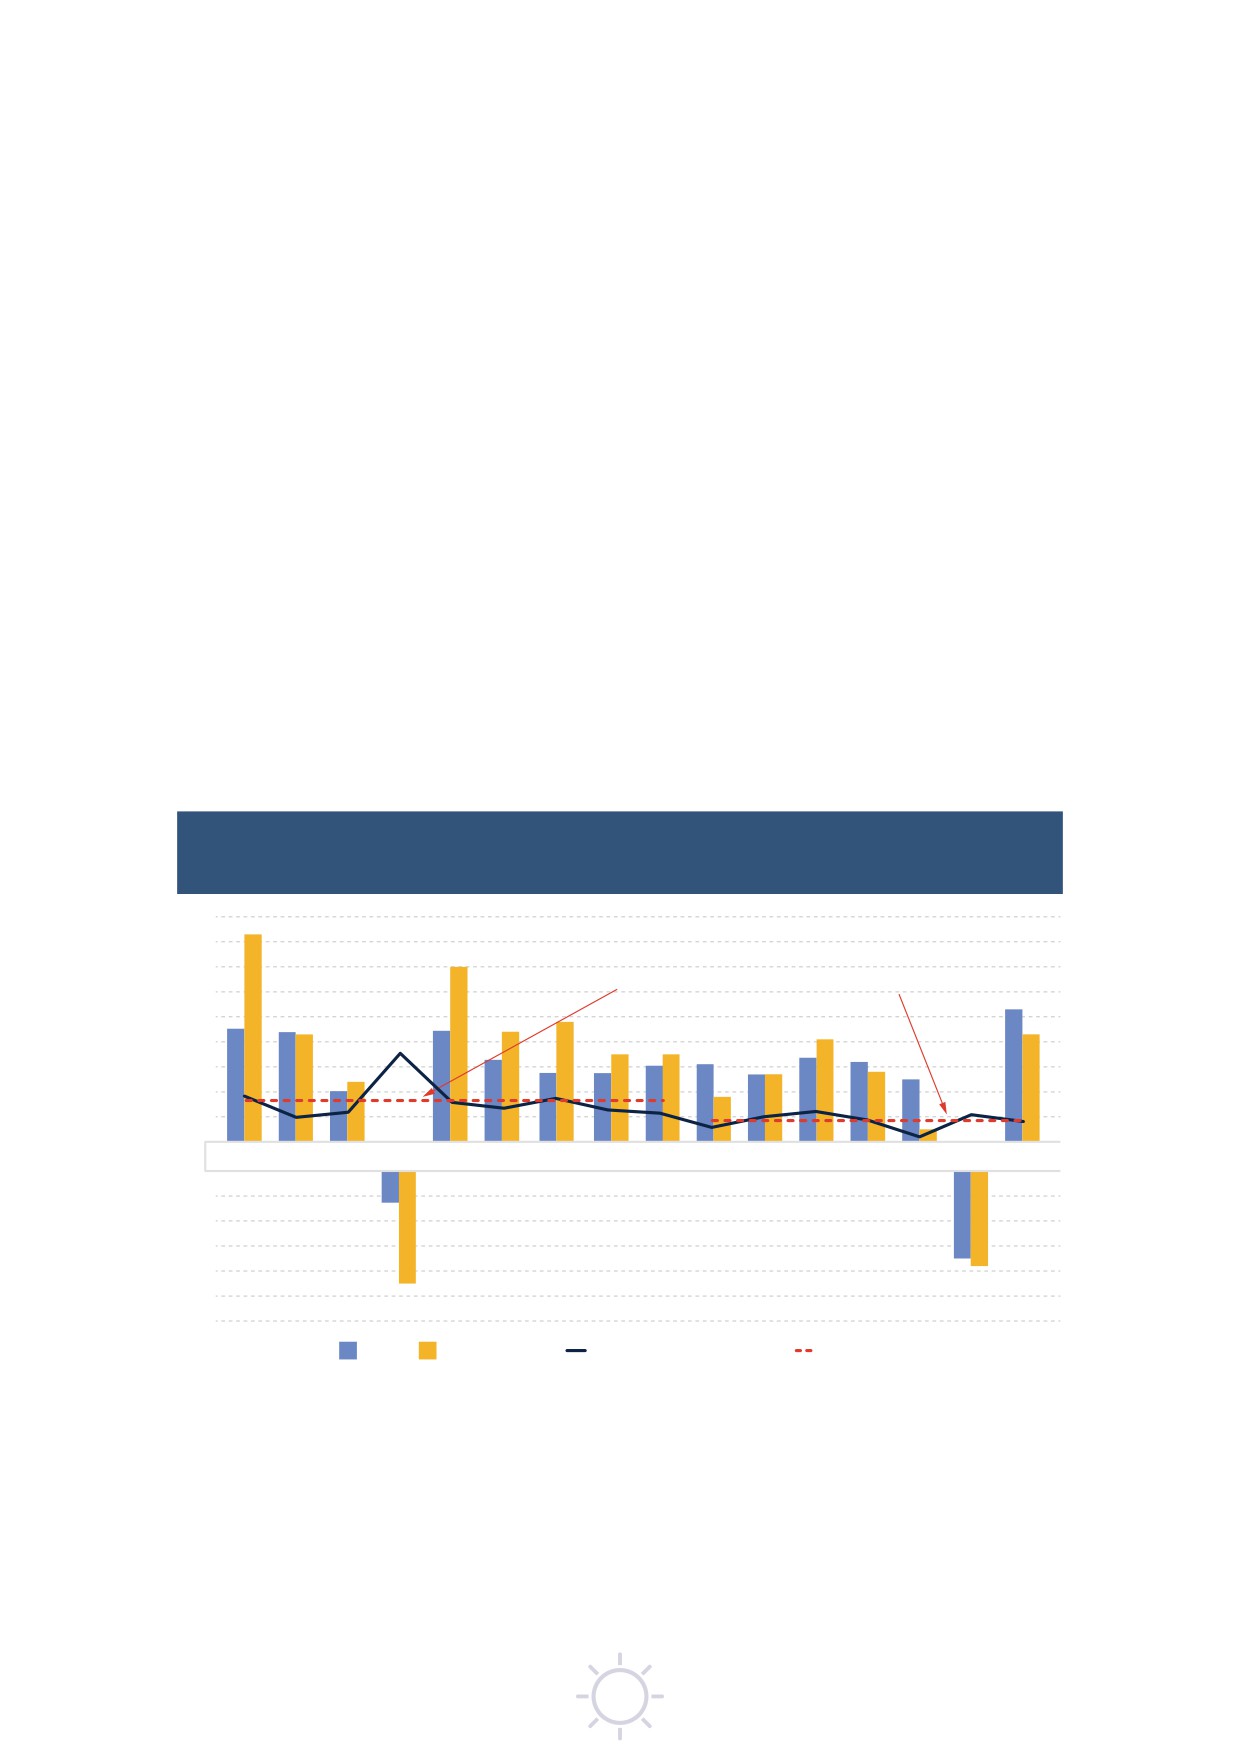
In 2021, in tandem with the recovery in merchandise trade and world output, maritime trade is projected
to increase by 4.3 per cent (figure 1).The medium-term outlook also remains positive, though subject to
mounting risks and uncertainties, and moderated in line with projected lower growth in the world economy.
Over the past two decades, compound annual growth in maritime trade has been 2.9 per cent, but over
the period 2022-2026, UNCTAD expects that rate to slow to 2.4 per cent.
Figure 1
International maritime trade, world gross domestic product (GDP)
and maritime trade-to-GDP ratio, 2006 to 2021
(percentage annual change and ratio)
9
8
7
Average ratio 2006-2014
Average ratio 2015-2021
6
5
4
3
2
1
0
2006
2007
2008
2009
2010
2011
2012
2013
2014
2015
2016
2017
2018
2019
2020
2021
-1
-2
-3
-4
-5
-6
GDP
Maritime trade
Maritime trade-to-GDP ratio
Average ratio
Source: UNCTAD calculations, based on the Review of Maritime Transport, various issues, data from UNCTADstat and
table 1.1 of the UNCTAD Trade and Development Report 2021. From recovery to resilience: The development dimension.
Maritime transport navigated through the pandemic, but there was an
unprecedented humanitarian crisis for seafarers
While carriers generally managed to mitigate the shock and disruption, port and landside operations
found it more difficult to adjust, and seafarers were in a precarious situation as the pandemic triggered
an unprecedented global crew-change crisis. The health risks and related travel restrictions meant that
hundreds of thousands of seafarers could not return home, while an equivalent number were unable to
join their ships and to provide for their families.
xiv
Hardest hit has been tanker shipping, but the impact has been less for
containerized trade, gas shipments, and dry bulk commodities
Lockdowns, travel restrictions and production cuts have compressed the demand for fuel. In 2020,
shipments of crude oil, refined petroleum products, and gas together fell by 7.7 per cent. The impact
was less, however, for dry bulk commodity trade: supported by strong demand from China for iron ore
and grain, total dry bulk trade fell by only 1.5 per cent. Containerized trade also resisted, falling by only
1.1 per cent. Global container port throughput fell at a roughly similar rate - and in 2020 totalled 815.6
million twenty-foot equivalent units (TEU).
Logistical bottlenecks, and soaring costs, along with an asymmetric
recovery, have heightened uncertainty
Maritime trade weathered the storm in 2020 and the short-term outlook remains positive. However, the
emerging multi-paced recovery is inherently fragile as many countries and regions continue to lag. In
addition to new pandemic risks and the dangers of a two-track vaccination pattern where developing
countries continue to fall behind, other risks are casting a shadow on the recovery. While not all countries
have been able to deploy large stimuli packages and support measures, an untimely ending of the existing
support measures in advanced economies could potentially stifle growth and hinder the nascent recovery.
The pandemic’s impacts and legacies are likely to linger and the future shape and contours of the next
normal for the world economy remain uncertain.
The nascent recovery has also been hindered by supply-chain bottlenecks. The rebound in trade,
combined with pandemic-induced restrictions in logistics operations has led to shortages in equipment
and containers, along with less reliable services, congested ports and longer delays and dwell times.
For shipping, on the other hand, soaring freight rates, surcharges and fees have bolstered profitability.
Freight rates increased further following the March 2021 closure of the Suez Canal. The grounding of
the 20,150-TEU container ship Ever Given blocked the canal, delaying ships heading for Europe, and
increasing the constraints on ship and port capacity. Some voyages had to be re-routed around the Cape,
adding up to 7,000 miles to the distance.
Whether the recovery lasts will depend critically on the path of the pandemic. Fresh waves of infection,
combined with low vaccination rates, especially in developing countries, have led to new lockdowns
and border closures. A broad-based recovery hinges to a large extent on a worldwide vaccine rollout.
The International Monetary Fund estimates that $50 billion are required to end the pandemic and roll out
vaccines across developing countries. This would bring not just health but also economic benefits since
it would be tantamount to a large scale economic stimulus package that could accelerate economic
recovery and by 2025 generate some $9 trillion in additional global output.
Seafarers are increasingly being recognized as “key workers” who are keeping shipping and trade moving,
while also being at the front line of the health crisis. Since seafarers come predominantly from developing
regions, industry and government should move quickly to implement vaccine procurement and distribution
plans.
The longer-term outlook is being reshaped by structural megatrends
that transcend the pandemic and its immediate impact
Eventually, the logistical hurdles caused by large swings in demand could dissipate as global trade
patterns normalize. However, the pandemic has also accelerated megatrends that in the longer-term
could transform the maritime transport landscape.
By exposing the vulnerabilities of existing supply chains, the COVID-19 disruption has sharpened the need
to build resilience. COVID-19 emphasized the importance of ensuring continuity in supply chains and the
need for them to become more resilient, responsive, and agile.
Discussions over the future of globalization have ushered calls to take a fresher look at the configuration of
the extended supply chains to reduce heavy reliance on distant suppliers. Some are arguing that reshoring
and nearshoring will accelerate, resulting in deep reconfiguration of supply chains. While the structural
trends that had emerged over a decade ago and accelerated during recent trade tensions are likely to
result in changes to globalization patterns and features, an outright end to globalization per se is unlikely.
It may be fairly straightforward to reshore labour-intensive and low-value production, but it is more complex
to move production and switch suppliers for mid-and high-value-added manufacturing. Instead, enterprises
are likely to blend local and global sourcing, modifying their strategies according to product and geography
xv
- with a blend of reshoring, diversification, replication, and regionalization. Nevertheless, for the near future
China is likely to remain a leading manufacturing site. Automation could make reshoring and nearshoring
more economically viable in the longer term. Hybrid operating models involving just-in-time (i.e., material
moved just before its use in the manufacturing process) and just-in-case (i.e., where companies keep
large inventories to minimize stocks being sold out) supply chain models are likely to emerge. Combined,
these trends will change distances and routes, increasing the need for more flexible shipping services.
They also entail implications for vessel types and sizes, ports of call, and distance travelled.
The pandemic has accelerated pre-existing digitalisation and environmental sustainability trends.
Technological advances have enabled shipping and ports to continue operations while minimizing
interaction and physical contact. New technologies have also stimulated the rise of online commerce
which has transformed consumer shopping habits and spending patterns. The growth in online trade
has increased the demand for distribution facilities and warehousing that are digitally enabled and offer
value-added services. All these developments are expected to generate new business opportunities for
shipping and ports as well as for other players in the maritime supply chain.
Technology will also be critical for advancing environmental sustainability. While designing their stimulus
packages and post-pandemic plans, many governments aim to harness the synergies between technology,
environmental protection, efficiency, and resilience. Businesses and governments recognize that adapting
to the post-pandemic world and building back better requires adding economic, social and environmental
value and creating new business opportunities, not least for maritime transport.
Supply not keeping pace with demand
In
2020, the global commercial shipping fleet grew by
3 per cent, reaching
99,800 ships
of
100 gross tons and above. By January
2021, capacity was equivalent to
2,13 billion
dead weight tons
(dwt)
(table
1). During
2020, delivery of ships declined by
12 per cent,
partly due to lockdown-induced labour
shortages that disrupted marine-industrial activity.
The ships delivered were mostly bulk carriers, followed by oil tankers and container ships. As owners and
operators tried to cope with tight vessel supply, they were also buying more second-hand ships with a
resulting increase in prices. Recycling rates also increased in 2020, although compared to previous years,
the levels remain low.
During 2020, orders for new ships had declined by 16 per cent, continuing a downward trend observed in
previous years. In early 2021, however, shipping companies reacted to the capacity constraints with a surge
of new orders, especially for container ships for which orders were the highest for the last two decades.
There were also more orders for LNG carriers.
Table 1
World fleet by principal vessel type, 2020-2021
(thousand dead-weight tons and percentage)
Principal types
2020
2021
Percentage change
2021 over 2020
Bulk carriers
879 725
913 032
42.47%
42.77%
3.79%
Oil tankers
601 342
619 148
29.03%
29.00%
2.96%
Container ships
274 973
281 784
13.27%
13.20%
2.48%
Other types of ships:
238 705
243 922
11.52%
11.43%
2.19%
Offshore supply
84 049
84 094
4.06%
3.94%
0.05%
Gas carriers
73 685
77 455
3.56%
3.63%
5.12%
Chemical tankers
47 480
48 858
2.29%
2.29%
2.90%
Other/not available
25 500
25 407
1.23%
1.19%
-0.36%
Ferries and passenger ships
7 992
8 109
0.39%
0.38%
1.46%
General cargo ships
76 893
76 754
3.71%
3.60%
-0.18%
World total
2 071 638
2 134 640
3.04%
Source: UNCTAD calculations, based on data from Clarksons Research.
Note: Propelled seagoing merchant vessels of 100 tons and above; beginning-of-year figures.
xvi

During the second half of 2020, and into 2021, world trade gradually recovered but supply was less
elastic and constrained by COVID-19 related delays and congestion - leading to a significant increase in
container freight rates.
The future demand/supply balance will also be impacted by regulatory requirements to align shipping
operations with decarbonization targets. Introduced under the auspices of the International Maritime
Organization (IMO), these new regulations will require replacing some of the existing fleet so will entail
significant costs. As well as creating a degree of uncertainty, this could reduce the capital available to
expand the fleet to cater for trade growth.
Cost pressure and soaring rates and surcharges would weigh on smaller
players and prices
Since the second half of 2020 there has been an increase in freight rates. While demand for containerized
goods has been higher than expected, shipping capacity has been constrained by logistical hurdles and
bottlenecks and shortages in container shipping equipment. Unreliable schedules, and port congestion
have also led to a surge in surcharges and fees, including demurrage and detention fees.
These soaring costs are a challenge for all traders and supply chain managers, but especially for smaller
shippers who, compared with the larger players, may be less able to absorb the additional expense and
are at a disadvantage when negotiating rates and booking space on ships. Smaller shippers and low-value
paying cargo may thus find it difficult to secure service contracts and could see their margins eroded.
Freight rates are expected to remain high. Demand is strong and there is growing uncertainty on the supply
side, with concerns about the efficiency of transport systems and port operations. In the face of these cost
pressures and lasting market disruption, it is increasingly important to monitor market behaviour and ensure
transparency when it comes to setting rates, fees, and surcharges. There have been calls for governments to
intervene, and for regulators to apply closer oversight and address unfair market practices.
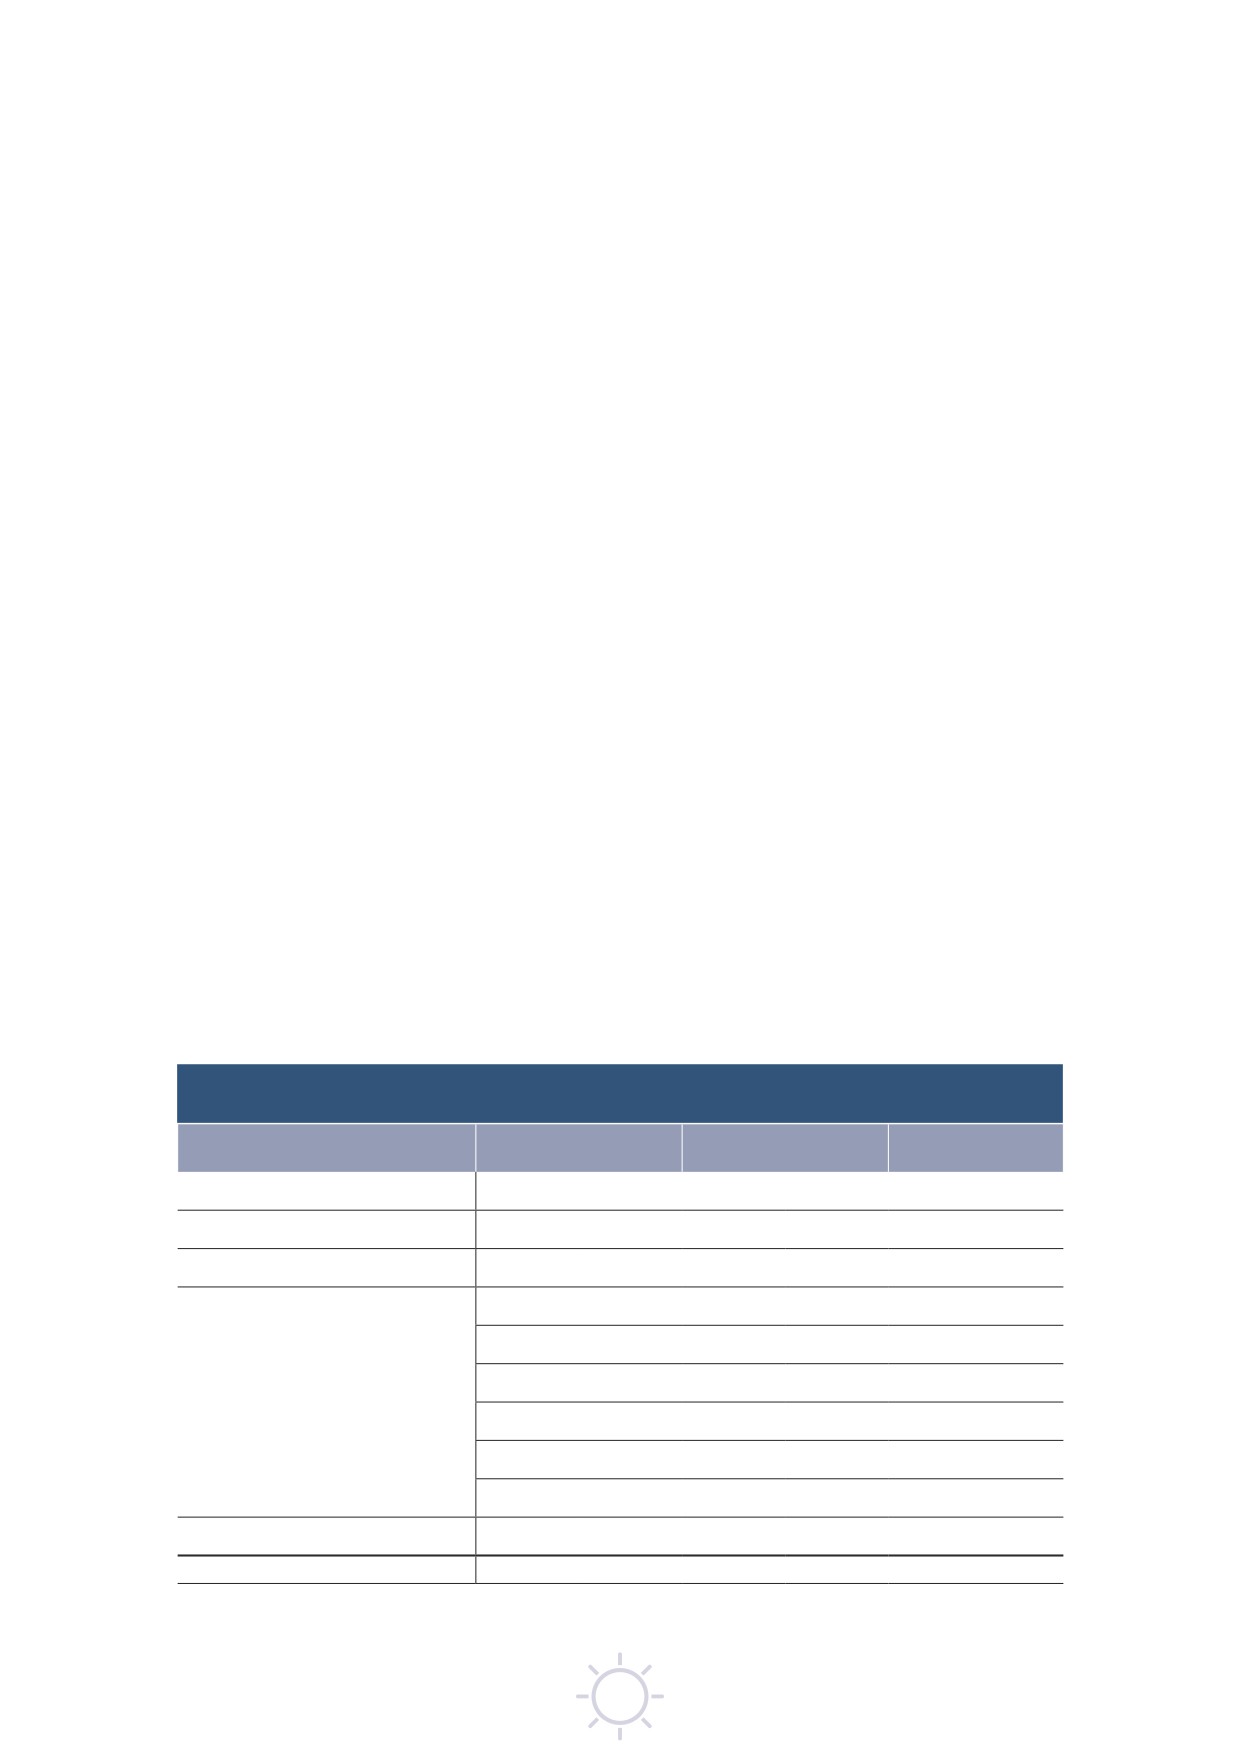
If sustained, the current surge in container freight rates, will significantly increase both import and consumer
prices. UNCTAD’s simulation model suggests that global import price levels will increase on average by
11 per cent as a result of the freight rate increases (figure 2). Hardest hit will be the small island developing
states (SIDS) who depend for their merchandise imports primarily on maritime transport and who are simulated
to face a cumulative increase of 24 per cent with a time lag of about a year.
Higher container freight rates will also have a sizeable impact on consumer prices. If container freight
rates remain at their current high levels, then in 2023 global consumer prices are projected to be 1.5 per
cent higher than they would have been without the freight rate surge. The impact is expected to be more
significant for smaller economies that depend heavily on imported goods for much of their consumption
needs. In SIDS, the cumulative increase in consumer prices is expected to be 7.5 per cent and in the
Least Developed Countries (LDCs) 2.2 per cent.
Figure 2
Simulated impact of current container freight rate surge on import and consumer
price levels
Import price increases
Consumer price increases
(%)
(%)
30
8
7.5
24.2
7
25
6
20
5
15
4
10.6
3
10
8.7
2.2
2
1.5
5
3.2
1
0.6
0
0
LDC
LLDC
SIDS
World
LDC
LLDC
SIDS
World
Sources: Based on data provided by Clarksons Research, Shipping Intelligence Network, the International Monetary Fund,
International Financial Statistics and Direction of Trade Statistics, UNCTADstat, and the World Bank, World Integrated Trade
Solution and Commodity Price Data (The Pink Sheet).
Note: The impact of container freight rate surges on prices is assessed based on a 243 per cent increase in the China
Containerized Freight Composite Index between August 2020 and August 2021. The simulation model assumes that freight
rates in August 2021 will be sustained over the remaining simulation period (September 2021 to December 2023) and all other
factors are held constant over the entire simulation period (August 2020 to December 2023).
xvii
Some goods will be affected more than others by the surge in container freight rates. Most exposed are
goods manufactured through integrated supply chains. Globalized production processes entail a greater
use of shipping, with intermediate goods often crossing borders multiple times within and between
regions. This is the case, for example, for East Asian goods destined for major markets in North America
and Europe. For computers, and electronic and optical products, for example, the consumer price uplift
induced by the current freight rate surge could be 11 per cent.
Higher shipping costs will also affect some low-value-added products: for furniture, for example, and
textiles, garments and leather products, the consumer price uplifts could be ten per cent. These increases
could erode the competitive advantages of smaller economies that produce many of these goods. At the
same time, these countries will find it more difficult to import the high-technology machinery and industrial
materials they need to move up the value chain, diversify their economies and achieve the Sustainable
Development Goals (SDGs).
Even in major economies, lingering high container freight rates and disruption in maritime transport in the
short- to medium-term threaten to undermine recovery. UNCTAD’s analysis concludes that in the United
States and the euro area, for example, a 10 per cent increase in container freight rates could lead to a
cumulative contraction in industrial production of around 1 per cent.
Structural factors keep maritime transport costs higher in developing
regions
The current historical highs in freight rates are largely driven by pandemic-induced shocks and unexpected
upward swings in shipping demand. But in the longer term, shipping and port prices are driven by structural
factors such as port infrastructure, economies of scale, trade imbalances, trade facilitation, and shipping
connectivity - all of which have lasting impacts on maritime transport costs and trade competitiveness. An
analysis based on a new UNCTAD-World Bank transport costs dataset, shows that significant structural
improvements could reduce maritime transport costs by around four per cent. Interventions and policies
that address the structural determinants of maritime transport costs can thus help mitigate the impacts
from cyclical factors and disruptions.
Other structural issues that will increase prices include the new regulations on decarbonizing shipping.
The recently adopted IMO short-term measure on greenhouse gas reduction is expected to reduce
average shipping speeds and increase maritime transport costs, especially for developing countries, and
in particular the SIDS.
COVID-19 slows operations for ships and ports
In the first half of 2020, reflecting the slump in shipping demand, cargo-carrying ships made fewer port
calls. The number of calls subsequently increased, particularly in Europe, East Asia, and South-Eastern
Asia, albeit not yet to pre-pandemic levels.
In 2020, terminal operators, authorities, and intermodal transport providers took measures to contain
COVID-19 and, as a result, ships had to spend more time in ports that were operating more slowly. The
greatest delays were for dry break bulk carriers for which cargo operations tend to be less automated and
more labour-intensive so were slowed by measures to reduce social contact.
Turnaround times can differ significantly between countries (figure 3). One group of countries with faster
turnarounds comprises those with fewer arrivals and only small ships and with only few containers loaded
and unloaded during each port call. These include Dominica, Saint Kitts and Nevis, and Saint Vincent
and the Grenadines. Another group with fast turnarounds comprises those that have the latest port
technologies and infrastructure and can accommodate the largest container vessels; they benefit from
economies of scale and thus tend to attract the highest number of port calls. These include Japan, Hong
Kong China, and Taiwan Province of China. Efficient ports initiate a positive feed-back loop: high efficiency
makes their ports attractive as ports of call, further boosting the number of arrivals. Countries in the middle
of the distribution report a wide range of median port waiting times, reflecting differences in efficiency and
other variables such as vessel age and cargo throughput.
Shipping and port performance is generally lower in developing countries. They have higher transport
costs and lower connectivity because they are often further away from their overseas markets and are
hampered by diseconomies of scale and lower levels of digitalization.
xviii
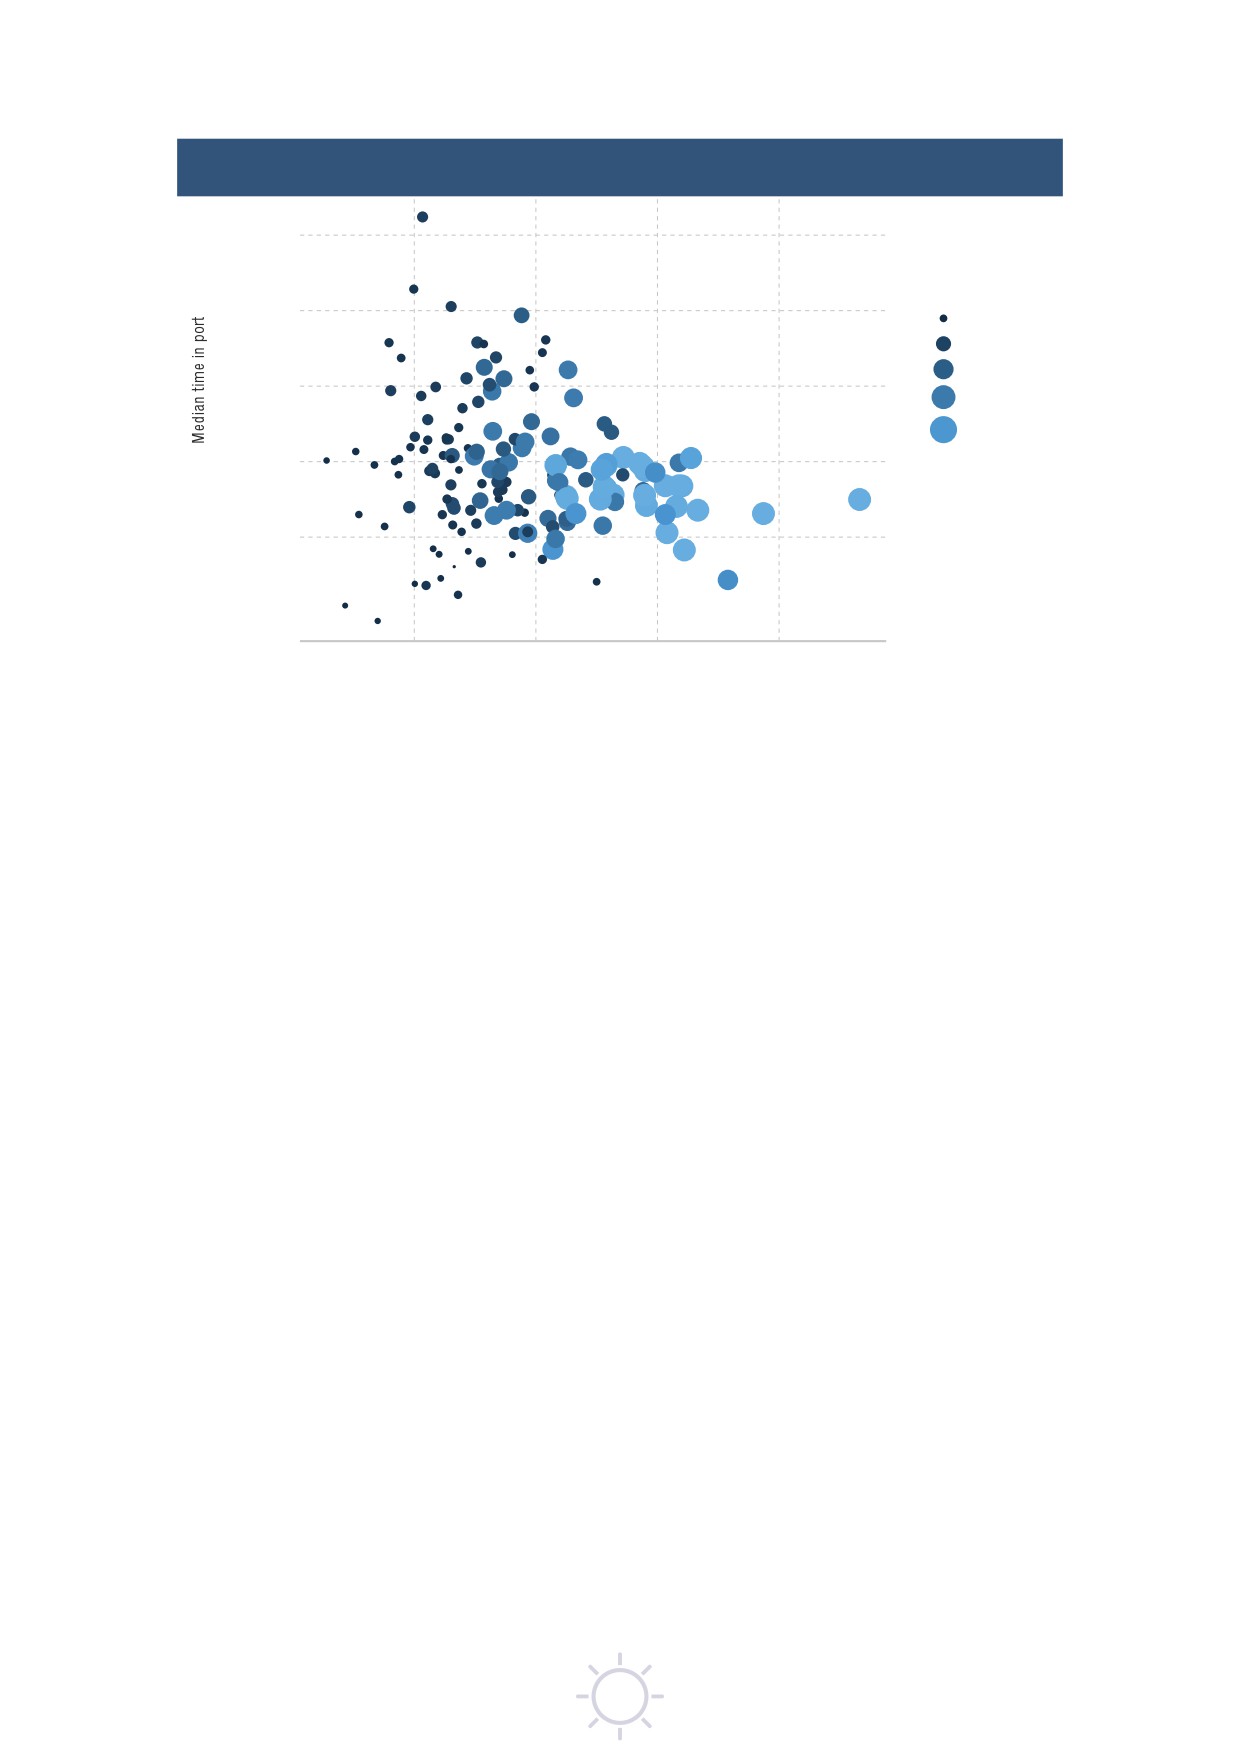
Figure 3
Median time in port, number of port calls, and maximum vessel sizes, by country,
container ships, 2020
8 days
Maximum vessel
size (TEU)
4 days
1 000
5 000
10 000
2 days
15 000
20 000
1 day
0.50 day
100
1 000
10 000
100 000
Port calls
Source: UNCTAD, based on data provided by MarineTraffic. Both axes in logarithmic scale.
Note: Ships of 1,000 GT and above. For the complete table of countries, see http://stats.unctad.org/maritime.
Positive trends in port governance and gender participation
Each year, UNCTAD uses data from its TrainForTrade Port Management Programme to benchmark
countries against each other using the Port Performance Scorecard (PPS). Many other port performance
projects focus on service provision such as cargo handling, but the PPS, which uses data for 26 indicators,
enables comparisons between entire port entities, providing data that is valuable for strategic planning
within ports and for evidence-based policy analysis at regional and state levels.
Member ports’ annual throughput in 2020 ranged from 1.5 million to 80.9 million tonnes. Around half of
were in the smallest category, less than 5 million tonnes, and the medium category, 5 million to 10 million
tonnes, a range of volumes that was similar across all regions.
Since 2015, one of the six main categories in the PPS scorecard has been the rate of female participation
in the port workforce. In 2019 and 2020, this remained low, at around 18 per cent. The rate was
significantly higher in Europe at 25 per cent, though even here roles are not equally distributed between
men and women. Women tend to be better represented in management and administrative roles, for
which between 2019 and 2020 the proportion of women increased from 38 to 42 per cent. In this case,
Asian members were above average at 52 per cent compared with those in Europe at 39 per cent.
Women are far less likely to be working in cargo handling port operations. These results highlight the need
for strategic policy interventions to deliver on Sustainable Development Goal 5 to “Achieve gender equality
and empower all women and girls.”
Port and shipping performance depend on trade and transport
facilitation
Efficient maritime transport depends on effective trade and transport facilitation that reduces the time and
cost of customs and other trade procedures and integrate new technologies for administrative formalities.
Boosts the performance of the entire supply chain with positive effects on maritime transport.
The need for cross-border trade facilitation was highlighted by the COVID-19 pandemic, particularly for
trade in medical equipment, drugs and emergency goods such as vaccines and personal protection
equipment (PPE) - which could be held up at ports by red tape or by slow clearance procedures to
comply with regulatory requirements.
In recent years, the introduction of new technology in administrative processes has boosted efficiency
along the logistics supply chain. This has involved digitalization and automation of customs processes,
xix
paperless formalities, and the introduction of single-window services - the impetus for which was boosted
during the COVID-19 pandemic.
An example of the use of ICT, is UNCTAD’s Automated System for Customs Data (ASYCUDA) which
involves automation and digitalization in supply chains. A recent development, the ASYHUB solution,
smooths data transfer between ports of departure and arrival - using risk management concepts to help
speed up clearance procedures and avoid goods being stuck in ports unnecessarily.
Another ICT innovation based on UNCTAD technology is the Trade Information Portal (TIP) - a website
in each country that provides traders with easy access to information about trade regulations and
procedures. The UNCTAD TIP offers importers and exporters online, step-by-step guides to trade-related
procedures and also helps the country fulfil its obligations arising from the World Trade Organization Trade
Facilitation Agreement. Today, 29 TIPs, based on UNCTAD technology, are being implemented globally
by UNCTAD and the International Trade Centre. Results have been very positive. TIPs are most advanced
in East Africa, where in Kenya, for example, greater transparency and simplification of a total of 52 trade
procedures so far have reduced the time spent waiting in the queue, at the counter and in between steps
by 110 hours, and the administrative fees for these 52 procedures by $482, i.e., about $11 per trade
procedure on average.
Digitalization allows a paperless environment whereby trade procedures are all carried out online. For the
traders this reduces time and cost and increases transparency and market access, while also reducing
physical contact and the risks of contagion. In addition, smart digital solutions improve public administration
of trade and boost efficiency in export, import and transit operations. Moreover, by minimizing the use of
paper, trade facilitation can also help mitigate climate change.
Reforms in trade facilitation have been promoted by the multilateral trading system, particularly through
the WTO Facilitation Agreement and the IMO Convention on Facilitation of International Maritime Traffic.
These agreements provide common standards and regulations that have proved especially valuable
during the COVID-19 pandemic. By providing governments with guidance and incentives for reforming
trade facilitation, they have paved the way for further digitalization and enhanced transparency, and
for rationalizing administrative formalities. These developments also promote robust public-private
partnerships (PPPs), such as the National Trade Facilitation Committees and Port Community Systems
that involve the business community in port operations. Efficient maritime trade and transport will depend
on aligning and streamlining the mandates and work of the various PPPs.
A continuing crisis for seafarers stranded at sea
Globally there around 1.9 million seafarers working to facilitate the way we live. The BIMCO/ICS Seafarer
Workforce Report 2021 estimated the global supply of seafarers at 1,892,720, up from 1,647,494 in 2015. Of
these, 857,540 were officers, and 1,035,180 were ratings - the skilled seafarers who carry out support work.
The five largest seafarer-supplying countries were the Philippines, the Russian Federation, Indonesia, China,
and India, representing 44 per cent of the global workforce (table 2).
Table 2
Five largest seafarer-supplying countries 2021 supplying countries 2021
All Seafarers
Officers
Ratings
1
Philippines
Philippines
Philippines
2
Russian Federation
Russian Federation
Russian Federation
3
Indonesia
China
Indonesia
4
China
India
China
5
India
Indonesia
India
Source: ISF and BIMCO, Seafarer Workforce Report 2021, London, 2021.
For the supplying countries seafarers are important sources of income. In 2019, the Philippines, for
example, earned $30.1 billion from its overseas workers - 9.3 per cent of GDP and 7.3 per cent of gross
national income (GNI) - of which $6.5 billion came from its seafarers. In 2020 total remittances fell 0.8 per
cent to $29.9 billion, with those from seafarers falling 2.8 per cent to $6.4 billion.
During the COVID-19 pandemic, seafarers continued to demonstrate great professionalism and dedication,
supporting the delivery of food, medical supplies, fuel, and other essential goods, and helping keep supply
chains active and global commerce running.
xx
However, hundreds of thousands of seafarers remain stranded at sea. Each month, crews need to be
changed over - to prevent fatigue and comply with international maritime regulations for safety, health
and welfare. Responding to COVID-19, governments closed many borders and imposed lockdowns and
prohibited people from disembarking thus temporarily suspending crew changes. As a consequence,
large numbers of seafarers have been unable to be replaced or repatriated after long tours of duty and had
to extend their service on board. Even over a year into the pandemic, due to these restrictions, and the
shortage of international flights, according to latest estimates by the International Chamber of Shipping,
around 250,000 seafarers remain stranded, far beyond the expiration of their contracts. Yet, there is still
no global consensus on uniform measures to allow for efficient crew changes and transfer.
During the pandemic, stakeholders, including international bodies, governments, and industry, have
issued recommendations and guidance - aiming to ensure that seafarers are healthy and protected
from COVID-19, have access to medical care, and are recognized as key workers and are vaccinated
as a matter of priority, and also that ships and port facilities meet international sanitary requirements.
Nevertheless, as the pandemic continues for a second year, seafarers remain very vulnerable.
With some notable exceptions, only a small proportion of the world’s seafarers have been vaccinated.
Belgium has demonstrated best practice, and July 2021 started a vaccination campaign for all seafarers
arriving in a Belgian port, regardless of nationality.
To address seafarers’ issues there has been a continuous level of cooperation among international
organizations and industry bodies, including IMO, ILO, WHO, UNCTAD, ICS, and ITF, which have repeatedly
expressed concern about the humanitarian crisis in the maritime shipping sector and urged Member
States to designate seafarers and other marine personnel as key workers, accept seafarers’ identity
documents as evidence of their key worker status, and allow flexibility for ship owners and managers to
divert ships to ports where crew change is possible without imposing penalties.
On 1 December 2020, the UN General Assembly unanimously adopted a resolution: International
cooperation to address challenges faced by seafarers as a result of the COVID-19 pandemic to support
global supply chains
(A/RES/75/17). This urges Member States to designate seafarers and other
marine personnel as key workers and encourages governments and other stakeholders to implement
the “Industry Recommended Framework of Protocols for ensuring safe ship crew changes and travel
during the Coronavirus (COVID-19) pandemic”. It also calls upon governments to facilitate maritime crew
changes - for example, by enabling them to embark and disembark, expediting travel and repatriation
efforts, and ensuring access to medical care. The resolution also requests IMO, ILO and UNCTAD to
inform the General Assembly at its 76th session on issues related to the resolution.
This follows earlier resolutions from other bodies. On 21 September 2020 the IMO’s Maritime Safety
Committee recommended action to facilitate ship crew change, access to medical care, and seafarer
travel during the COVID-19 pandemic. According to IMO, as of the end of June 2021, 60 Member
States and two Associate Members had signed on to designate seafarers as key workers. Similarly, on
8 December 2020 the Governing Body of the ILO, adopted the “Resolution concerning maritime labour
issues and the COVID-19 pandemic”.
In January 2021, the shipping industry issued the Neptune Declaration on Seafarer Wellbeing and Crew
Change, which by June 2021 had been signed by more than 600 companies and organizations. They
have also produced a Neptune Declaration Crew Change indicator which aggregates data from 10
leading ship managers which collectively have about 90,000 seafarers currently on board. This reported
that between June and July 2021 the situation appeared to be worsening, with more seafarers on
vessels beyond the expiry of their contract and more who had been on board for over 11 months - the
maximum length of time envisaged in the 2006 Maritime Labour Convention (MLC). Since the launch of
the indicator in May 2021, the proportion of seafarers on vessels beyond the expiry of their contract had
risen from 5.8 to 8.8 per cent while the proportion on board for over 11 months had increased from 0.4 to
1.0 per cent.
Advances in international law and technology
The COVID-19 pandemic has interfered with international trade, creating inefficiencies, delays and
supply-chain disruptions on an unprecedented scale - which also have legal consequences if contractual
performance is disrupted, delayed, or becomes impossible. For shipping this can lead to litigation that
raises complex international jurisdictional issues. Government and industry will need to work together
to address the related contractual rights and obligations, and arrive at standard contractual clauses for
commercial risk-allocation.
xxi
Many of the problems are associated with delays in documentation - which should encourage more
commercial parties to adopt secure electronic solutions. Updated industry guidelines adopted recently,
offer useful guidance to shipowners and operators on procedures and actions to maintain the security
of IT systems in their companies and onboard ships, adopting a cyber-risk management approach, and
taking account of the IMO requirements, and other relevant guidelines.
Technological innovation is also raising the prospect of automated crewless vessels. The industry is
conducting trials on “maritime autonomous surface ships” (MASS). The aim is to ensure safe, secure and
environmentally sustainable shipping with the relevant legal framework. In May 2021, the IMO Maritime
Safety Committee completed a regulatory scoping exercise for the use of MASS which highlighted some
priority issues. The outcome could be a MASS instrument/code, with goals, functional requirements and
corresponding regulations, suitable for different degrees of autonomy.
On the path to a 3°C temperature rise
The shipping industry has an important part to play in combatting climate change. The Paris Agreement
aimed to reduce global warming to well below 2°C and pursue 1.5°C. But, despite a brief dip in carbon
dioxide emissions caused by the COVID-19 pandemic, the world is still heading for a temperature rise in
excess of 3°C this century. Urgent action is needed on both mitigation and adaptation.
At the regulatory level, the shipping industry is addressing climate issues through the
1973/1978
International Convention for the Prevention of Pollution from Ships (MARPOL). In June 2021, the IMO
adopted amendments to Annex VI of the Convention, which introduced new mandatory regulations to
further reduce greenhouse gas emissions from shipping, and require owners to set energy efficiency targets.
There were also initial discussions on the mid- and long-term action needed, including market-based
measures, along with an industry-led proposal for an International Maritime Research and Development
Board a non-governmental body which would be financed by a levy on marine fuel and would support
research, development, and the deployment of zero-carbon technologies.
Climate change, with the prospect of accelerating sea-level rise and more extreme weather events,
will also have major implications for the world’s seaports. Securing global maritime transport and trade
will therefore mean investing in adaptation and building resilience- for seaports and other key transport
infrastructure, especially in developing countries.
Broad-based global recovery will depend on smart, resilient and
sustainable maritime transport
The COVID-19 pandemic triggered a succession of shocks and waves, each setting off their own spinoff
events. The extent and impact of disruption varied considerably, however, between regions, economic
sectors, and segments of the shipping market. The recovery is similarly proving uneven, with differences
in the levels and scale of policy support and unequal access to vaccines.
Although the initial impact on maritime transport was less dramatic than predicted, the outlook is shadier.
The timescale for a lasting recovery will depend on the progress of the pandemic, the extent and timing of
world vaccination plans, and the duration of policy support measures. At present the nascent recovery is
being threatened by supply-chain breaks and logistical bottlenecks that are disrupting shipping markets
and pushing cost levels to historic highs.
The COVID-19 disruption has also accelerated pre-existing megatrends - geopolitical, technological, and
environmental. These trends have been unfolding slowly over the past decade but have accelerated
during the pandemic and continue to transform maritime transport and trade:
Geopolitics - The COVID-19 health crisis underscored the extent to which nations are economically and socially
interdependent - integrated through global supply chains and their underlying extended maritime transport networks.
In the face of heightened geopolitical risks and rising trade tensions, many countries and enterprises are shifting their
mindsets and now perceive global interdependency partly as a vulnerability. To mitigate risks and build resilience -
they are therefore aiming to reduce their reliance on distant foreign suppliers.
Resilience - The COVID-19 disruption has tested supply chains and their underlying business models, and put
transport and logistics networks under strain. Enterprises and governments are aiming to make supply chains more
robust and resilient, including by looking to diversify their business partners and suppliers. This will involve a new
balance between local, regional and global production. They are also reconsidering inventory and stock management
strategies and the trade-offs between just-in-time and just-in-case supply chain models.
xxii
Technology - Customs officials, port workers, and transport operators increasingly recognize the value of new
technologies and digitalization, not just as a way of boosting efficiency but also for maintaining business continuity
at times of disruption. Technological innovations include advanced analytics, on-board sensors, communications
technology, port-call optimization, blockchains, big data, and autonomous ships and vehicles. During the pandemic,
these technologies have helped reduce physical contact, and keep ships moving, ports open and cross-border trade
flowing. Technological advances have also stimulated consumer spending online and a growth in e-commerce. These
trends will continue to redefine production and consumption patterns and the ways in which ships, ports and their
hinterland connections deliver cargo and services.
Shipping market dynamics - In anticipation of future disruptions, carriers, shippers, ports, and inland transport
operators will be rethinking their business and operating models to respond more flexibly to changing market
conditions. Having seen the way in which the trade rebound stumbled against logistical bottlenecks and constrained
capacity following the COVID-19 shock, they are likely to reconsider their levels of investment in shipping and ports as
well as their planning operations. They can also anticipate potential greater regulation of shipping markets as national
competition authorities step up their monitoring of freight rates and market behaviour and scrutinize rapid movements
in shipping prices.
Decarbonization and the energy transition - Maritime transport is facing growing pressure to decarbonize and
operate in a more sustainable way - issues that have also come to the fore as part of the post-pandemic recovery.
With ongoing IMO work on greenhouse gas emission reduction in shipping providing further momentum, shipping
is expected to change its fuel mix and use new technology and ship designs, alternative fuels and operational
adjustments to cut its carbon and environmental footprint. For energy, shipping is not just a large-scale user but also
a major carrier, so the industry will have to respond to lower demand for oil tankers and coal carriers and more for
ships transporting hydrogen, ammonia and other alternative fuels.
Climate adaptation and resilience - Maritime transport infrastructure and services came under severe stress
as a result of the pandemic and the closure of the Suez Canal. This was in addition to the ongoing dangers of
climate change: over recent years extreme weather events, including floods, hurricanes and cyclones, have been
causing frequent and intense disruptions for both coastal infrastructure and hinterland connections. With current
climate projections pointing to a global warming trajectory exceeding the agreed targets under the Paris Agreement,
the maritime industry and governments need to invest in adaptation and in climate-proofing maritime transport
infrastructure and services, as well as accelerate the development of related legal, policy and technical measures,
and capacity-building.
xxiii
Priorities for action
1. Vaccinate the world - To complete broad-based global vaccination, developing countries should
have fair access to vaccines. Investing in global vaccination, with the support of dedicated funds, will
not just accelerate the end of the pandemic but also stimulate the recovery and add trillions to global
economic output.
2. Revitalize the multilateral trade system - Decades of trade liberalization and multilateral action
have brought economic and social benefits that are now under threat from increasing trade restrictions
and protectionism. To retain these hard-won gains countries will need to defend and consolidate the
multilateral trade system and minimize trade restrictiveness.
3. End the crew-change crisis - This requires urgent attention from flag, port and labour-supplying
states, in collaboration with relevant international organizations. All states should be parties to the relevant
international legal instruments, including the MLC 2006, ILO Conventions Nos. 108 and 185 on Seafarers’
Identity Documents, and the IMO FAL Convention. To advance the objectives of SDG 8, and to ensure
decent work for seafarers, states also need to redouble their efforts to ensure that these conventions and
labour standards are fully implemented.
4. Vaccinate seafarers - Concerted collaborative efforts by industry, governments and international
organizations should ensure that seafarers are designated as key workers and are vaccinated as a matter
of priority.
5. Facilitate crew changes - Governments and industry should continue to work together, including
through the Neptune Declaration initiative, and in collaboration with relevant international organizations,
to facilitate crew changes, in accordance with international standards and in line with public health
considerations. They should also ensure the availability and access to related seafarer data.
6. Ensure reliable and efficient maritime transport - Stakeholders in the maritime supply chain,
including carriers, ports, inland transport providers and shippers, should work together to ensure that
maritime transport remains a reliable, predictable and efficient mode of transport. This will require investing
in shipping and ports and their hinterland connections while devising and implementing sustainable freight
transport solutions. It will also require proper implementation of trade facilitation measures and digital tools
and technologies.
7. Mainstream supply chain resilience, risk assessment and preparedness - This can be achieved
through a portfolio of measures, including dual sourcing, redundancy across suppliers, and backing up
production sites, inventory, and stocks, along with better risk management, and end-to-end transparency.
Typically, this will involve assessing and managing risks, enhancing preparedness and adopting hybrid
solutions that are flexible and agile, and arrive at balanced trade-offs, for example, between nearshoring
and reshoring and combining hybrid supply chain models, along with measures to reduce vulnerabilities
to cyberattacks.
8. Control costs - Freight costs can be contained by expanding capacity to match demand, making
ports more efficient, improving planning, forecasting and visibility, and implementing trade facilitation
measures. The maritime transport market should also be transparent, fair and competitive. National
competition authorities therefore need the capacity to monitor trends in freight rates, fees and charges.
Stakeholders along the maritime supply chain including carriers, ports, inland transport providers,
customs, and shippers should work together to share information and make maritime transport more
efficient.
9. Decarbonize - The shipping industry, in cooperation with governments, will need to explore
alternative fuels, invest in landside infrastructure and replace older vessels with larger and more
fuel-efficient ships. This will require a predictable environment at the global level but in addition,
structurally weak developing countries will need help to mitigate transition costs and the lower
connectivity that could result from decarbonizing maritime transport. Developing countries will also
need to gain a better understanding of how new regulations will affect the maritime transport services.
Integrated post-pandemic recovery planning and stimulus packages should earmark resources for
environmental sustainability, aiming for green, low-carbon maritime transport.
10. Climate-proof maritime transport - Countries should anticipate, prepare for and adapt to
climate change by fully understanding the risks, exposure, and vulnerabilities, and by building adaptive
capacity across the maritime supply chain. For developing countries, including the most vulnerable
groups of countries, building back better after the pandemic will mean scaling up investment and
building national capacities in climate-proofing.
xxiv
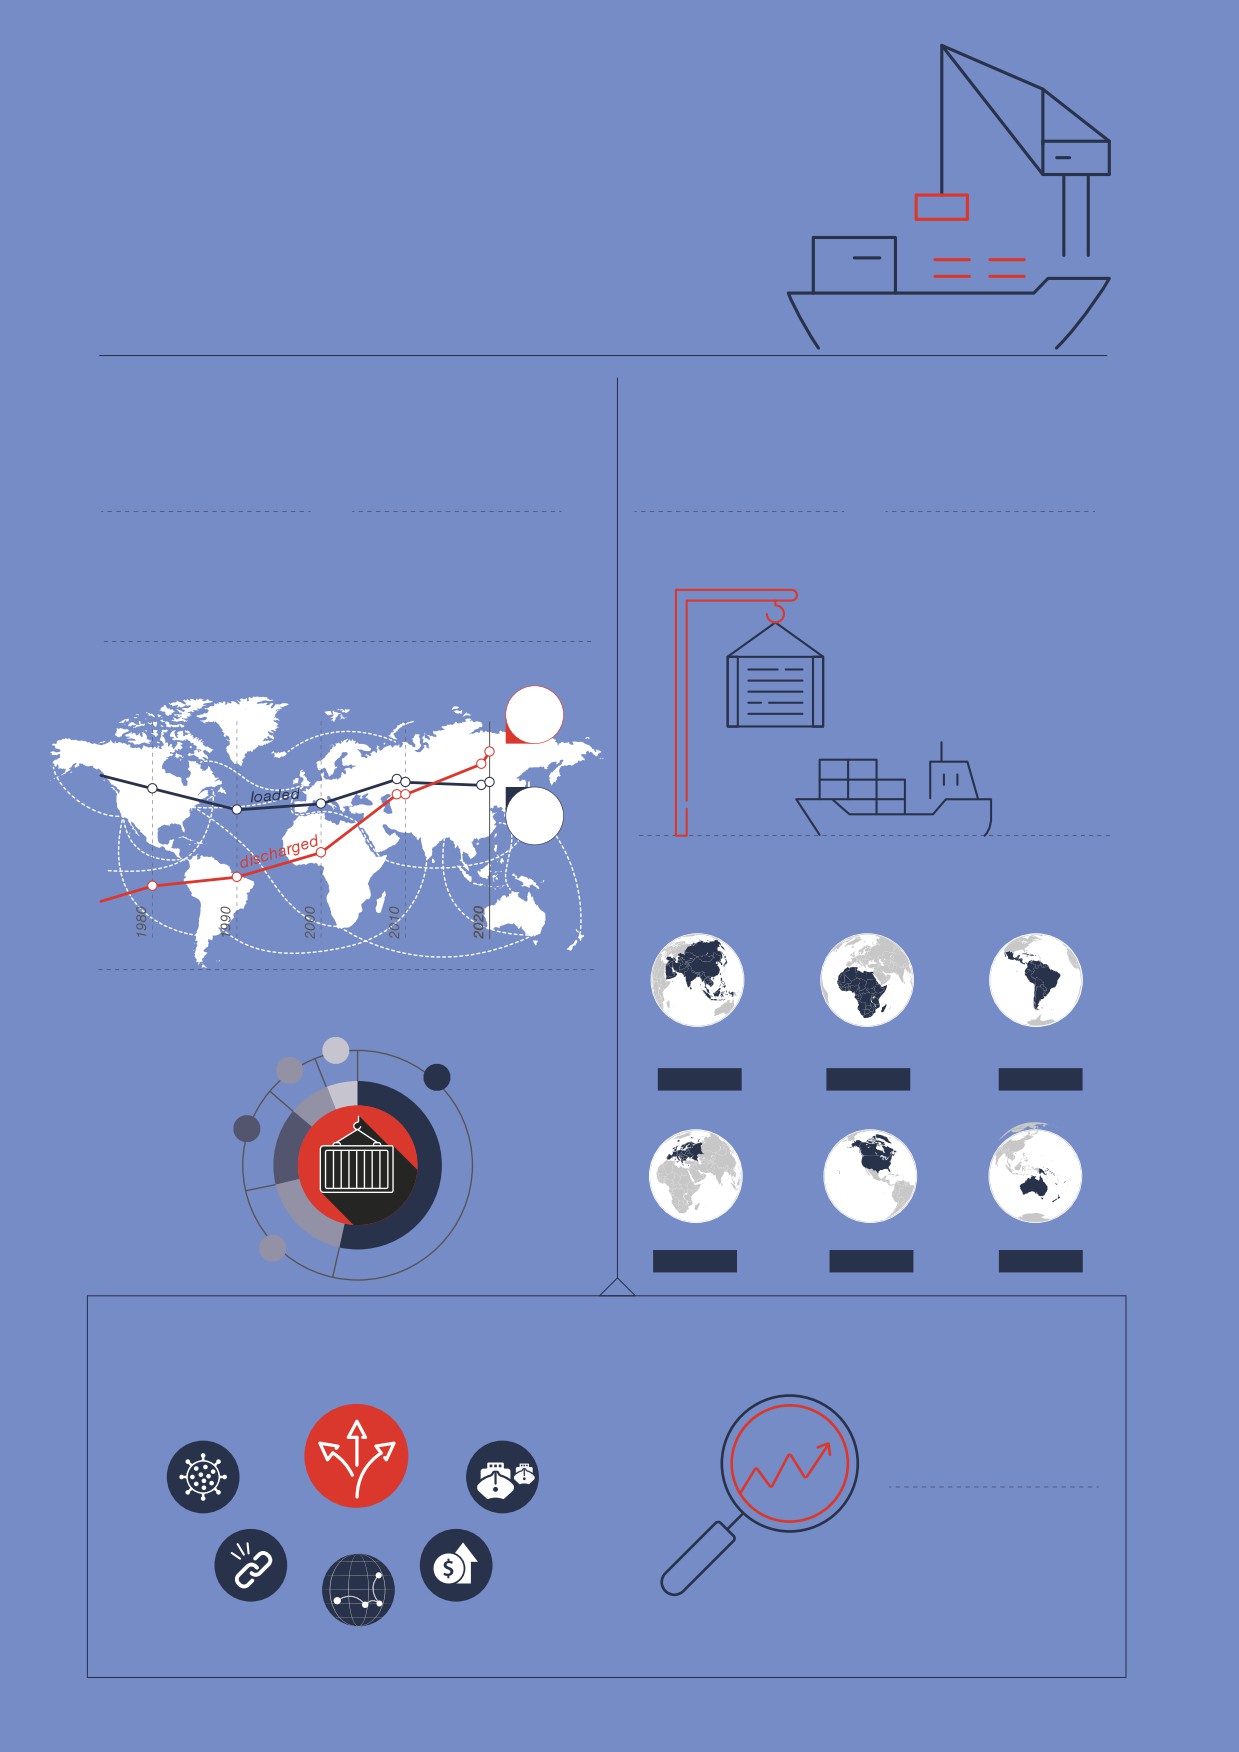
In 2020, international maritime trade and global supply
chains were hit by the impact of the COVID-19 pandemic.
Overall however, maritime transport managed to navigate
through the crisis, and for some parts of the supply chain
the impact was not as dramatic as initially feared. Carriers
were able to mitigate the early shock and manage lower
levels of demand. Port and landside operations, however,
struggled to adjust, and the world’s seafarers faced
a precarious situation as they became caught up in an
unprecedented global crew-change crisis.
In 2020, global economic output fell by 3.5 per cent and
merchandise trade by
5.4 per cent, while international
maritime shipments fell by 3.8 per cent, to 10.65 billion tons.
However, UNCTAD expects world maritime trade to recover by
4.3 per cent in 2021, and growth is projected to continue over
the 2022-2026 period, albeit at rates that will be moderated
by the easing in world economic output. Although the
short-term outlook is positive, the medium- and longer-term
prospects remain uncertain: the upturn will be directed by the
future path of the pandemic and the associated lockdowns
and restrictions. A lasting recovery also hinges on keeping
trade flowing, by creating supportive macroeconomic and
fiscal conditions while minimizing trade protectionism.
Throughout 2021, much of the global economic revival will
be driven by government spending in major economies, so
the patterns and geography of the recovery will be shaped
by the ways in which their governments wind up these
support measures - in terms of scale, focus, and timing.
Progress could, however, still be derailed by further outbreaks
of the pandemic, by slow vaccine deployment and in many
1
economies by the limited scope for policy support. It has
become clear that broad-based recovery will require an end
to the health crisis and an equitable distribution of vaccines
across all regions, developed and developing.
International maritime
Starting in late 2020, a swift rebound in containerized trade
stumbled against supply-side constraints - which increased
trade and port traffic
costs, dented reliability of service, and undermined the operation
of value chains. As global demand patterns normalize, these
problems are likely to dissipate, but the longer- term outlook
will continue to be shaped by wide-ranging and longer-term
structural factors, including patterns of globalization, changes
in consumption habits, digitalization and the growth of
ecommerce, as well as by the global energy transition and the
imperative of environmental sustainability.
The impact of COVID-19 has also highlighted the need for
better risk management, and greater preparedness, and
resilience. The disruption was amplified by other events
that created transport bottlenecks - in some countries by
flooding, for example, and especially by the blocking of the
Suez Canal, which exposed risks and vulnerabilities in supply
chains. Building future resilience will entail reforming business
models and global supply chains, and reorganizing maritime
transport networks.
This chapter considers developments in maritime transport
and trade during 2020 until mid-2021. Section A reviews the
situation of international maritime trade and container port
traffic. Section B sets out the outlook for global recovery and
its sustainability. Section C puts forward some key policy
considerations and action areas.
Maritime trade
and port cargo
traf c
INTERNATIONAL SEABORNE TRADE
WORLD CONTAINER PORT TRAFFIC
IN 2020
IN 2020
Growth slipped by
Total volumes reached
Down by
Volumes estimated at
-3.8%
10.7 billion tons
-1.2%
815.6 million TEUs
following on a weak
pre-pandemic growth
of 0.5% in 2019
2020 and 2021 exposed
Developing countries continue to account for the lion's
ports' vulnerability to
share of world maritime trade by volume
disruptions and risks
70%
60%
World container port traf c by region, 2019-2020
(percentage annual change)
World maritime trade, percentage share per region
Africa
Latin America
6
Asia
Africa
and the Caribbean
Oceania
8
54
Asia
-0.4
0.0
-1.8
Europe
15
Europe
North America
Oceania
Americas
18
-4.2
-1.9
-0.8
OUTLOOK
Short-term outlook for maritime trade is positive,
UNCTAD expects world
however, risks are manifold and uncertainty remains
maritime trade to recover
by
+4.3% in 2021
Growth in maritime trade
Covid-19
Uncertainty
Congestion
volumes expected to
pandemic
in ports
moderate and expand at an
annual rate of
+2.4%
Supply chain
Transport
disruption
Change in
costs
between 2022 and 2026
globalization patterns
1. International maritime trade and port traffic
A. VOLUMES OF INTERNATIONAL MARITIME TRADE AND PORT TRAFFIC
The demand for maritime transport services and infrastructure can be assessed through key
indicators on trade and port cargo handling. Over the review period, these followed a rollercoaster
ride: in early
2020 demand tanked as a result of the pandemic but then bounced back in the
second half.
1. International maritime trade fell in 2020 as the pandemic sequentially
disrupted supply, demand, and logistics
In 2020, the pandemic disrupted the world economy, cutting manufacturing activity and consumption
- with impacts on supply, demand and logistics. International maritime trade growth had already been
weak in 2019 at 0.5 per cent, but in 2020 it
declined by 3.8 per cent. Total volume dropped
Table 1.1
International maritime trade,
by 422 million to 10.65 billion tons (table 1.1 and
1970-2020
table 1.2).
(millions of tons loaded)
Tanker
Main
Other dry
Total (all
Nevertheless, the impact was not as dramatic
Year
tradera
bulkb
cargoc
cargoes)
as initially feared and the maritime transport
1970
1 440
448
717
2 605
sector managed to navigate through the crisis
1980
1 871
608
1 225
3 704
(figure 1.1). In 2020, maritime trade increased as
a proportion of global GDP, with an increase in
1990
1 755
988
1 265
4 008
the maritime trade-to-GDP ratio as the pandemic
2000
2 163
1 186
2 635
5 984
induced a shift in consumer demand from
2005
2 422
1 579
3 108
7 109
services to traded goods. However, this is likely
2006
2 698
1 676
3 328
7 702
to be short lived as demand patterns normalize
2007
2 747
1 811
3 478
8 036
and spending continues to rebalance back
towards services. In 2021, the narrative is still
2008
2 742
1 911
3 578
8 231
being driven by the pandemic and related risks,
2009
2 641
1 998
3 218
7 857
but attention is now moving toward the vaccine
2010
2 752
2 232
3 423
8 408
rollout, the recovery in growth, and the supply and
2011
2 785
2 364
3 626
8 775
demand pressures that are currently disrupting
2012
2 840
2 564
3 791
9 195
trade logistics. At the same time, the industry
2013
2 828
2 734
3 951
9 513
must consider the longer-term sustainability and
resilience of shipping, ports and their hinterland
2014
2 825
2 964
4 054
9 842
connections.
2015
2 932
2 930
4 161
10 023
2016
3 058
3 009
4 228
10 295
Around two-thirds of global trade in goods
takes place in developing countries (figure 1.2).
2017
3 146
3 151
4 419
10 716
As indicated in table 1.2, in 2020, developing
2018
3 201
3 215
4 603
11 019
countries, including the transition economies
2019
3 163
3 218
4 690
11 071
of Asia, accounted for 60 per cent of global
2020
2 918
3 181
4 549
10 648
goods loaded (exports) and
70 per cent of
goods discharged
(imports). Much of this
Sources: Compiled by the UNCTAD secretariat based on
growth has been in East Asia, especially China,
data supplied by reporting countries and as published on
the relevant government and port industry websites, and by
and there has also been a surge in volumes
specialist sources. Dry cargo data for 2006 onwards has been
on the Transpacific containerized trade route
revised and updated to reflect improved reporting, including
linking East Asia to North America. A smaller
more recent figures and a better breakdown by cargo type.
Since 2006, the breakdown of dry cargo into “Main bulk” and
proportion of trade was in developed countries,
“Other dry cargo” is based on various issues of the Shipping
which generated 40 per cent of global maritime
Review and Outlook and Seaborne Trade Monitor, produced
exports
(goods loaded) and
31 per cent of
by Clarksons Research. Total maritime trade figures for 2020
imports (goods discharged).
are estimated based on preliminary data or on the last year
for which data were available.
Asia’s predominance was further strengthened
a Tanker trade includes crude oil, refined petroleum products,
in
2020 as it maintained its
41 per cent
gas, and chemicals.
contribution to total goods loaded and increased
b Main bulk includes iron ore, grain, coal, bauxite/alumina,
and phosphate. Starting in 2006, “Main bulk” includes iron
its contribution to total goods discharged
ore, grain, and coal only. Data relating to bauxite/alumina and
(table
1.2 and figure 1.3). Developing America
phosphate are included under “Other dry cargo”.
and Africa maintained their existing, smaller
c Includes minor bulk commodities, containerized trade, and
shares.
residual general cargo.
3
Table 1.2
International maritime trade 2019-2020, by type of cargo, country group and region
Goods loaded
Goods discharged
Other
Other
tanker
tanker
Year
Total
Crude oil
tradea
Dry cargo
Total
Crude oil
tradea
Dry cargo
Millions of tons
2019
11 070.5
1 860.3
1 302.6
7 907.6
11 055.1
2 022.8
1 320.5
7 711.8
World
2020
10 648.3
1 716.0
1 202.3
7 730.0
10 631.1
1 863.6
1 222.0
7 545.5
2019
4 503.2
453.6
477.1
3 572.6
3 778.3
902.0
463.3
2 412.9
Developed
economies
2020
4 317.4
425.9
430.3
3 461.2
3 245.2
732.5
370.2
2 142.5
2019
6 567.3
1 406.7
825.5
4 335.1
7 276.8
1 120.7
857.2
5 298.9
Developing
economies
2020
6 330.9
1 290.1
772.0
4 268.8
7 385.9
1 131.2
851.7
5 403.0
2019
814.1
302.8
91.6
419.6
533.7
35.3
113.4
385.0
Africa
2020
735.5
236.1
83.4
415.9
510.1
30.6
107.9
371.5
Latin America
2019
1 406.6
221.9
81.3
1 103.3
621.4
45.0
143.7
432.6
and the
2020
1 369.2
200.5
75.6
1 093.1
590.1
39.6
130.0
420.5
Caribbean
2019
4 331.4
880.1
644.6
2 806.6
6 108.0
1 039.6
595.6
4 472.7
Asia
2020
4 212.2
851.8
605.8
2 754.5
6 272.4
1 060.2
609.6
4 602.6
2019
14.5
1.7
7.8
5.0
14.9
0.8
5.4
8.6
Oceania
2020
14.6
1.8
7.8
5.1
15.4
0.7
5.5
9.1
Goods loaded
Goods discharged
Other
Other
tanker
tanker
Year
Total
Crude oil
tradea
Dry cargo
Total
Crude oil
tradea
Dry cargo
Percentage share
2019
100.0
16.8
11.8
71.4
100.0
18.3
11.9
69.8
World
2020
100.0
16.1
11.3
72.6
100.0
17.5
11.5
71.0
2019
40.7
24.4
36.6
45.2
34.2
44.6
35.1
31.3
Developed
economies
2020
40.5
24.8
35.8
44.8
30.5
39.3
30.3
28.4
2019
59.3
75.6
63.4
54.8
65.8
55.4
64.9
68.7
Developing
economies
2020
59.5
75.2
64.2
55.2
69.5
60.7
69.7
71.6
2019
12.4
21.5
11.1
9.7
7.3
3.2
13.2
7.3
Africa
2020
11.6
18.3
10.8
9.7
6.9
2.7
12.7
6.9
Latin America
2019
21.4
15.8
9.8
25.5
8.5
4.0
16.8
8.2
and the
Caribbean
2020
21.6
15.5
9.8
25.6
8.0
3.5
15.3
7.8
2019
66.0
62.6
78.1
64.7
83.9
92.8
69.5
84.4
Asia
2020
66.5
66.0
78.5
64.5
84.9
93.7
71.6
85.2
2019
0.2
0.1
1.0
0.1
0.2
0.1
0.5
0.2
Oceania
2020
0.2
0.1
0.9
0.1
0.2
0.1
0.5
0.2
Source: Compiled by the UNCTAD secretariat based on data supplied by reporting countries and as published on the relevant
government and port industry websites, and by specialist sources. Dry cargo data for 2006 onwards has been revised and
updated to reflect improved reporting, including more recent figures and a better breakdown by cargo type. Total maritime
trade figures for 2020 are estimated based on preliminary data or on the last year for which data were available.
Note: Since March 2021, the category “transition economies” is no longer used by UNCTAD. Economies formerly classified
as “transition economies” and located in Europe, are reassigned to the “developed regions” grouping, and the economies
formerly classified as “transition economies” and found in Asia, are reassigned to the “developing regions” grouping. For more
extended time series and data before 2020 see UNCTADstat Data Center at https://unctadstat.unctad.org/wds/TableViewer/
tableView.aspx?ReportId=32363. Annual world totals of goods loaded and discharged are not necessarily the same, given
among other factors, bilateral asymmetries in international merchandise trade statistics and the fact that volumes loaded in
one calendar year may reach their port of destination in the next calendar year.
a Include crude oil, refined petroleum products, gas, and chemicals.
4
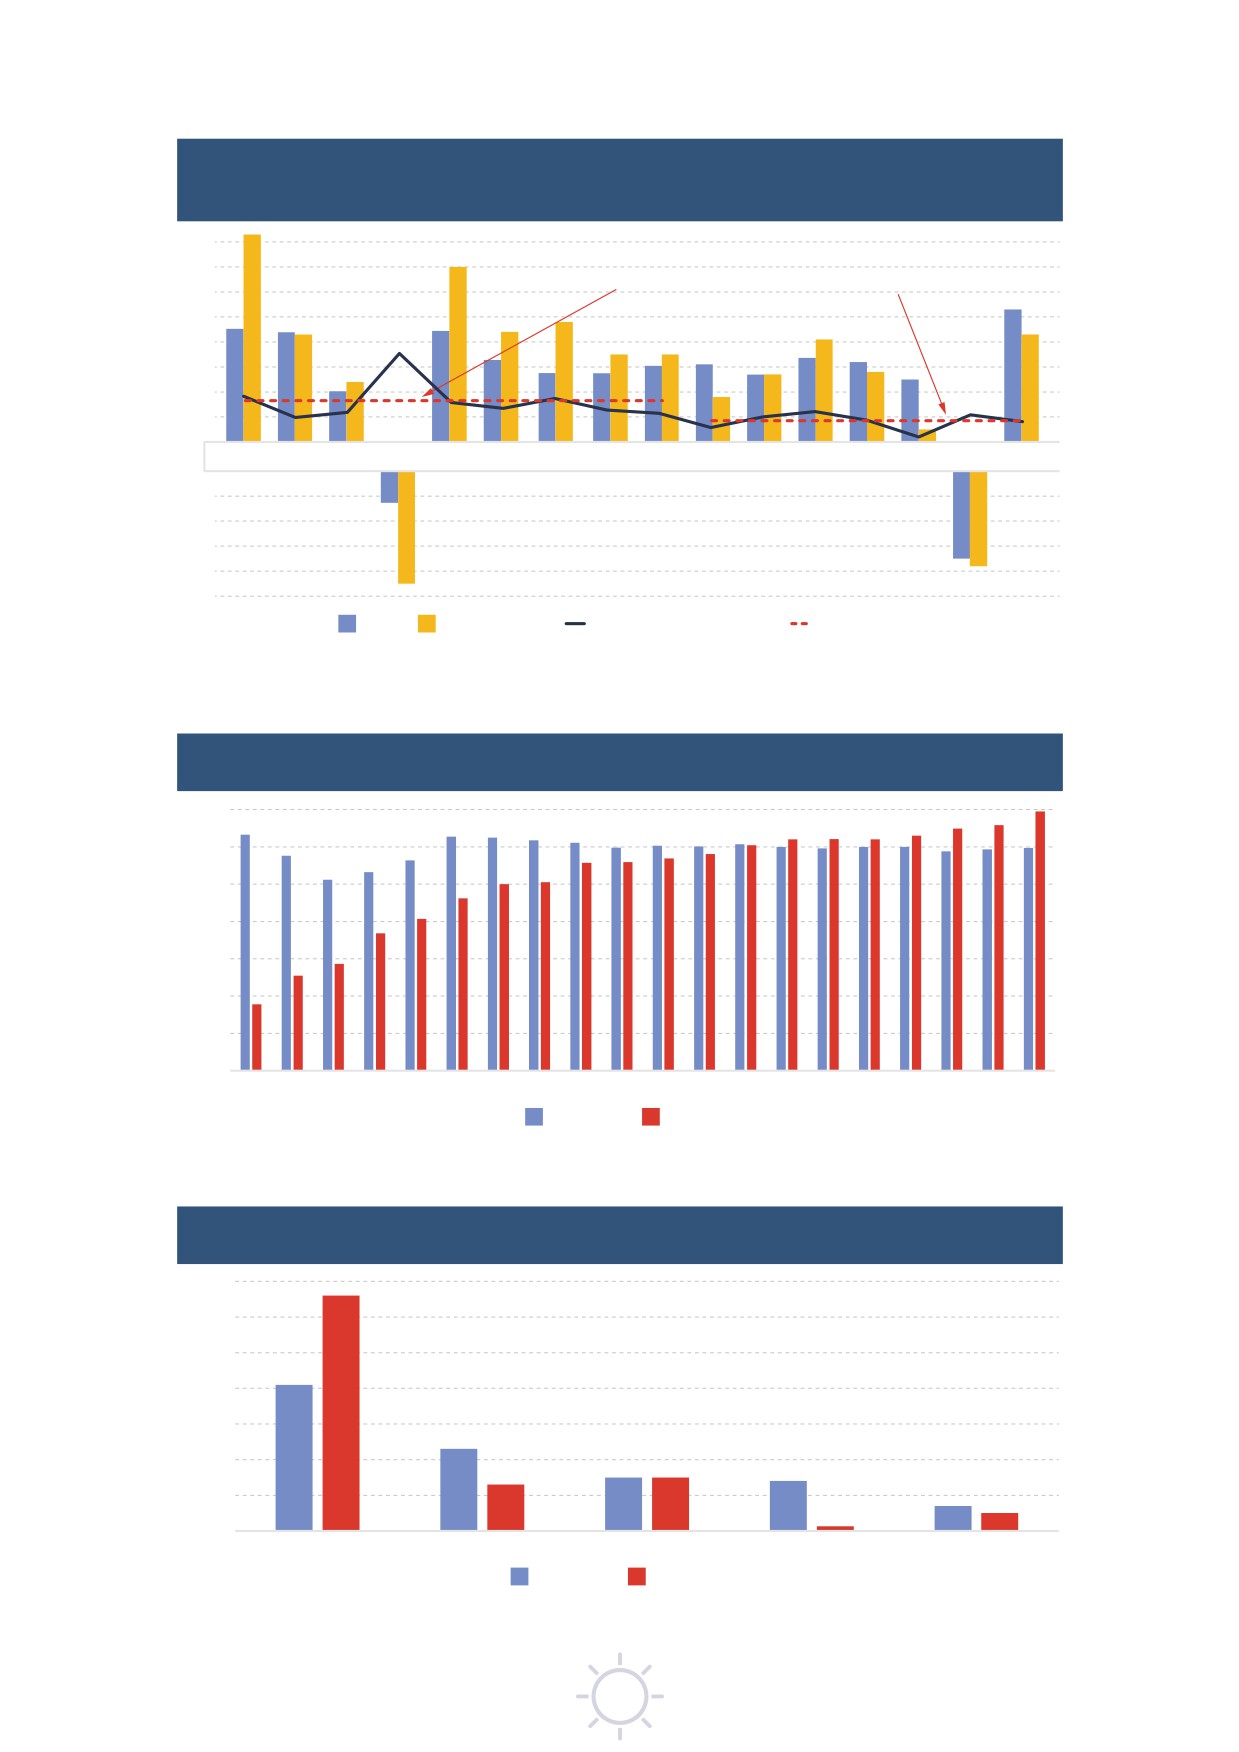
1. International maritime trade and port traffic
Figure 1.1
International maritime trade, world gross domestic product (GDP)
and maritime trade-to-GDP ratio, 2006 to 2021
(percentage annual change and ratio)
8
7
Average ratio 2006-2014
Average ratio 2015-2021
6
5
4
3
2
1
0
2006
2007
2008
2009
2010
2011
2012
2013
2014
2015
2016
2017
2018
2019
2020
2021
-1
-2
-3
-4
-5
GDP
Maritime trade
Maritime trade-to-GDP ratio
Average ratio
Source: UNCTAD calculations, based on the Review of Maritime Transport, various issues, data from UNCTADstat and
table 1.1 of the UNCTAD Trade and Development Report 2021. From Recovery to Resilience: The Development Dimension.
Figure 1.2
Participation of developing countries in international maritime trade, selected years
(percentage share in total tonnage)
70
60
50
40
30
20
10
0
1970 1980 1990 2000 2005 2006 2007 2008 2009 2010 2011 2012 2013 2014 2015 2016 2017 2018 2019
2020
Loaded
Discharged
Source: UNCTAD secretariat based on the Review of Maritime Transport, various issues, and table 1.2 of this report.
Figure 1.3
International maritime trade, by region, 2020
(percentage share in total tonnage)
70
60
50
40
30
20
10
0
Asia
Americas
Europe
Oceania
Africa
Loaded
Discharged
Source: Compiled by the UNCTAD secretariat based on data supplied by reporting countries and as published on the relevant
government and port industry websites and by specialist sources.
5
2. Disruption of global economy and trade followed by signs
of a multi-paced recovery
In 2020, global GDP declined by 3.5 per cent (table 1.3) - the largest downturn for 70 years. The greatest impact
was in the services sector - in particular in tourism, travel and hospitality. For maritime trade, however, the plunge
in flows was mitigated by the boost in demand from government stimulus packages. Estimated in March 2021
at around $16 trillion, and concentrated mainly in the United States, Europe and Japan, these packages helped
soften the landing. Demand has further revived with the lifting of some COVID-19-related restrictions.
By the third quarter of 2020, there were signs of recovery, driven by positive trends in East Asia and the
United States and the rollout of COVID-19 vaccines in many developed economies. While the manufacturing
sector was down, consumer demand rose, notably in the United States with end-year retail sales 3.4 per
cent higher than 2019 (Sand, 2021a). Unlike the downturn in the first half of 2020, however, which was
globally synchronized, the nascent recovery is proceeding along diverging tracks, as many other economies,
especially in developing regions continue to fall behind.
In 2020 the drop in GDP in developing economies, at 1.8 per cent (table 1.3), was less than the global
average of 2.9 per cent for the 2009-2021 period. This was largely due to the performance of China which
was the only country to have seen some economic growth in 2020 (2.3 per cent). China's efforts to contain
the pandemic, along with a stimulus package, provided support to industry and exports.
In 2020, output in developed economies contracted by 4.7 per cent. The drop was lower in the United States
at 3.5 per cent, as fiscal measures helped minimize the economic downturn, and steeper in the EU at 6.2 per
cent, reflecting renewed pandemic outbreaks. In the United Kingdom, the drop was steeper still at 9.9 per cent,
as a result not just of the pandemic restrictions
Table 1.3
World economic growth,
but also of Brexit which disrupted supply chains
2019-2021
as traders adjusted to new rules and procedures.
(annual percentage change)
Elsewhere, Japan's economy fell by 4.7 per cent
while India's dipped by 7.0 per cent. There was also
Region or country
2019
2020
2021a
a severe impact on GDP in Latin America and the
World
2.5
-3.5
5.3
Caribbean, down by 7.1 per cent, in Africa by 3.4
Developed countries
1.7
-4.7
4.7
per cent, in Western Asia by 2.9 per cent, and the
of which:
Russian Federation by 3.0 per cent.
United States
2.2
-3.5
5.7
For 2021, current projections for global GDP are
European Union (27)
1.6
-6.2
4.0
pointing to growth of 5.3 per cent. Progress is again
United Kingdom
1.4
-9.9
6.7
expected to be uneven, with Asia and the United
Japan
0.3
-4.7
2.4
States forging ahead. The speed and geography
Australia
1.8
-2.5
3.2
of the recovery will depend to large extent on the
Russian Federation
1.3
-3.0
3.8
vaccine rollout and on the structure, scale, and
duration of government support, as for example, in:
Developing countries
3.7
-1.8
6.2
of which:
• India - The announced support measures
Africa
2.9
-3.4
3.2
focus on road infrastructure and are
expected to boost dry bulk shipping by
East Asia
4.3
0.3
6.7
increasing demand for raw materials.
of which:
China
6.1
2.3
8.3
• Japan - The $3-trillion stimulus package,
including the funds announced at the end
South Asia
3.1
-5.6
5.8
of 2020 and focusing on green and digital
of which:
innovation, could boost container volume in
India
4.6
-7.0
7.2
intra-Asian trade.
South-East Asia
4.4
-3.9
3.5
• United States - Additional fiscal stimulus
Western Asia
1.3
-2.9
3.5
measures, including large infrastructure
Latin American and the Caribbean
-0.1
-7.1
5.5
plans will lift demand for some commodities.
of which:
• European Union - Spending from the Next
Brazil
1.4
-4.1
4.9
Generation recovery fund is due to begin
Source: UNCTAD secretariat, based table 1.1 of UNCTAD
in 2021.
Trade and Development Report 2021. From Recovery to
Resilience: The Development Dimension.
• Least developed countries
- Stimulus
Note: Calculations for country aggregates are based on
packages average only 2.1 per cent of their
world GDP at constant 2015 dollars.
GDP, i.e., one-ninth of the global average
a Forecast.
(UNDESA, 2021).
6
1. International maritime trade and port traffic
Table 1.4
Growth in the volume of world merchandise trade, 2019-2021
(annual percentage change)
Volume of exports
Volume of imports
(percentage change)
(percentage change)
2019
2020
2021a
2019
2020
2021a
World
-0.3
-5.3
14.3
-0.3
-5.5
13.3
Developed countries
-0.2
-6.7
12.5
-0.2
-5.6
12.2
of which:
Euro area
-0.1
-8.7
13.4
0.0
-8.2
11.3
United States
-0.5
-11.0
11.0
-0.4
-4.0
16.0
United Kingdom
-3.1
-14.4
-2.5
3.9
-13.5
7.7
Japan
-1.6
-7.8
17.3
0.8
-6.2
3.7
Other developed countries
2.0
-5.1
12.3
0.0
-4.5
15.3
Developing countries
-0.4
-2.3
17.5
-0.6
-5.2
15.9
of which:
China
0.4
1.3
34.3
0.0
1.7
17.1
Latin America
0.6
-4.2
9.9
-1.5
-11.2
21.0
Africa and the Middle East
-4.0
-6.8
-2.7
-0.3
-2.8
3.1
Asia (not including China)
-1.3
-3.6
19.6
-2.4
-11.6
20.2
Eastern Europe and Commonwealth of Independent States
2.0
-2.2
0.6
5.0
-5.4
8.8
Source: UNCTAD Secretariat calculations, based on CPB World Trade Monitor, July 2021. Data source and methodology are
aligned with UNCTAD, Trade and Development Report 2021.
Note: Country coverage and classification in the aggregated country groupings is not comprehensive and relies on
Ebregt (2020).
a For 2021, figures reflect percentage change between the average for the period January to May 2021 and January to
May 2020.
In 2020 taken together, world merchandise imports and exports fell by 5.4 per cent (table 1.4), This
decline was far lower than more pessimistic forecasts at the height of the pandemic (UNCTAD, 2020a).
In April 2020, the World Trade Organization (WTO) had expected world merchandise trade to drop by
between 13 and 32 per cent in 2020 (WTO, 2020). There was indeed a slump in the second quarter
of 2020 but trade volumes bounced back in the third quarter, responding to the easing of restrictions
and lockdowns and announcements of new vaccines. Along with vaccine rollout in major developed
regions, the rapid return in volumes reflected the resilience of East Asian trade and the boost in consumer
demand from fiscal spending in the United States. Trade in services however remained subdued across
all economies. Tourism and cruise shipping were hit hard, though there was a growth in cross-border
services that were increasingly enabled by digital technologies.
Exports and imports fell in almost all regions - though to different extents. As shown in table 1.4, between 2019
and 2020 developed country regions saw a drop in exports of 6.7 per cent and in imports of 5.6 per cent.
The United Kingdom recorded a double-digit drop in exports, as did the United States though here the
implementation of the Phase One trade agreement boosted some exports to China (Sand, 2020a). Trade
also declined in the euro area and Japan albeit at relatively lower rates while trade involving other developed
regions fared relatively better with exports falling by only 5.1 per cent and imports by 4.5 per cent.
Developing regions also recorded a drop in merchandise trade volumes although at more moderate rates:
exports fell by 2.3 per cent while imports dropped by 5.2 per cent. The one exception was China where,
despite the disruption, exports rose by 1.3 per cent and imports by 1.7 per cent. For Asia, excluding
China, however, exports declined by 3.6 per cent while imports dropped by 11.6 per cent. In Latin America
imports dropped by 11.2 per cent and exports by 4.2 per cent. In Africa and the Middle East exports
fell by 6.8 per cent and imports by 2.8 per cent. In Eastern Europe and Commonwealth of Independent
States, the decline in imports was less at 2.2 per cent, though imports fell by 5.4 per cent.
2021 saw a revival in world merchandise trade. During the first five months of the year exports
were 14.3 per cent higher than in the corresponding period in the previous year, while imports rose
by 13.3 per cent (table 1.4). But the recovery was uneven with exports from Africa and the Middle
East as well as from the United Kingdom continuing their decline. In the United States imports jumped
7
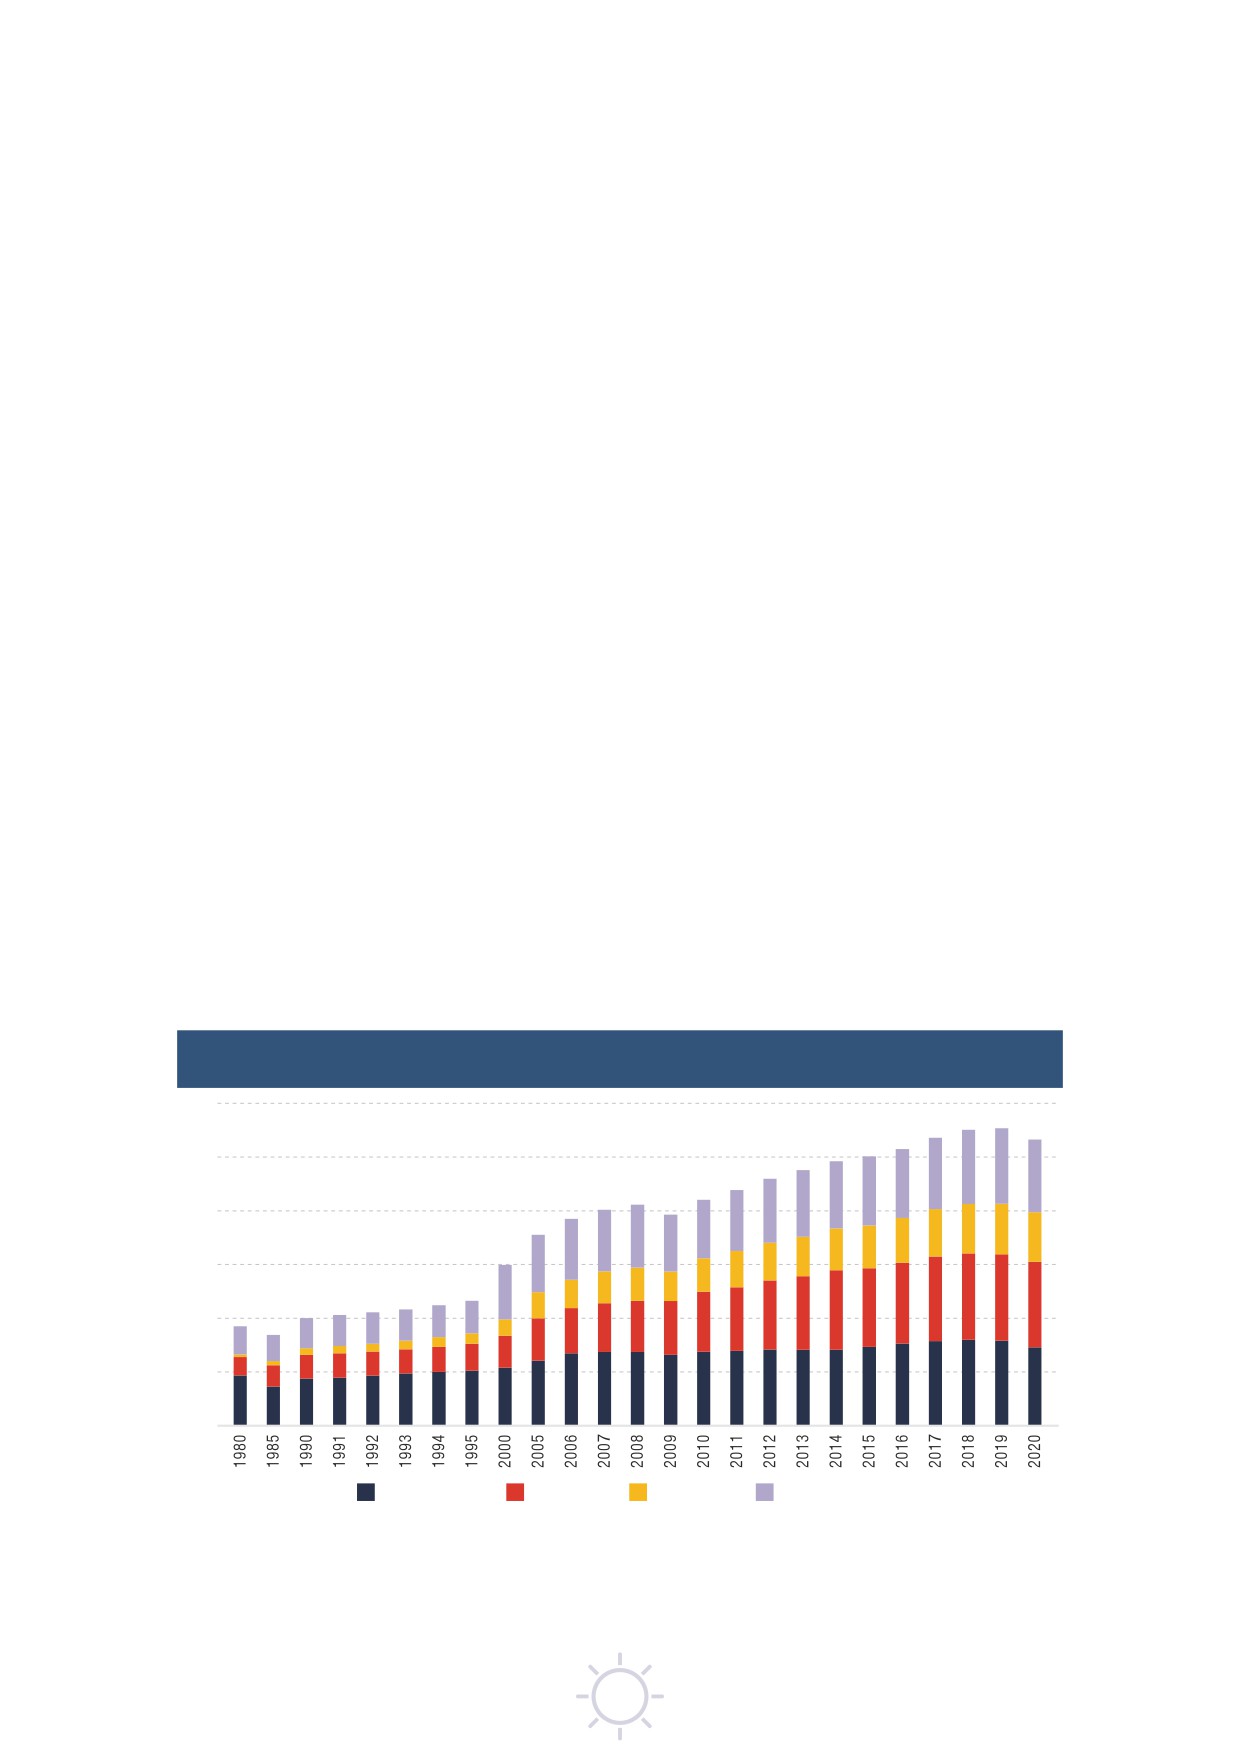
by 16.0 per cent, reflecting inventory building and the lasting benefits of fiscal support measures. During
the same period, imports increased into the euro area by 11.3 per cent, the United Kingdom by 7.7 per
cent and Japan by 3.7 per cent. Imports into developing countries increased by 15.9 per cent and into
Eastern Europe and Commonwealth of Independent States by 8.8 per cent.
Much of global import demand in the first half of 2021 was met from Asia, in particular from China whose
exports expanded by 34.3 per cent. There was also stronger import growth in Latin America, of 21.0 per
cent. Recovery in Africa and the Middle East was more moderate for both exports and imports. For the
full year 2021, the WTO expects world merchandise trade volume to grow by 8.0 per cent though the
recovery will be uneven (WTO, 2021).
This bounce-back in merchandise trade in almost all major economies has been faster than in previous
recessions - in 2009 and 2015 - though it has been from a low base and has been more robust in
goods than services (UNCTAD, 2021). The rebound was evident across a wide range of sectors including
pharmaceuticals, communications and office equipment, as well as minerals and agri-food. Much of this
has been due to the release of pent-up demand for durable goods such as cars, as well as strong demand
for products that support working from home. In contrast, recovery in the energy sector remains hesitant.
3. Maritime trade fell in 2020 but fared better than initially feared
The sudden dip and subsequent recovery in merchandise trade was reflected in the patterns of maritime
trade. In 2020, the outcome was better than initially feared. Volumes dipped by around 12 per cent in
May 2020 compared with May 2019, but only by around 2.0 per cent in the fourth quarter compared with
the same quarter in 2019 (Clarksons Research, 2021b). For 2020, following a contraction of 3.8 cent,
UNCTAD estimates shipping volumes to have lost 422 million tons.
The performance varied by market segment, with some sectors performing better than others (table 1.1,
table 1.2, figure 1.4). Worst hit was tanker shipping, but there was less impact on containerized trade, gas
shipments, and on dry bulk commodities such as iron ore and grains.
The second half of 2020 saw a nascent recovery - though asymmetric across market segments. There was
a return in volumes for containerized and dry bulk commodities, but tanker shipping awaited a full recovery
in global demand. At the same time, the sudden boost in demand stumbled into shortages - of shipping
capacity, and of containers, and equipment. As result, freight rates surged, with proliferating surcharges.
This may have bolstered shipping profitability but it put supply chains under strain, while adding to port
congestion and increasing delays and dwell times, and leading to a general decline in service reliability.
Figure 1.4
International maritime trade by cargo type, selected years
(millions of tons loaded)
12
10
8
6
4
2
0
Tanker tradea
Main bulk
Container
Other dry cargo
Source: UNCTAD Review of Maritime Transport, various issues. For 2006-2020, the breakdown by cargo type is based on
Clarksons Research, Shipping Review and Outlook, Spring 2021 and Seaborne Trade Monitor, various issues.
Note: Given methodological differences, containerized trade data in tons sourced from Clarksons Research are not
comparable with data in TEUs featured in tables 1.8 and 1.9 and figures 1.8 and 1.9 of this report and which are sourced
from MDS Transmodal.
a Tanker trade includes crude oil, refined petroleum products, gas, and chemicals.
8
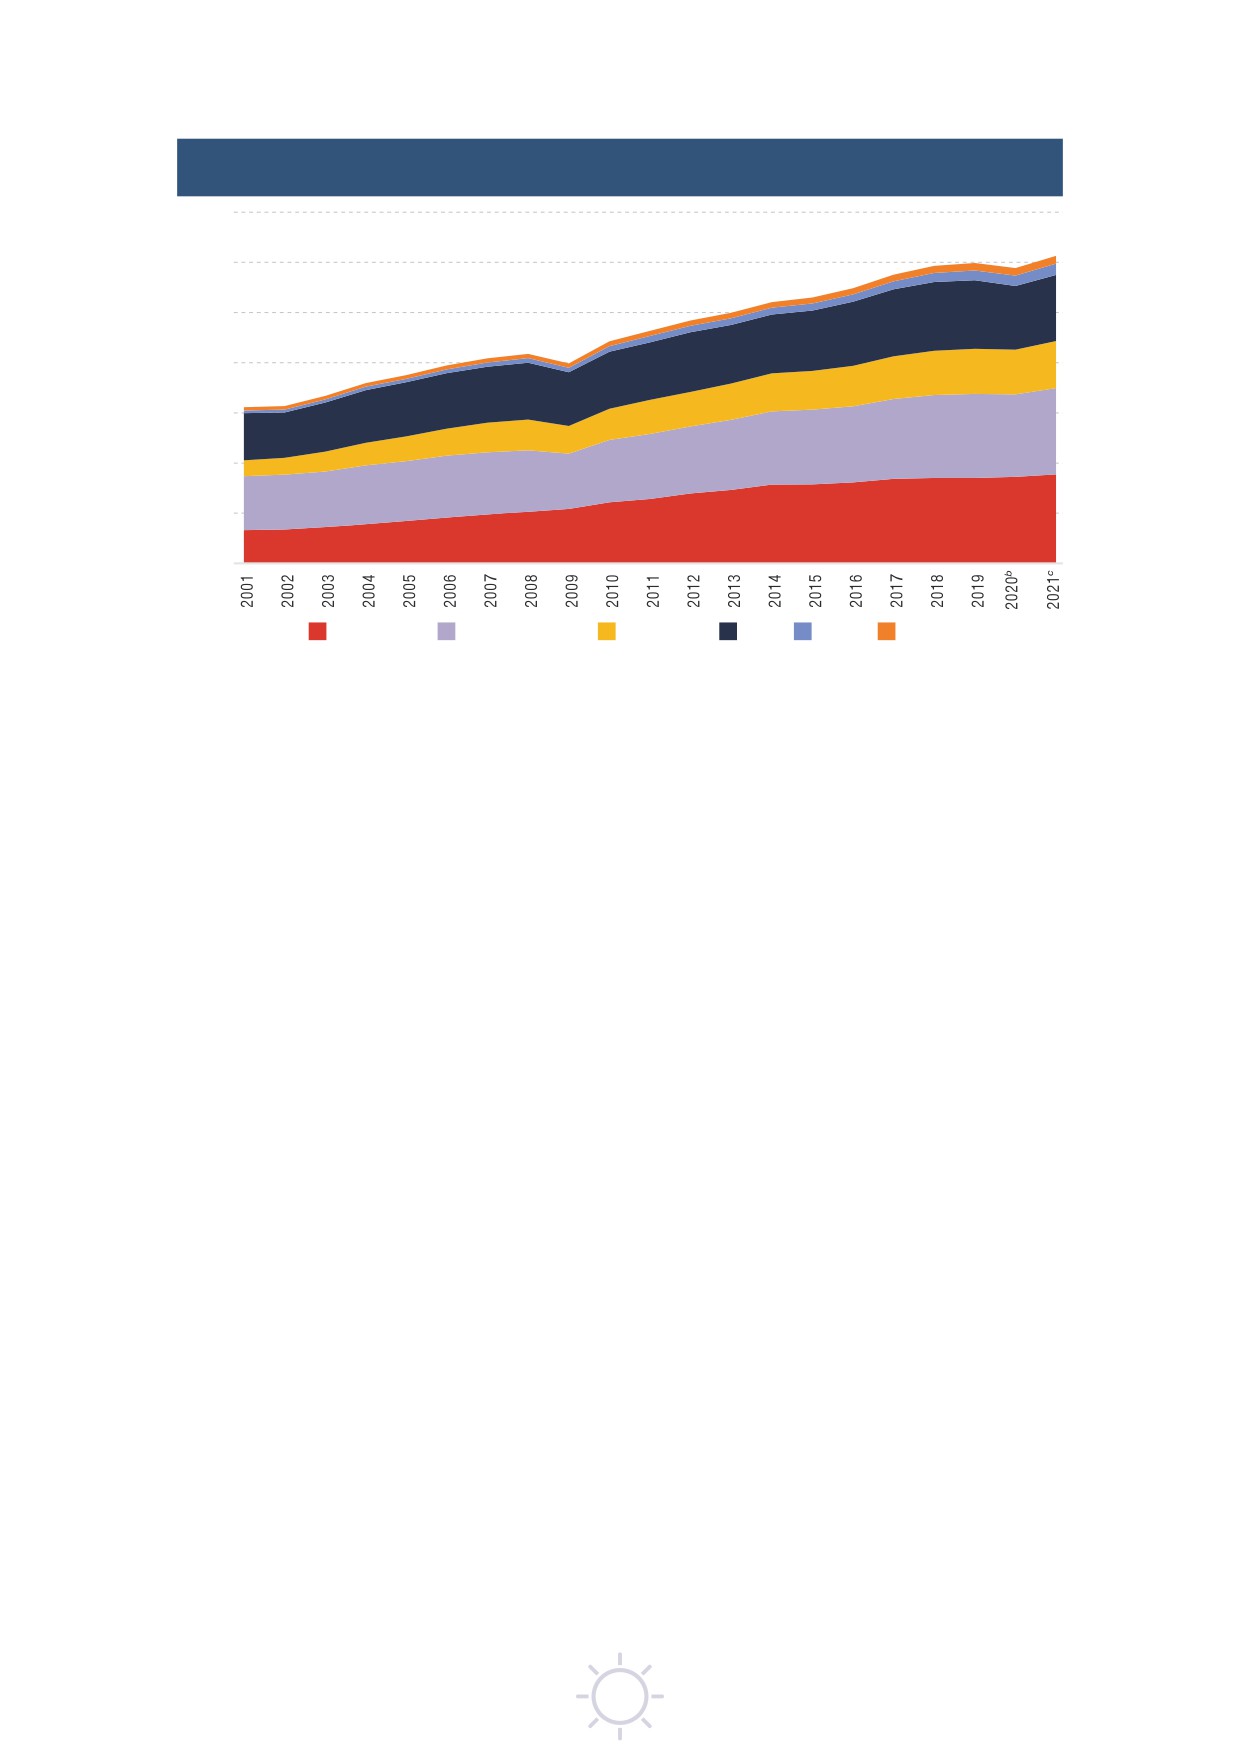
1. International maritime trade and port traffic
Figure 1.5
International maritime trade in cargo ton-miles, 2001-2021
(billions of ton-miles)
70 000
60 000
50 000
40 000
30 000
20 000
10 000
0
Main bulka
Other dry cargo
Container
Oil
Gas
Chemicals
Source: UNCTAD secretariat based on data from Clarksons Research. Shipping Review and Outlook, Spring 2021.
a Includes iron ore, grain, coal, bauxite/alumina, and phosphate.
b Estimated.
c Forecast.
The pandemic has proved to be an asynchronous, multi-wave event, as COVID-19 outbreaks lead to
sequences of lockdowns and various restrictions. In 2020 these disruptions were exacerbated by other
events such as the closure in China of the port of Yantian, which is a critical international container
terminal, and the week-long blockage of the Suez Canal, with further problems in 2021 as a result of
extreme weather events. For some of the major industries in Europe, these bottlenecks are causing
shortages of inputs and delays in delivery, and generally holding up the recovery. Automotive plants, for
example, had to close temporarily due to missing critical components and parts (Ewing and Clark, 2021).
This confluence of factors exposed the vulnerabilities of supply chains and of their underlying maritime
transport systems. They have also amplified the call for nearshoring and reduced the attractiveness of
long-haul trade and extended supply chains.
When adjusted for distance travelled, however, the decline in maritime trade in 2020 was lower - falling
by only 1.7 per cent, to an estimated 58,865 billion cargo ton-miles (figure 1.5). But there were different
outcomes for different types of cargo: oil decreased by 7.0 per cent and containerized trade by 1.5 per
cent, while there was an increase of 1.3 per cent in dry bulk trades (iron ore, coal, and grain) and of 6.7 per
cent in gas shipments, including liquified petroleum gas (LPG) and liquified natural gas (LNG) (Clarksons
Research, 2021a).
International maritime trade flows were sustained in 2020 by the rapid economic rebound in China with a
9 per cent increase in maritime import demand, in particular imports of iron ore and grain. Maritime trade
flows were also supported by China’s exports of containerized goods to the United States. Meanwhile,
lower demand for oil, and cuts by major OPEC+ oil producers and oil production, have continued to keep
a lid on the recovery in tanker shipping.
Most ton-miles and tons generated by bulkers of over 100,000 dwt were contributed by shipments from
Australia, followed by Brazil. In 2020, Australia generated 58 per cent of world iron ore exports and Brazil
23 per cent (figure 1.6). Much of this is destined for China. In 2020, China accounted for 76 per cent of
world iron ore imports and 20 per cent of coal imports. Tonnage on the Australia-China route, however,
declined in 2020, probably as result of the pandemic and the tensions between the two countries. China
is seeking to diversify its sources of supply and is looking more to Africa. Trade in ton-miles generated
by bulkers on the Africa-China route increased in 2020, probably reflecting increased iron ore shipments
from South Africa. Guinea could also be a supplier since it is reported to hold large reserves of untapped
high-quality iron ore. Guinea is expected to start shipping iron ore beginning in 2026, which will boost
demand for dry bulk shipping (Hellenic Shipping News, 2020). The country is already the world’s top
supplier of bauxite, much of which is shipped to China.
9
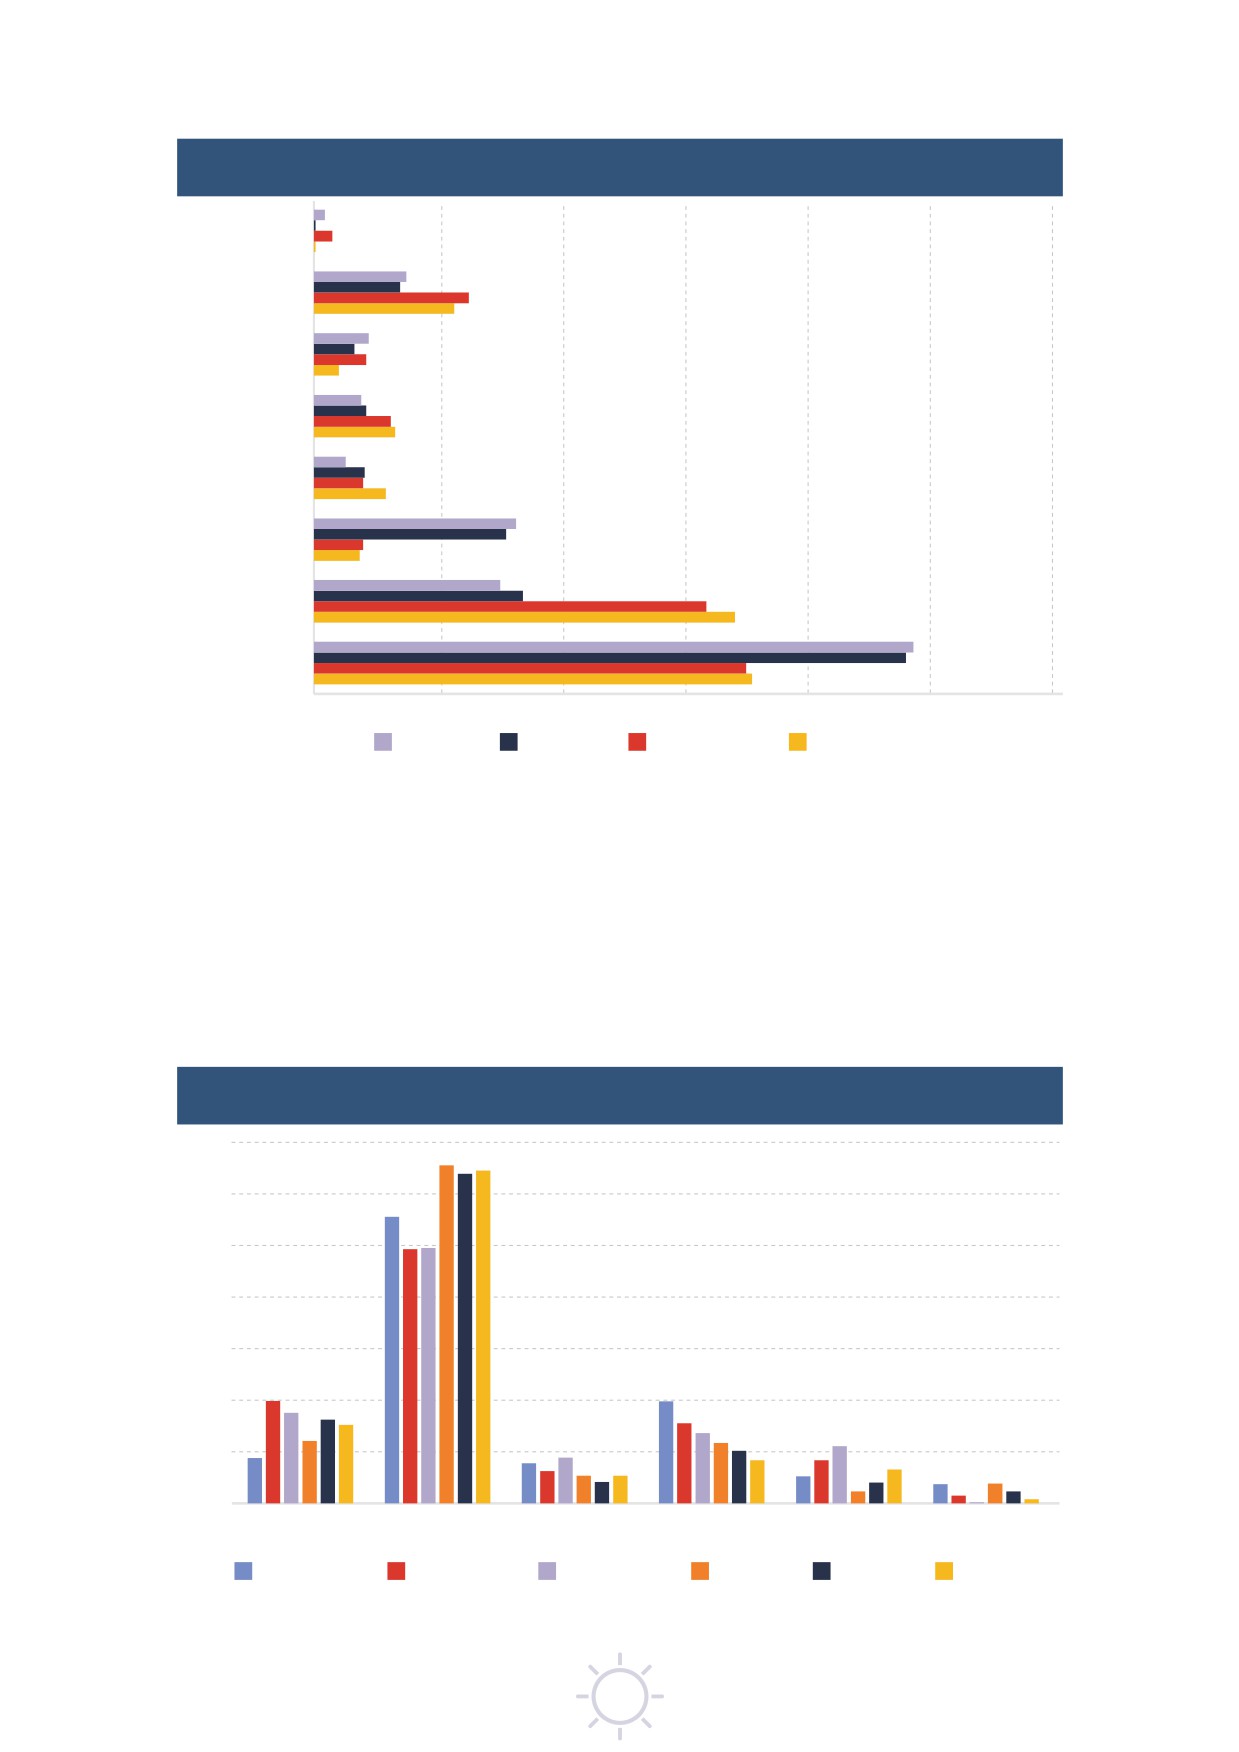
Figure 1.6
World capesize dry bulk trade by exporting region in tons
and ton-miles, 2019-2020 (percentage share)
Other
Africa
Europe
North America
Latin America
and the Carribean
(excluding Brazil)
Asia
Brazil
Australia
0
10
20
30
40
50
60
Ton 2020
Ton 2019
Ton-mile 2020
Ton-mile 2019
Source: UNCTAD based on VesselsValue data 2021.
Note: Based on dry bulk vessels of more than 100,000 dwt.
Crude oil exports continue to be dominated by Western Asia (figure 1.7). Much of the world's import
demand is from Asia, mainly China and India, followed by Japan and the Republic of Korea. Ton-mile
increase generated by North American exports in 2020 reflects the strong import demand in China and
growth in exports from the United States captured under Phase One of the trade deal with China. At the
underlying level, the shale boom is also a key driver of North American oil exports, with the United States
becoming a net seaborne energy exporter.
Figure 1.7
World ultra-large tanker trade by exporting region in ton
and ton-miles , 2018-2020 (percentage share)
70
60
50
40
30
20
10
0
Africa
Asia
Europe
Latin America
North America
Unknown
and the Caribbean
Ton-mile 2018
Ton-mile 2019
Ton-mile 2020
Ton 2018
Ton 2019
Ton 2020
Source: UNCTAD based on VesselsValue data, 2021.
Note: Tanker vessels of more than 320,000 dwt.
10
1. International maritime trade and port traffic
4. Diverging impacts and recoveries for key shipping markets
Oil trade still under pressure and gas trade down
The shipping market hardest hit by the pandemic has been the oil trade. Between 2019 and 2020 UNCTAD
estimates that tanker trade, including crude oil, refined petroleum products, and gas, slipped by 7.7 per
cent, with volumes down from 3.2 billion to 2.9 billion tons (table 1.5).
The steepest drop was for seaborne crude oil at 7.8 per cent, as total volumes fell to 1.7 billion tons.
Crude oil imports declined in most key importing markets including the United States, Europe, India,
Japan, and the Republic of Korea. The only increase was in China, by 8 per cent.
The demand for crude oil in 2020 reflects a reduction in demand for fuel - Jet A for aircraft, gasoline for
automobiles, and diesel for trucks - with volumes declining by over 10 per cent (Clarksons Research, 2021b).
While road travel is expected to increase, long-distance aviation prospects remain uncertain, awaiting a
worldwide rollout of vaccines.
Fuel imports to West Coast Latin America from the United States have fallen, partly because of limited
refinery capacity in the United States, opening up an opportunity for suppliers from Asia. Increased diesel
and gasoline shipments from Asia to West Coast Latin America will benefit ton-mile growth (Connelly, 2021).
The tanker trade has suffered from weak oil demand, high inventories, and cuts in oil supply by OPEC+
members. That said, 2021 should see an improvement as demand gradually recovers and supply increases.
Starting in August 2021, as oil prices hit their highest levels in more than two years, OPEC+ members agreed
to phase out 5.8 million barrels per day of production cuts (OPEC, 2021). Meanwhile, a lifting of the United
States sanctions would increase exports from the Islamic Republic of Iran, which could displace production
from other locations but nevertheless increase the demand for tankers. With an increase in OPEC production
and the expansion of Asian refineries, there is likely to be more demand for very large crude carriers.
India’s recent decision to diversify crude oil imports and reduce its dependency on Western Asia is
also good news for operators of crude-oil tankers and will boost demand in terms of ton-miles (Drewry
Maritime Research, 2021a). Ongoing repositioning of refinery capacity closer to demand is likely to alter
trade patterns, which could boost crude ton-miles but is more likely to reduce product tanker ton-miles.
In the longer term, tanker demand will be affected by the current global energy transition, which implies a
change in the energy mix. Elsewhere, as more refineries in some advanced economies close, changes to
oil trade patterns are likely to intensify (Danish Shipping Finance, 2021). A reduction in the United States
exports due to the low oil price environment may reduce long-haul trades. Suezmaxes may regain some
business due to the potential expansion of Western Asian crude oil production destined for India and South
East Asia (Danish Shipping Finance, 2020). Oil product trade flows could become more regionalised,
lowering seaborne volumes and travel distances (Danish Shipping Finance, 2020). Ongoing repositioning
of refinery capacity closer to demand is likely to alter trade patterns, which could boost crude ton-miles
but would more likely reduce product tanker ton-miles. The pandemic has also weighed, if to a lesser
extent, on the global demand for gas. In 2020, global gas trade increased only marginally, by 0.4 per
cent, while volumes of LNG exports are estimated to have expanded by 1.1 per cent and of LPG to have
declined by 1.0 per cent. Gas projects have been
delayed by weak energy prices, including work
Table 1.5
Tankera trade, 2019-2020
on LNG export terminals in the United States and
(million tons and percentage
LNG feedstock projects in Australia (Clarksons
annual change)
Research,
2020). That said, exports from the
Percentage
United States rebounded in 2020, thanks to a
change
2019
2020
2019-2020
boost in consumer demand supported by a cold
winter in Asia. The United States also increased
Crude oil
1 860
1 716
-7.8%
its LPG trade, by 15 per cent.
Other tanker trade
1 303
1 202
-7.7%
of which:
Natural gas offers a lower-carbon source of
energy, so with more demands for sustainability
Gas
478
480
0.4%
and a transition to lower-carbon energy, the
Total tanker trade
3 163
2 918
-7.7%
global gas trade is set to increase. Much of the
Sources: UNCTAD secretariat, derived from UNCTAD data in
growth will be driven by Asia, with an important
table 1.2 of this report.
role for China’s new propane dehydrogenation
Note: Gas trade figures are derived from Clarksons Research,
plants. India’s trade will also expand as a result of
Seaborne Trade Monitor, Volume 8, No.6, June 2021.
subsidized domestic LPG prices.
a Includes: refined petroleum products, gas, and chemicals.
11
Natural gas is set to contribute a larger share to the global energy mix in the coming years, with much of
the growth driven by shale-gas production in the United States, as well as by production in Western Asia
and in other regions including the Mediterranean and East Africa (Clarksons Research, 2020).
Dry bulk commodity trade defied pressure in 2020 with China keeping
the trade flowing1
Total dry bulk trade fell by an estimated 1.5 per cent in 2020, as volumes slipped to 5.2 billion tons
(table 1.6). China's rapid economic recovery has boosted its import demand so it could take up extra
cargo generated by suppressed demand in other regions. Iron ore trade remained unperturbed as
shipments increased by 3.2 per cent to 1.5 billion tons. Grain trade also held firm, increasing volumes by
7.1 per cent. Supporting factors included a record Brazilian harvest, the returning United States-China
trade, and better prospects in pig farming in China following the recovery from the 2018 African swine
fever outbreak. In 2021, seaborne dry bulk trade is projected to expand by 3.7 per cent, with iron ore and
grain trade growing steadily, a rebound in minor bulk volumes and more coal trade.
Coal trade plunged 9.3 per cent in 2020, partly as a result of the pandemic, with reduced electricity
demand across regions overlaid on the ongoing structural shift towards cleaner energy sources. Minor
bulk trade also came under pressure, though only falling by 2.2. per cent. There was also less trade in
forest products, as well as lower nickel ore exports due to Indonesia's export ban. The bauxite trade was
much stronger, expanding by 8.2 per cent, with China accounting for 77 per cent, and Guinea providing
46 per cent of the supply (Clarksons Research, 2021b).
The current major players in the dry bulk trade are featured in table 1.7. These patterns are likely to
change as a result of tensions between China and Australia which are affecting coal and iron ore trade.
To compensate for the ban on Australian cargo China has cut import duties on coal by land from
Mongolia. This would reduce trade by ship, though the impact could be mitigated by increases on the
Indonesia-China route (Drewry Maritime Research, 2021b). Meanwhile, a shift in Australia's exports away
from China to more distant locations such as Saudi Arabia will increase shipping demand and ton-miles
(Drewry Maritime Research, 2021c).
Recovering from the pandemic on the ‘build back better’ principle will require greener and smarter solutions
and a shift towards cleaner and lower-carbon energy sources. In the longer term this will undermine
demand for dry bulk carriers (Danish Shipping Finance, 2020). Equally, as the Chinese economy becomes
less steel intensive, its demand for iron ore will
flatten. The loss of seaborne trade could, however,
Table 1.6
Dry bulk trade 2019-2020
be partially offset by a growth in trade in the non-
(million tons and
ferrous metals that are essential for producing
percentage change)
renewable technologies
- such as nickel ore,
Percentage
copper, lithium, cobalt, and bauxite - though these
change
commodities are mostly traded in smaller volumes
2019
2020
2019-2020
(Danish Shipping Finance, 2021).
Main bulka
3 218.0
3 181.0
-1.1%
Trade tensions between China and the United
of which:
States have affected trade in grain. In 2017, the
Iron ore
1 456.0
1 503.0
3.2%
United States accounted for 34 per cent of China's
Coal
1 284.0
1 165.0
-9.3%
seaborne grain imports. In 2019, this share fell
to 18 per cent, before recovering to 27 per cent
Grain
478.0
512.0
7.1%
in
2020, on the back of the Phase One trade
Minor bulk
2 030.0
1 986.0
-2.2%
deal commitments. China’s efforts to diversify its
of which:
suppliers have benefited Brazil whose share of the
Chinese market increased from 44 per cent in 2017
Steel products
373.0
354.0
-5.1%
to about 60 per cent in 2018 and 2019, before
Forest products
383.0
365.0
-4.7%
falling back to 48 per cent in 2020 (Zhang, 2021).
Total dry bulk
5 248.0
5 167.0
-1.5%
Other countries have also gained market share,
including Ukraine, France, the Russian Federation,
Source: UNCTAD secretariat calculations, based on
and Argentina. But China’s grain import demand
Clarksons Research,
2019d, Dry Bulk Trade Outlook,
Volume 26, No. 6, June.
also faces ‘downside risks, including a renewed
a Includes iron ore, coal
(steam and coking) and grains
outbreak of African swine fever and softer crush
(wheat, coarse grain and soybean).
margins that may dampen soybean imports.
1
Detailed figures on dry bulk commodities are derived from Clarksons Research (2021), Seaborne Trade Monitor. Volume 8.
No. 6. June.
12
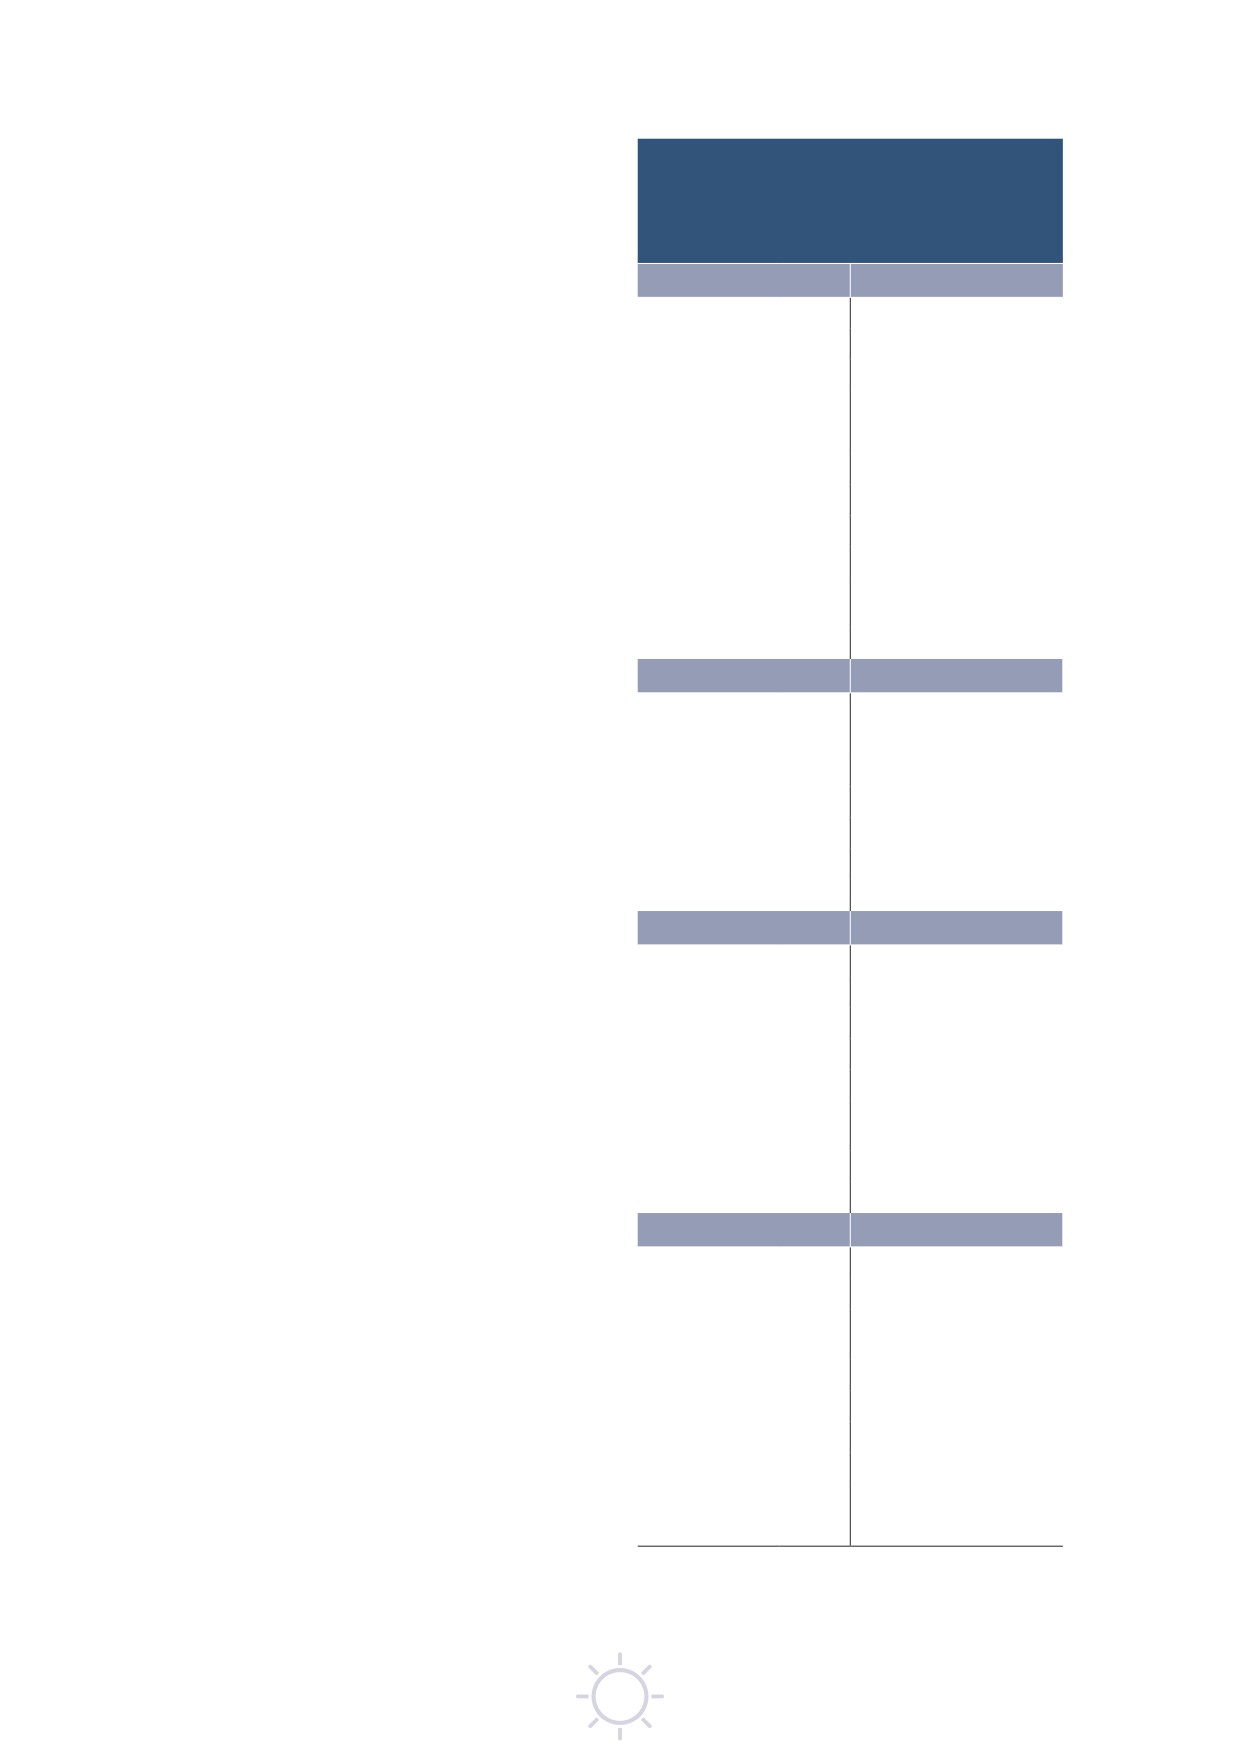
1. International maritime trade and port traffic
Government fiscal spending
Table 1.7
Major dry bulk and steel:
producers, users, exporters,
boosts consumption and helps
and importers, 2020
containerized trade weather the
(percentage share of
storm
world markets)
In 2020, full box trade fell by just 1.1 per cent
Steel producers
Steel users
to 149 million twenty-foot equivalent units (TEU)
China
56
China
56
(figure
1.8). This was a better outcome than
India
5
India
6
initially feared and quite an accomplishment
compared to the 8.4 per cent plunge in 2009
Japan
4
United States
5
following the financial crisis. After the shock in
United States
4
Japan
5
early 2020, volumes swiftly returned, as consumer
Russian Federation
4
Republic of Korea
4
demand was boosted by stimulus packages and
Republic of Korea
4
Russian Federation
4
measures to support incomes.
Turkey
2
Germany
2
The bounce-back in
2021 reflected easing
Germany
2
Turkey
2
economic impacts and the unlocking of pent-up
Brazil
2
Viet Nam
1
demand, as well as restocking and building
inventory. But there was also a shift in consumption
Islamic Republic
2
Other
15
of Iran
patterns away from services and towards goods,
notably for health products and pharmaceuticals,
Other
15
as well as home office equipment, along with
Iron ore exporters
Iron ore importers
changes in shopping patterns and the expansion
Australia
58
China
76
of ecommerce. The surge in trade was welcome
Brazil
23
Japan
7
but on such a scale that shipping services and port
South Africa
5
Europe
6
operations were often unable to keep up, resulting
in logistical bottlenecks. By the end of 2020 and
Canada
4
Republic of Korea
5
until the first half of
2021, the whole industry,
India
3
Other
6
including shipping, ports, shippers, and inland
Sweden
1
carriers struggled with shortages in containers,
Other
6
equipment and shipping capacity. This has added
to port congestion and reduced service levels and
Coal exporters
Coal importers
reliability, while also increasing freight rates and
Indonesia
35
China
20
surcharges (see chapter 3).
Australia
31
India
19
Reflecting the rebound in volumes on the
Russian Federation
13
Japan
14
eastbound leg of the East Asia-United States trade,
United States
5
Republic of Korea
10
the combined share of the East-West trade routes,
South Africa
6
European Union
6
including the Asia-Europe, the Transpacific, and
Colombia
5
Taiwan Province of
6
the Europe-North America (Transatlantic) increased
China
marginally in 2020. Together, intra-regional trade,
Canada
2
Malaysia
3
essentially reflecting Intra-Asian flows and South-
Other
3
Other
22
South trade, accounted for over 39.5 per cent of
the total. Non-mainlane East-West trade routes
Grain exporters
Grain importers
(e.g., Eastern Asia-South Asia-Western Asia) and
United States
26
East and South Asia
49
North-South routes represented
12.9 per cent
Brazil
23
Africa
14
and 8.0 per cent of the market, respectively.
Argentina
11
South and Central
10
Performance varied across regions and trade
America
lanes (table 1.8). In 2020, total volumes on the
Ukraine
10
Western Asia
9
mainlane routes decreased by only 0.3 per cent,
European Union
9
European Union
9
as the declines of 2.6 per cent on the Asia-Europe
Russian Federation
7
North America
1
trade lane and of 3.2 per cent on the Transatlantic
Canada
6
Other
8
lane were partially offset by growth of 2.8 per cent
on the Transpacific route (table 1.9). Non-mainlane
Australia
3
trade fell by 1.6 per cent, reflecting the disruption
Other
5
in India which reduced the East-West trade by 3.3
Sources: UNCTAD secretariat, based on data from the World
per cent. North-South trade fell by 1.8 per cent,
Steel Association (2021), Clarksons Research Seaborne Trade
while South-South trade contracted by 2.4 per
Monitor, Volume 8, No. 6, June 2021; Dry Bulk Trade Outlook,
cent. By early summer of 2020 the rapid recovery
Volume 27, No.6, June 2021.
13
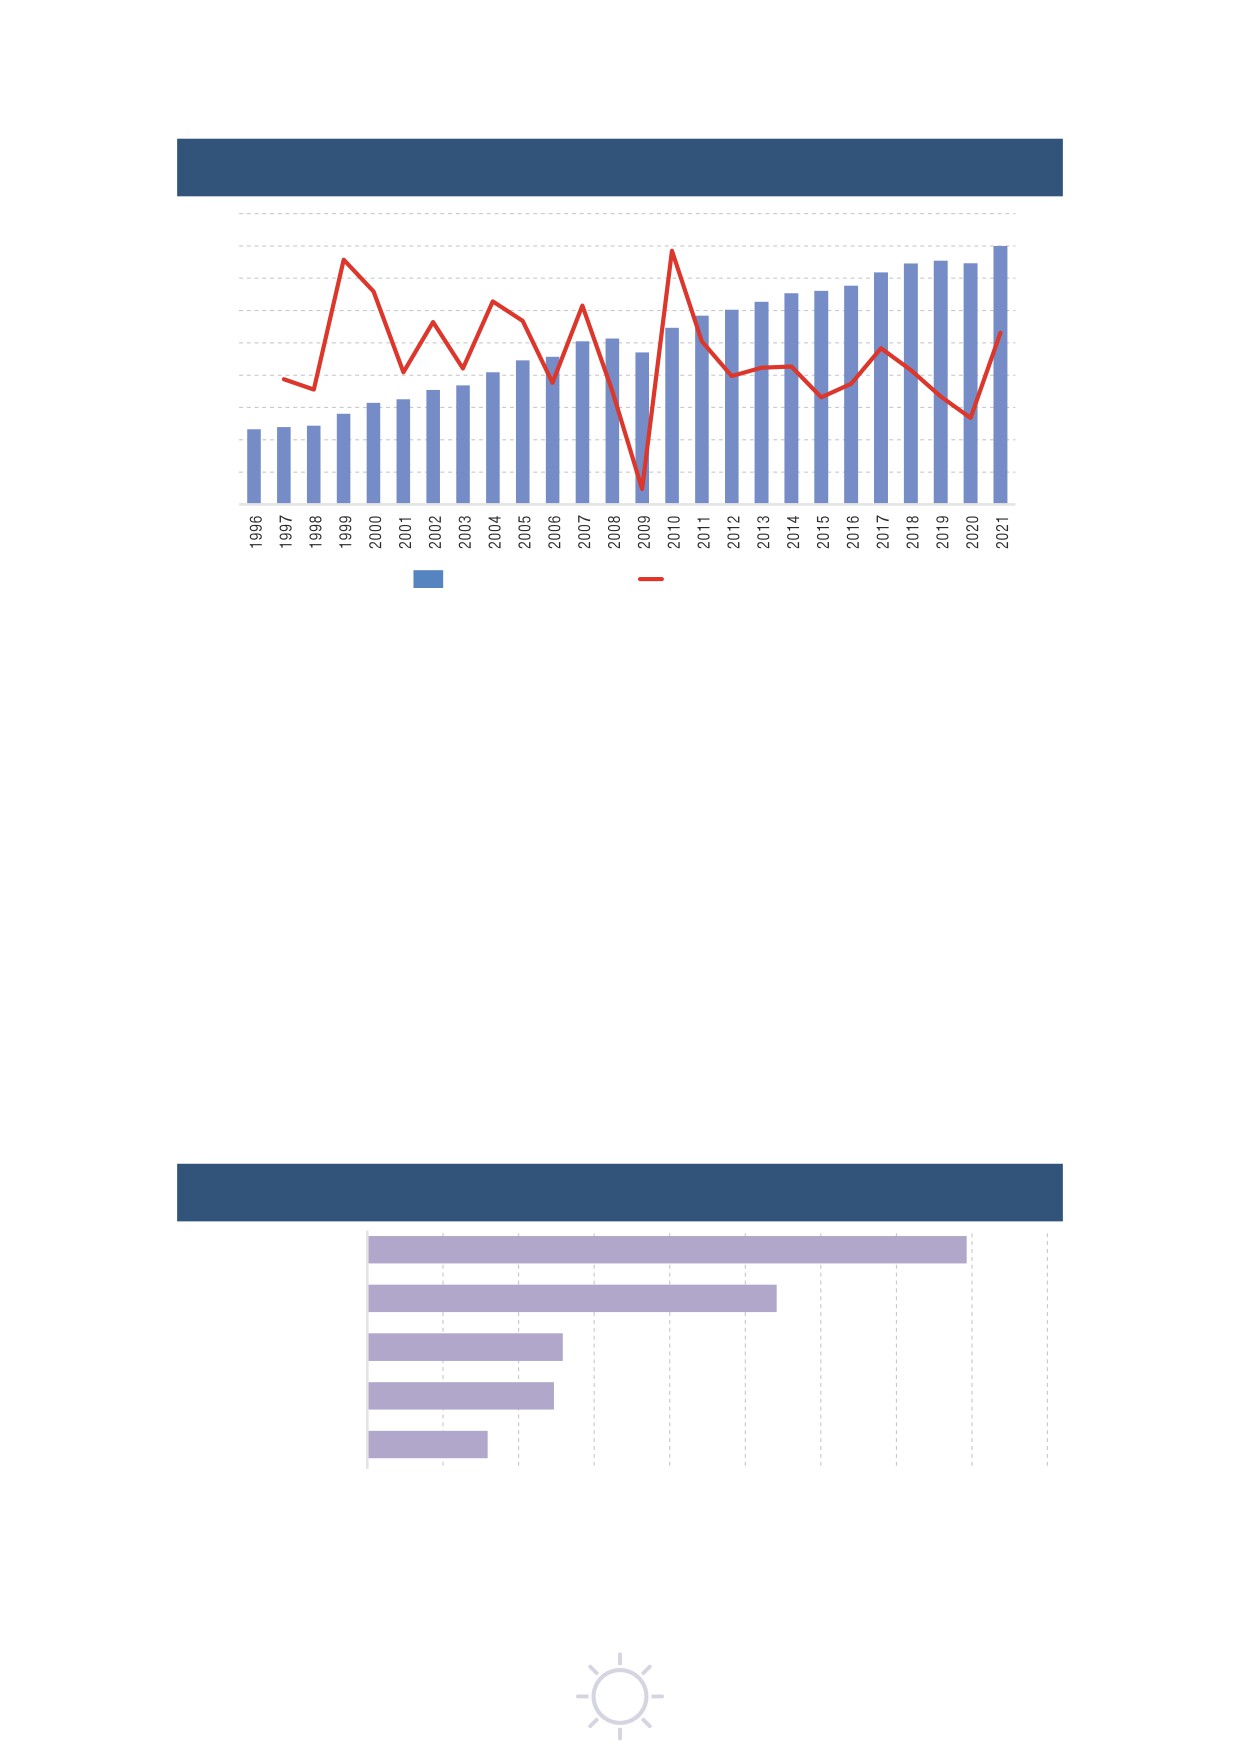
Figure 1.8
Global containerized trade, 1996-2021
(million TEU and percentage annual change)
180
20
160
15
140
120
10
100
5
80
60
0
40
-5
20
0
-10
Million TEU (left axis)
Percentage annual growth
Source: UNCTAD secretariat calculations, based on MDS Transmodal, World Cargo Database, June 2021.
Note: Projected figure for 2021 based on table 1.11 of this report.
in Asia had helped the intra-Asian trade rebound, and for the full year the decline was only 0.4 per cent
for intra-regional trade.
2020 saw an increase of 2.8 per cent on the Transpacific route, boosted by a surge in flows from East
Asia to the United States (table 1.9). Between the fourth quarter of 2019 and the first quarter of 2020,
containerized trade from Asia to North America had dropped by 13 per cent, but in the third quarter
of 2020 it jumped by 36 per cent. While container shipping imports to the United States had been rising,
exports from that country had fallen considerably. At the port of Los Angeles, for example, loaded imports
were four times greater than loaded exports - so the return legs often had empty containers, which
created shortages for exporters.
Faced with congestion and long waiting times at ports, stakeholders have looked for alternatives. In
some cases, they have accepted more costly air freight and in others have diverted ships away from the
busiest ports. In the short term, these problems are unlikely to diminish. The latest United States $1.9-trillion
stimulus package should boost consumer spending which, combined with low inventory levels, is expected
to increase imports (Sand, 2021b). In the second quarter of 2021, containerized shipments from East Asia
to North America were 35 per cent higher than in equivalent quarter in 2020 (MDS Transmodal, 2021).
Figure 1.9
Global containerized trade by route, 2020
(market shares, percentage of world total TEU)
Main East-West
39.7
Intra-regional
27.1
Non-mainlane East-West
12.9
South-South
12.4
North-South
8.0
0
5
10
15
20
25
30
35
40
45
Source: UNCTAD secretariat calculations, based on data from MDS Transmodal, World Cargo Database, June 2021.
Note: Non-mainlane East West: Trade involving Western Asia and the Indian Sub-continent, Europe, North America, and
East Asia.
North-South: Trade involving Oceania, Sub-Saharan Africa, Latin America, Europe, and North America.
South-South: Trade involving Oceania, Western Asia, East Asia, Sub-Saharan Africa and Latin America.
Intra-regional: Trade within Europe, Africa, Asia, North America, Latin America and Oceania.
14
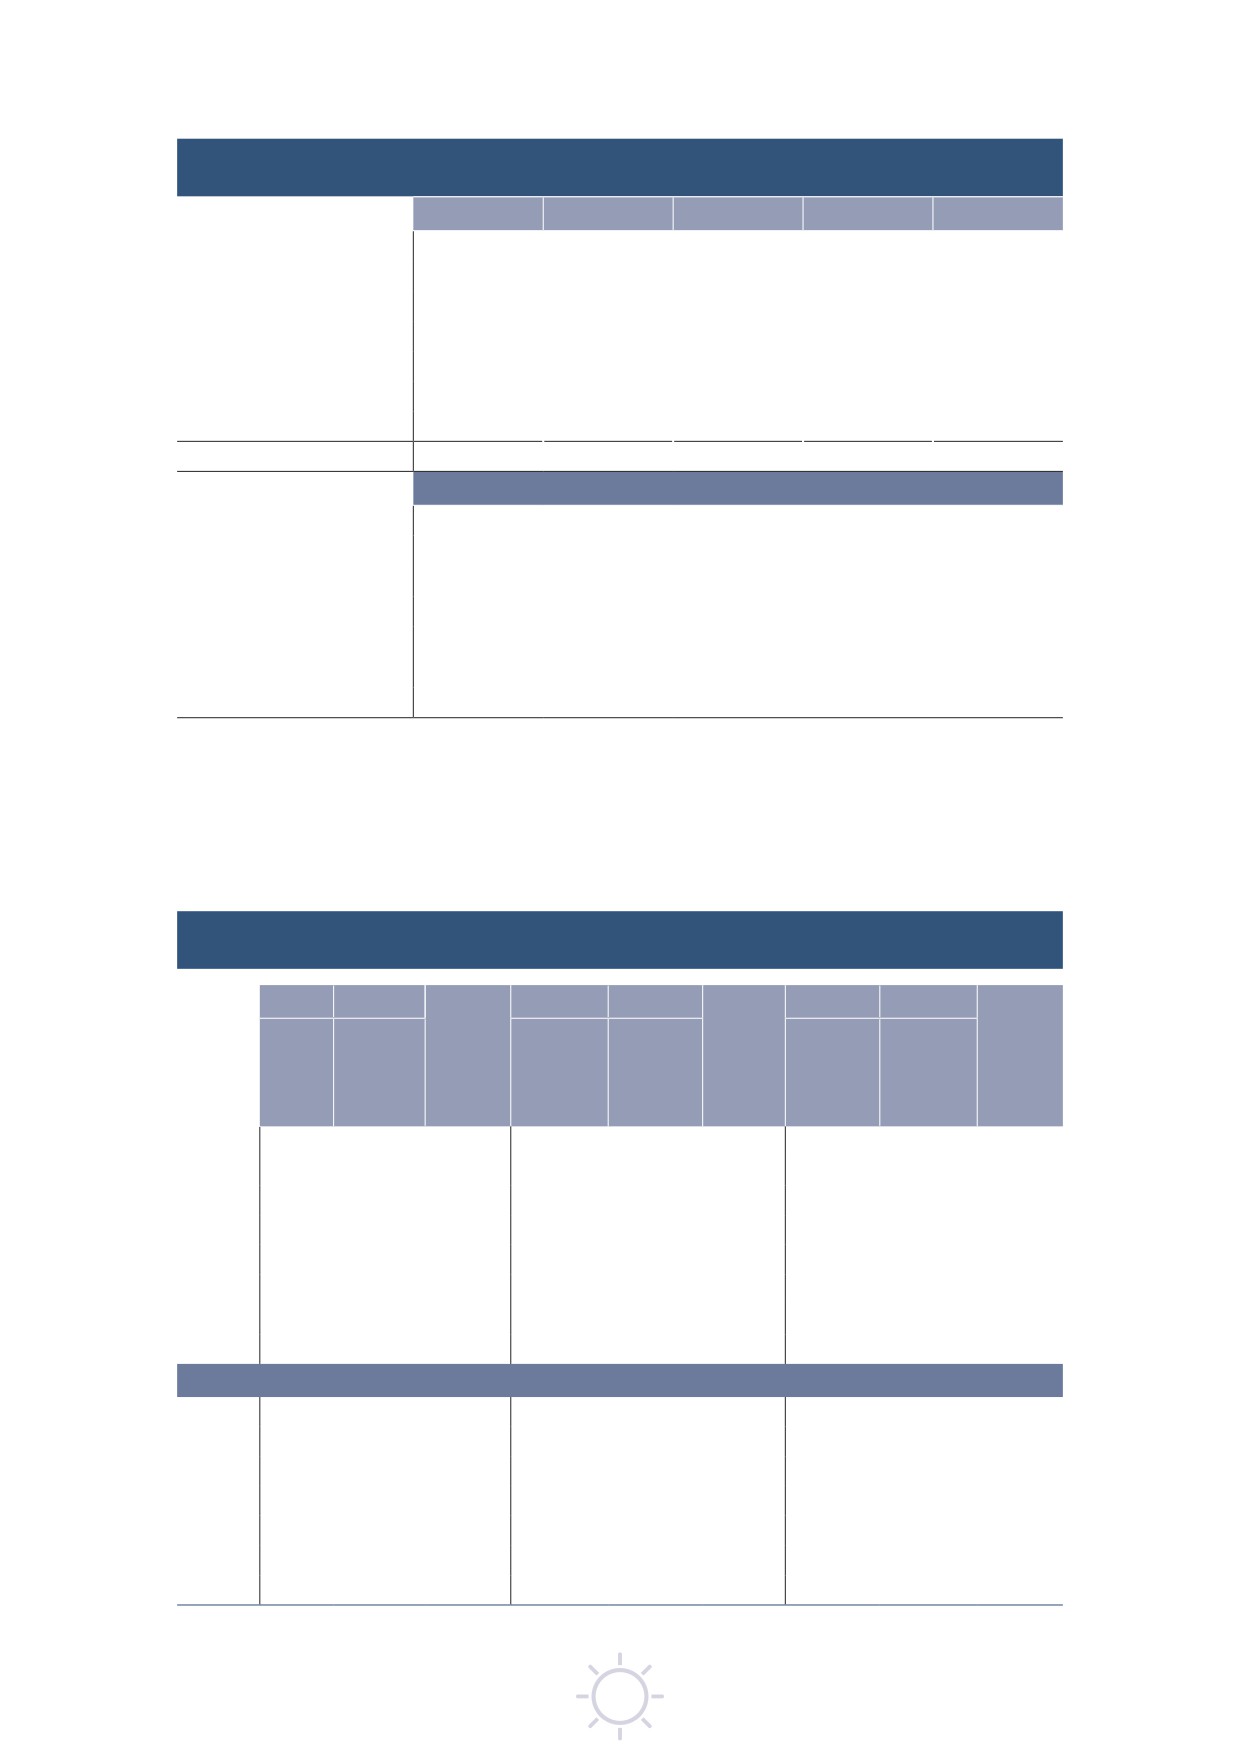
1. International maritime trade and port traffic
Table 1.8
Containerized trade on East-West trade routes, 2016-2020
(million TEU, percentage annual change)
2016
2017
2018
2019
2020
Main East-West routes
54 480 143
57 520 472
60 323 619
59 317 350
59 168 679
Other routes
80 879 086
86 095 802
88 844 890
91 538 274
90 046 704
of which
Non-mainlane East-West
18 005 252
19 056 910
19 049 879
19 960 498
19 299 089
North-South
11 120 656
11 745 000
12 086 773
2 099 662
11 882 623
South-South
15 533 787
16 920 644
18 175 418
18 892 469
18 430 527
Intra-regional
36 219 391
38 373 249
39 532 821
40 585 645
40 434 465
World total
135 359 229
143 616 274
149 168 510
150 855 623
149 215 384
Percentage change
Main East-West routes
4.03
5.6
4.9
-1.7
-0.3
Other routes (Non-mainlane)
1.40
6.5
3.2
3.0
-1.6
of which
Non-mainlane East-West
2.57
5.8
0.0
4.8
-3.3
North-South
-0.37
5.6
2.9
0.1
-1.8
South-South
-1.68
8.9
7.4
3.9
-2.4
Intra-regional
2.75
5.9
3.0
2.7
-0.4
Source: UNCTAD secretariat calculations, based on data from MDS Transmodal, World Cargo Database, June 2021.
Note: Non-mainlane East West: Trade involving Western Asia and the Indian Sub-continent, Europe, North America, and
East Asia.
North-South: Trade involving Oceania, Sub-Saharan Africa, Latin America, Europe, and North America.
South-South: Trade involving Oceania, Western Asia, East Asia, Sub-Saharan Africa and Latin America.
Intra-regional: Trade within Europe, Africa, Asia, North America, Latin America and Oceania.
Table 1.9
Containerized trade on major East-West trade routes, 2014-2021
(million TEU and percentage annual change)
Eastbound
Westbound
Eastbound
Westbound
Eastbound
Westbound
Northern
Northern
East Asia
North America
Europe and
East
North
Europe and
to Northern
to Northern
Mediterranean
Asia-North
America-East
Total
Mediterranean
Europe and
Total
Europe and
to North
America
Asia
Trans-Pacific
to East Asia
Mediterranean
Asia-Europe
Mediterranean
America
Transatlantic
2014
16.1
7.0
23.2
6.3
15.5
21.8
2.8
3.9
6.7
2015
17.4
6.9
24.2
6.4
15.0
21.3
2.7
4.1
6.8
2016
18.1
7.3
25.4
6.8
15.3
22.1
2.7
4.2
6.9
2017
19.3
7.3
26.6
7.1
16.4
23.4
2.9
4.6
7.5
2018
20.7
7.4
28.0
7.0
17.3
24.3
3.1
4.9
8.0
2019
19.9
6.8
26.7
7.2
17.5
24.8
2.9
4.9
7.8
2020
20.6
6.9
27.5
7.2
16.9
24.1
2.8
4.8
7.6
2021
24.1
7.1
31.2
7.8
18.5
26.3
2.8
5.2
8.0
Percentage annual change
2014-2015
7.5
-2.2
4.6
0.9
-3.2
-2.0
-3.1
5.1
1.7
2015-2016
4.3
6.6
5.0
6.3
2.4
3.6
0.2
3.2
2.0
2016-2017
6.6
-0.4
4.6
4.2
6.8
6.0
7.3
8.0
7.7
2017-2018
7.1
1.0
5.4
-0.9
5.7
3.7
5.3
7.6
6.7
2018-2019
-3.6
-7.4
-4.6
2.9
1.4
1.8
-4.7
-0.2
-1.9
2019-2020
3.2
1.6
2.8
-0.1
-3.7
-2.6
-4.6
-2.4
-3.2
2020-2021
17.1
2.7
13.5
8.0
9.5
9.0
1.4
9.0
6.2
Source: UNCTAD, based on MDS Transmodal, World Cargo Database, June 2021.
15
On other routes, the Asia-Europe trade declined by 2.6 per cent, reflecting reduced demand in
Europe - despite frontloading and inventory building in the United Kingdom ahead of Brexit in 2020.
And transatlantic trade fell by 3.2 per cent, depressed by reduced import demand from Europe,
although solid import demand from North America moderated to 2.4 per cent the fall on the backhaul
journey.
The crunch in container shipping in
2021 revealed many logistical problems, inefficiencies and
vulnerabilities that are threatening the sustainability of the recovery and the competitiveness of supply
chains. In May 2020, global schedule reliability had been 75 per cent, but in May 2021 it was only 39 per
cent and in that month the average delay for late vessels was six days - down from the February peak of
seven days, but still higher than that for most of 2020 (Metroshipping, 2021). At the same time, however,
freight rates and surcharges, and fees, including demurrage and detention fees, had soared, though the
latter rates were inconsistent across ports and carriers (Waters, 2021a).
These problems have been exacerbated by shipping network disruptions. In May 2021, the month-long
closure of the port of Yantian in China increased cargo bottlenecks leading to a backlog affecting the
region’s manufacturing sector and increasing the number of blank sailings causing headaches for shippers
(Port Technology International, 2021a; Waters, 2021b). Although less disruptive, the March 2021 grounding
of the 20,150-TEU containership Ever Given in the Suez Canal blocked the canal, increasing delays for
ships heading for Europe and added to a logistical disruption and port congestion. Some voyages had to
be re-routed around the Cape of Good Hope, adding up to 7,000 miles to the journey - and pushing up
freight and charter rates (Clarksons Research, 2021c).
Carriers argue that they are deploying all available capacity and that the current strain is being triggered
by large and rapid swings in demand, and the surges in trade flows. This is leading to delays in returning
containers and reducing effective capacity, making it difficult to cut delays, rates, and fees, while forcing
carriers to adjust their networks and avoid some ports. They had already been advising customers on the
Transpacific route, for example, that schedule disruptions would lead to blank sailings (Mongelluzzo, 2021a).
As for terminal operators, they blame delays at ports on carriers, noting increases in double-sailings - two
or more vessels sailing within the same week on the same service string or ordered set of ports. Large
peaks and troughs in volumes leading to operational instability have disrupted operations and increased
congestion (Waters, 2021c).
From their perspective, shippers have been looking for alternatives and solutions. Some have resorted
to higher-priced air freight, while on the Far East-Europe route they have also been attracted by rail
transport. According to Chinese customs data, rail volumes and capacity are still relatively small, but the
two-way trade value nearly trebled in the first five months of 2021 (Global Times, 2021). Meanwhile, on
the Transpacific and intra-Asian routes some commodities, such as grain and forestry goods, have seen
a temporary de-containerization with goods despatched on dry bulk ships, adding to the demand for
multipurpose ships and dry bulk carriers (Sand, 2021c).
To secure space on vessels, some shippers are seeking longer-term, multi-year, end-to-end contracts with
carriers. For their part some carriers seek to convert ‘ocean customers’ to long-term ‘end-to-end logistics
customers’. Under these arrangements, shippers have access to logistics services such as warehousing,
customs clearance, visibility, and the ability to speed up or slow down shipments (Knowler, 2021).
Examples include Maersk's aim to become a full-service, end-to-end integrator, and the focus of CMA
CGM and its CEVA Logistics division on creating integrated services (Tirschwell, 2021). In response to
increasing congestion and shrinking ocean capacity Maersk has launched the first block train intermodal
service between Europe and China (Port Technology International, 2021b).
The Global Shippers’ Forum argues that the real crunch point for shippers is the plummeting service
performance and the unpredictability of container delivery, and has renewed its call to remove the consortia
block exemption regulation (Baker, 2021a). It points to the increasing number of blank sailings - ships
skipping a port or ports, or cancelling the entire string - which reduce the number of containers that
shippers can export. This disproportionately affects lower-paying shippers since carriers favour cargo
from higher-paying customers (Waters, 2021c). In this respect, the United States Congress is drafting
legislation to strengthen the Federal Maritime Commission’s oversight of carriers' shipping practices
(Gallagher, 2021).
The Global Shippers Alliance maintains that since no carrier on its own will be able to guarantee
good connectivity and port pairs, the current supply chain crisis is unlikely to be solved by further
regulation of container shipping. Instead it calls on carriers to take more risk, building contingency into
their prices and employing new technology to make supply chain forecasts more accurate and more
16
//////////////////////