Physics For Scientists And Engineers 6E - part 147
 

  Index      Production     Physics For Scientists And Engineers 6E


Search            


Content   ..  145  146  147  148   ..


Physics For Scientists And Engineers 6E - part 147


If we extend the straight lines in Figure 19.5 toward negative temperatures, we find

a remarkable result —

in every case, the pressure is zero when the temperature is

!

273.15°C! This suggests some special role that this particular temperature must play.

It is used as the basis for the 

absolute temperature scale, which sets ! 273.15°C as its

zero point. This temperature is often referred to as 

absolute zero. The size of a de-

gree on the absolute temperature scale is chosen to be identical to the size of a degree
on the Celsius scale. Thus, the conversion between these temperatures is

(19.1)

where T

C

is the Celsius temperature and is the absolute temperature.

Because the ice and steam points are experimentally difficult to duplicate, an absolute

temperature scale based on two new fixed points was adopted in 1954 by the International
Committee on Weights and Measures. The first point is absolute zero. The second refer-
ence temperature for this new scale was chosen as the 

triple point of water, which is the

single combination of temperature and pressure at which liquid water, gaseous water, and
ice  (solid  water)  coexist  in  equilibrium.  This  triple  point  occurs  at  a  temperature  of
0.01°C  and  a  pressure  of  4.58 mm  of  mercury.  On  the  new  scale,  which  uses  the  unit
kelvin, the temperature of water at the triple point was set at 273.16 kelvins, abbreviated
273.16 K. This choice was made so that the old absolute temperature scale based on the
ice and steam points would agree closely with the new scale based on the triple point. This
new  absolute  temperature  scale  (also  called  the 

Kelvin  scale)  employs  the  SI  unit  of

absolute  temperature,  the 

kelvin,  which  is  defined  to  be  1/273.16  of  the  difference

between absolute zero and the temperature of the triple point of water.

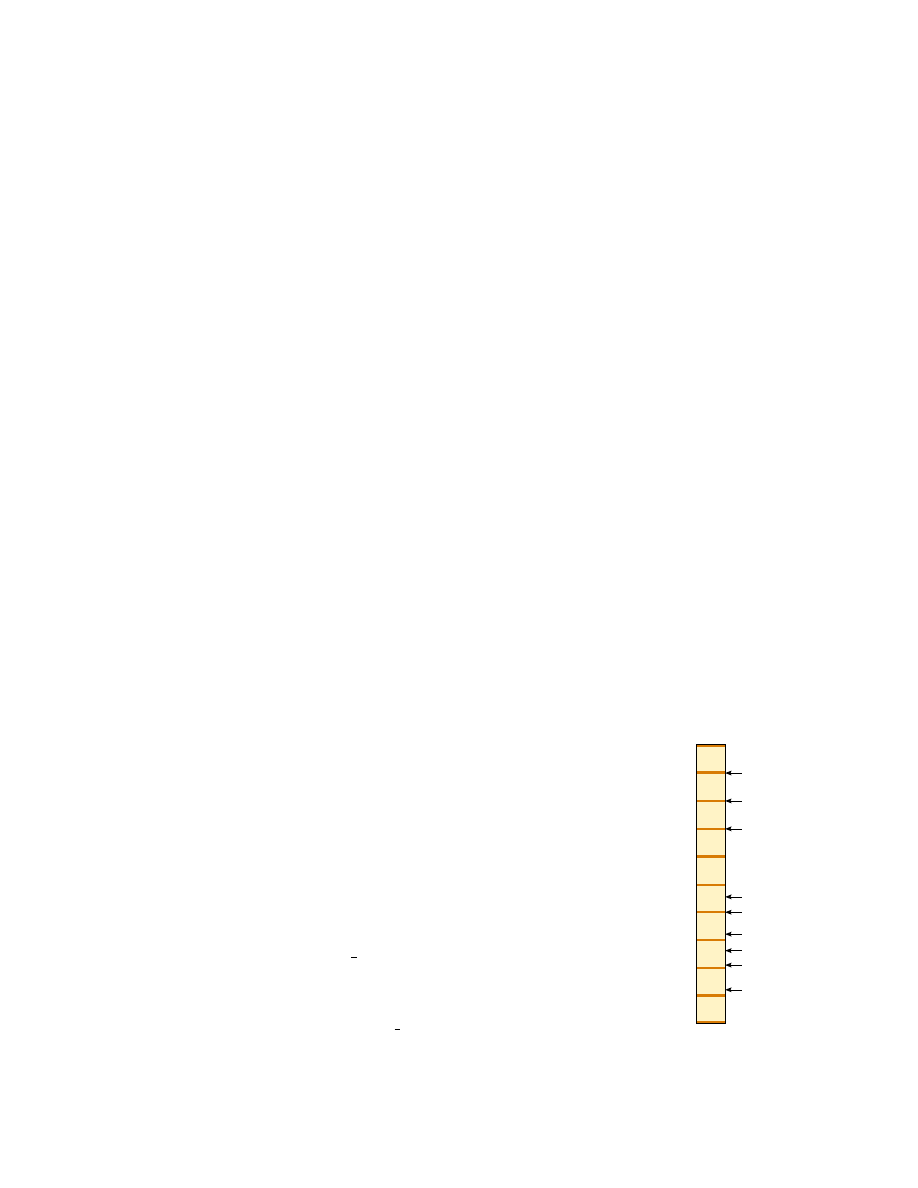
Figure  19.6  shows  the  absolute  temperature  for  various  physical  processes  and

structures. The temperature of absolute zero (0 K) cannot be achieved, although labo-
ratory experiments incorporating the laser cooling of atoms have come very close.

What  would  happen  to  a  gas  if  its  temperature  could  reach  0 K  (and  it  did  not 

liquefy or solidify)? As Figure 19.5 indicates, the pressure it exerts on the walls of its
container would be zero. In Chapter 21 we shall show that the pressure of a gas is pro-
portional  to  the  average  kinetic  energy  of  its  molecules.  Thus,  according  to  classical
physics, the kinetic energy of the gas molecules would become zero at absolute zero,
and molecular motion would cease; hence, the molecules would settle out on the bot-
tom of the container. Quantum theory modifies this prediction and shows that some
residual energy, called the zero-point energy, would remain at this low temperature.

The Celsius, Fahrenheit, and Kelvin Temperature Scales

3

Equation  19.1  shows  that  the  Celsius  temperature  T

C

is  shifted  from  the  absolute

(Kelvin) temperature by 273.15°. Because the size of a degree is the same on the two
scales, a temperature difference of 5°C is equal to a temperature difference of 5 K. The
two scales differ only in the choice of the zero point. Thus, the ice-point temperature
on the Kelvin scale, 273.15 K, corresponds to 0.00°C, and the Kelvin-scale steam point,
373.15 K, is equivalent to 100.00°C.

A common temperature scale in everyday use in the United States is the 

Fahren-

heit scale. This scale sets the temperature of the ice point at 32°F and the tempera-
ture of the steam point at 212°F. The relationship between the Celsius and Fahrenheit
temperature scales is

(19.2)

We can use Equations 19.1 and 19.2 to find a relationship between changes in tempera-
ture on the Celsius, Kelvin, and Fahrenheit scales:

(19.3)

"

T

C

# "

#

5

9


"

T

F

T

F

#

9

5

T

C

$

32%F

T

C

#

! 273.15

S E C T I O N   19 . 3 •  The Constant-Volume Gas Thermometer and the Absolute Temperature Scale

585

Hydrogen bomb

10

9

10

8

10

7

10

6

10

5

10

4

10

3

10

2

10

1

Interior of the Sun

Solar corona

Surface of the Sun
Copper melts

Water freezes

Liquid nitrogen

Liquid hydrogen

Liquid helium

Lowest temperature

achieved 

˜

10

–7

 K

Temperature (K)

Figure 19.6 Absolute tempera-

tures at which various physical

processes occur. Note that the scale

is logarithmic.

PITFALL PREVENTION

19.1 A Matter of Degree

Note  that  notations  for  temper-
atures  in  the  Kelvin  scale  do  not
use  the  degree  sign.  The  unit  for
a Kelvin  temperature  is  simply
“kelvins” and not “degrees Kelvin.”

3

Named  after  Anders  Celsius  (1701–1744),  Daniel  Gabriel  Fahrenheit  (1686–1736),  and  William

Thomson, Lord Kelvin (1824–1907), respectively.

19.4 Thermal Expansion of Solids and Liquids

Our discussion of the liquid thermometer makes use of one of the best-known changes
in  a  substance:  as  its  temperature  increases,  its  volume  increases.  This  phenomenon,
known as 

thermal expansion, has an important role in numerous engineering applica-

tions. For example, thermal-expansion joints, such as those shown in Figure 19.7, must
be included in buildings, concrete highways, railroad tracks, brick walls, and bridges to
compensate for dimensional changes that occur as the temperature changes.

Thermal  expansion  is  a  consequence  of  the  change  in  the  average separation  be-

tween the atoms in an object. To understand this, model the atoms as being connected
by stiff springs, as discussed in Section 15.3 and shown in Figure 15.12b. At ordinary
temperatures, the atoms in a solid oscillate about their equilibrium positions with an
amplitude of approximately 10

!

11

m and a frequency of approximately 10

13

Hz. The

average spacing between the atoms is about 10

!

10

m. As the temperature of the solid

586

C H A P T E R   19 •  Temperature

Quick Quiz 19.2

Consider the following pairs of materials. Which pair rep-

resents  two  materials,  one  of  which  is  twice  as  hot  as  the  other?  (a)  boiling  water  at
100°C, a glass of water at 50°C (b) boiling water at 100°C, frozen methane at ! 50°C
(c) an ice cube at ! 20°C, flames from a circus fire-eater at 233°C (d) No pair repre-
sents materials one of which is twice as hot as the other

Example 19.1 Converting Temperatures

From Equation 19.1, we find that

A convenient set of weather-related temperature equivalents
to  keep  in  mind  is  that  0°C  is  (literally)  freezing  at  32°F,
10°C  is  cool  at  50°F,  20°C  is  room  temperature,  30°C  is
warm at 86°F, and 40°C is a hot day at 104°F.

283 K

T

C

$

273.15 # 10%C $ 273.15 #

On  a  day  when  the  temperature  reaches  50°F,  what  is  the
temperature in degrees Celsius and in kelvins?

Solution Substituting into Equation 19.2, we obtain

10%C

#

T

C

#


5

9

(T

F

!

32) #

5

9

(50 ! 32)

From Equation 19.3, we also find that

99%F

"

T

F

#


9

5


"

T

C

#

9

5

(55%C) #

A  pan  of  water  is  heated  from  25°C  to  80°C.  What  is  the
change  in  its  temperature  on  the  Kelvin  scale  and  on  the
Fahrenheit scale?

Solution From  Equation  19.3,  we  see  that  the  change  in
temperature on the Celsius scale equals the change on the
Kelvin scale. Therefore,

55 K

"

# "T

C

#

80%C ! 25%C # 55%C #

Example 19.2 Heating a Pan of Water

Of  the  three  temperature  scales  that  we  have  discussed,  only  the  Kelvin  scale  is

based on a true zero value of temperature. The Celsius and Fahrenheit scales are based
on an arbitrary zero associated with one particular substance—water—on one particu-
lar planet—Earth. Thus, if you encounter an equation that calls for a temperature or
involves  a  ratio  of  temperatures,  you  must convert  all  temperatures  to  kelvins.  If  the
equation  contains  a  change  in  temperature  "T,  using  Celsius  temperatures  will  give
you the correct answer, in light of Equation 19.3, but it is always safest to convert tem-
peratures to the Kelvin scale.

increases, the atoms oscillate with greater amplitudes; as a result, the average separa-
tion between them increases.

4

Consequently, the object expands.

If thermal expansion is sufficiently small relative to an object’s initial dimensions,

the  change  in  any  dimension  is,  to  a  good  approximation,  proportional  to  the  first
power of the temperature change. Suppose that an object has an initial length L

i

along

some direction at some temperature and that the length increases by an amount "L
for  a  change  in  temperature  "T.  Because  it  is  convenient  to  consider  the  fractional
change  in  length  per  degree  of  temperature  change,  we  define  the 

average  coeffi-

cient of linear expansion as

Experiments show that & is constant for small changes in temperature. For purposes of
calculation, this equation is usually rewritten as

(19.4)

or as

(19.5)

where L

f

is the final length, T

i

and T

f

are the initial and final temperatures, and the

proportionality constant & is the average coefficient of linear expansion for a given ma-
terial and has units of (°C)

!

1

.

It may be helpful to think of thermal expansion as an effective magnification or as

a  photographic  enlargement  of  an  object.  For  example,  as  a  metal  washer  is  heated
(Fig.  19.8),  all  dimensions,  including  the  radius  of  the  hole,  increase  according  to
Equation 19.4. Notice that this is equivalent to saying that

a cavity in a piece of mate-

rial expands in the same way as if the cavity were filled with the material.

Table  19.1  lists  the  average  coefficient  of  linear  expansion  for  various  materials.

Note that for these materials & is positive, indicating an increase in length with increas-
ing temperature. This is not always the case. Some substances—calcite (CaCO

3

) is one

example—expand along one dimension (positive &) and contract along another (neg-
ative &) as their temperatures are increased.

L

f

!

L

i

#

&

L

i

(T

f

!

T

i

)

"

# &L

i


"

T

&


"

L/L

i

"

T

S E C T I O N   19 . 4 •  Thermal Expansion of Solids and Liquids

587

(a)

(b)

Figure 19.7 (a) Thermal-expansion joints are used to separate sections of roadways on

bridges. Without these joints, the surfaces would buckle due to thermal expansion on

very hot days or crack due to contraction on very cold days. (b) The long, vertical joint

is filled with a soft material that allows the wall to expand and contract as the tempera-

ture of the bricks changes.

4

More precisely, thermal expansion arises from the asymmetrical nature of the potential-energy curve

for the atoms in a solid, as shown in Figure 15.12a. If the oscillators were truly harmonic, the average
atomic separations would not change regardless of the amplitude of vibration.

PITFALL PREVENTION

19.2 Do Holes Become

Larger or Smaller?

When  an  object’s  temperature  is
raised, every linear dimension in-
creases in size. This includes any
holes  in  the  material,  which  ex-
pand  in  the  same  way  as  if  the
hole were filled with the material,
as shown in Figure 19.8. Keep in
mind  the  notion  of  thermal  ex-
pansion as being similar to a pho-
tographic enlargement.

Frank Siteman, Stock/Boston

George Semple

a

b

T 

T

b + 

b

a + 

a

T

i

T

i

Active Figure 19.8 Thermal ex-

pansion of a homogeneous metal

washer. As the washer is heated, all

dimensions increase. (The expan-

sion is exaggerated in this figure.)

At the Active Figures link

at http://www.pse6.com, you

can compare expansions for

various temperatures of the

burner and materials from

which the washer is made.

Because the linear dimensions of an object change with temperature, it follows that

surface area and volume change as well. The change in volume is proportional to the
initial volume V

i

and to the change in temperature according to the relationship

(19.6)

where ' is the 

average coefficient of volume expansion. For a solid, the average co-

efficient of volume expansion is three times the average linear expansion coefficient:
' #

3&. (This assumes that the average coefficient of linear expansion of the solid is

the same in all directions—that is, the material is isotropic.)

To see that ' # 3& for a solid, consider a solid box of dimensions !, 

w, and h. Its

volume at some temperature T

i

is V

i

#

!

wh. If the temperature changes to T

i

$ "

T, its

volume  changes  to  V

i

$ "

V,  where  each  dimension  changes  according  to  Equation

19.4. Therefore,

If we now divide both sides by V

i

and isolate the term "V/V

i

, we obtain the fractional

change in volume:

Because  &"

(( 1  for  typical  values  of  "((

" 100°C),  we  can  neglect  the  terms 

3(& "

)

2

and (& ")

3

. Upon making this approximation, we see that

Equation 19.6 shows that the right side of this expression is equal to ', and so we have
3& # ', the relationship we set out to prove. In a similar way, you can show that the
change in area of a rectangular plate is given by "# 2&A

i

"

(see Problem 55).

As Table 19.1 indicates, each substance has its own characteristic average coefficient

of  expansion.  For  example,  when  the  temperatures  of  a  brass  rod  and  a  steel  rod  of

3& #

1

V

i


"

V

"

T

"

V

V

i

 # 3& "T

"

V

V

i

#

3& "$ 3(& ")

2

$

(& ")

3

 # V

i

[1 $ 3&


"

$ 3(&


"

)

2

$

(&


"

)

3

]

 # !wh(1 $ &


"

)

3

 # (! $ &!


"

)($ &w


"

)($ &h


"

)

V

i

$ "

V # (! $ "!)($ "w)($ "h)

"

# 'V

i


"

T

588

C H A P T E R   19 •  Temperature

Average Linear  

Average Volume

Expansion 

Expansion 

Coefficient

Coefficient

Material

(")(°C)

!

1

Material

(#)(°C)

!

1

Aluminum

24 ) 10

!

6

Alcohol, ethyl

1.12 ) 10

!

4

Brass and bronze

19 ) 10

!

6

Benzene

1.24 ) 10

!

4

Copper

17 ) 10

!

6

Acetone

1.5 ) 10

!

4

Glass (ordinary)

9 ) 10

!

6

Glycerin

4.85 ) 10

!

4

Glass (Pyrex)

3.2 ) 10

!

6

Mercury

1.82 ) 10

!

4

Lead

29 ) 10

!

6

Turpentine

9.0 ) 10

!

4

Steel

11 ) 10

!

6

Gasoline

9.6 ) 10

!

4

Invar (Ni–Fe alloy)

0.9 ) 10

!

6

Air

a

at 0°C

3.67 ) 10

!

3

Concrete

12 ) 10

!

6

Helium

a

3.665 ) 10

!

3

Average Expansion Coefficients for Some Materials Near Room Temperature

Table 19.1

a

Gases do not have a specific value for the volume expansion coefficient because the amount of expan-
sion depends on the type of process through which the gas is taken. The values given here assume that
the gas undergoes an expansion at constant pressure.


Content   ..  145  146  147  148   ..