Mitsubishi Montero (1998+). Manual - part 362


  Index      Mitsubishi     Mitsubishi Montero - service repair manual 1998 year


Search            


Content   ..  360  361  362  363   ..


Mitsubishi Montero (1998+). Manual - part 362


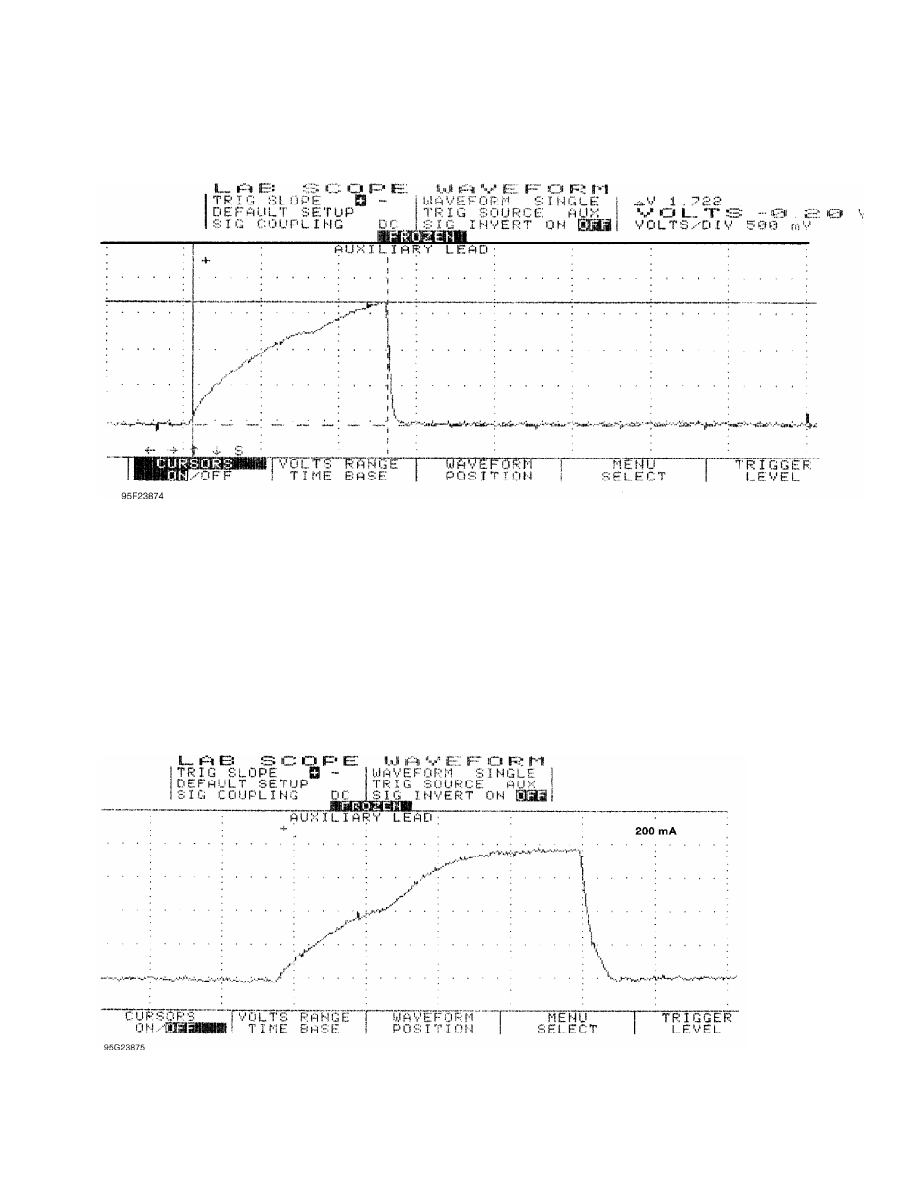
Fig. 9:  Injector Even Bank w/Normal Current Flow - Current Pattern

         EXAMPLE #3 - VOLTAGE CONTROLLED DRIVER

         Example #3 is of a Ford 5.0L V8 SEFI.  Fig. 10 shows a

waveform of an individual injector at idle with the Lab Scope set on

200 milliamps per division. Notice the dimple in the rising edge. This

dimple indicates the actual opening of the injector (set point)

occurred at 400 milliamps and current peaked at 750 milliamps. This is

a good specification for this engine.

         The next waveform pattern in Fig. 11 shows an abnormality

with another injector. With the Lab Scope set on 500 milliamps per

division, you can see that the current waveform indicates a 1200

milliamp draw. This is a faulty injector.

         Abnormally low resistance injectors create excessive current

draw, causing rough idle, and possible computer driver damage.

Fig. 10:  Single Injector w/Normal Current Flow - Current Pattern

Fig. 11:  Single Injector w/Excessive Current Flow - Current Pattern

         EXAMPLE #4 - CURRENT CONTROLLED DRIVER

         Example #4 is of a Ford 4.6L SEFI VIN [W]. See  Fig. 12 for

the known-good waveform pattern. This Ford system is different from

the one above in EXAMPLE #3 as it peaks at 900 milliamps and the

actual opening of the injector (set point) is just below 600

milliamps.

         This is offered as a comparison against the Ford pattern

listed above, as they are both Ford SEFI injectors but with different

operating ranges. The point is that you should not make any broad

assumptions for any manufacturer.

Fig. 12:  Single Injector w/Normal Current Flow - Current Pattern

         EXAMPLE #5 - CURRENT CONTROLLED DRIVER

         The known-good waveform in Fig. 13 is from a Chrysler 3.0L V6

PFI VIN [3]. It is a perfect example of the peak and hold theory. The

waveform shows a 1-amp per division current flow, ramping to 4 amps

and then decreasing to 1-amp to hold the injector open.

Fig. 13:  Injector Bank w/Normal Current Flow - Current Pattern

         EXAMPLE #6 - CURRENT CONTROLLED DRIVER

         This next known-good waveform is from a Ford 5.0L V8 CFI VIN

[F]. See Fig. 14. The pattern, which is set on a 250 milliamps scale,

indicates a 1.25 amp peak draw and a hold at 350 milliamps.

Fig. 14:  Single Injector w/Normal Current Flow - Current Pattern

         EXAMPLE #7 - CURRENT CONTROLLED DRIVER

         The known-good current controlled type waveform in  Fig. 15 is

from a GM 2.0L TBI VIN [1]. With the lab scope set at 2 amps per

division, notice that this system peaks at 4 amps and holds at 1 amp.

         The next waveform is from the same type of engine, except

that it shows a faulty injector. See Fig. 16. Notice that the current

went to almost 5 amps and stayed at 1 amp during the hold pattern.

Excessive amounts of current flow from bad injectors are a common

source of intermittent computer shutdown. Using a current waveform

pattern is the most accurate method of pinpointing this problem.

Fig. 15:  Single Injector w/Normal Current Flow - Current Pattern

Fig. 16:  Single Injector w/Excessive Current Flow - Current Pattern

         EXAMPLE #8 - CURRENT CONTROLLED DRIVER

         This known-good CPI system waveform from a GM 4.3L V6 CPI VIN

[W] peaks at 4 amps and holds at 1-amp. See  Fig. 17 for waveform.


Content   ..  360  361  362  363   ..