Engine Iveco Vector 8. Manual - part 22
 

  Index      Iveco     Engine Iveco Vector 8 - service repair manual 2006 year


Search            


Content   ..  20  21  22  23   ..


Engine Iveco Vector 8. Manual - part 22


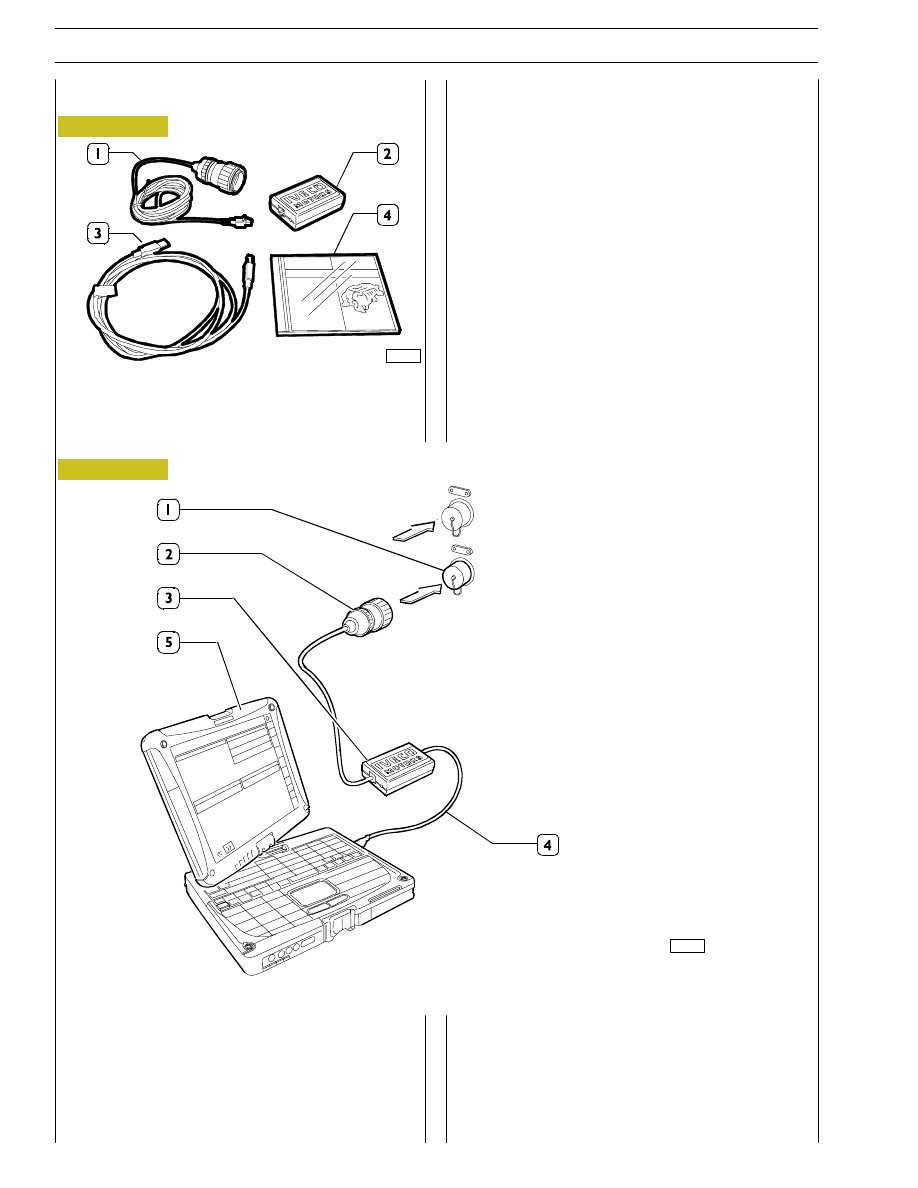
Connection procedures

- Unscrew plug (1) on switch box diagnosis connector.

- Connect the 25-pole connection of cable (2) on switch

box diagnosis connector.

- Connect signal transcoding adapter (3) (Compact

Communication Adapter) to the other side of cable (2).

- Connect cable (4) to the opposite side of part (3).

- Connect the USB connection of PC (5) to the other end

of cable (4).

Figure 1

Diagnosis interface kit for Vector motors

1. Cable connecting part 2 to diagnosis connector on

switch box - 2. Signal transcoding adapter (Compact

Communication Adapter) - 3. USB cable for PC -

4. Installation CD

The CD must be installed on a personal computer (not
included in the kit) having following minimum characteristics:

-

Processor Intel Centrino I.IULV

-

512 MB Ram

-

40 GByte HD

-

Internal modem 56 kbps V90

-

Card LAN 100 BASE-TX/10-BASE-T

-

88 character keyboard

-

Standard PC external interfaces

-

Operating system Windows 2000 Professional.

Program installation must be performed following the
procedures that are contained on the CD in the kit.

Figure 2

LOCAL CONTROL
-

ILC

99368543

connection

DIAGNOSE

-

Troubleshooting
tool

n.

99368550

connection

TROUBLESHOOTING WITH
TOOL 99368550

89757

89756

*

The diagnostic connection (1) and the connector (2) vary depending on the application.

*

*

58

SECTION 3 - INDUSTRIAL APPLICATION

VECTOR 8 ENGINES

Base - April 2006

Print P2D32V001E

Diagnosis procedures for Vector 8V engines

SW IVECO MOTORS user interface for VECTOR diagnosis.

The graphic interface of the Vector diagnosis software has
been designed to ensure easier utilization of the equipment
available to the user, as well as make the available functions
visible, and make the diagnosis procedures understandable and
adjustable to many different requirements.

The graphic interface is divided into three sections:

- a blue section, referred to as ”Title Area”, providing the

information for the selected product and specifying the
point where you are within the exploration route of the
diagnosis process.

- A left-hand section, referred to as ”Button Area”, which

allows you to select the functions.

- A central area, referred to as ”Operative Area”, which

makes it possible to display the available lists and functions,
thus allowing you to access the various operations.

Main screen with function selecting options

Description of buttons

STOP

- It allows you to exit the VECTOR application at any

time.

TOOLS

- This button is selected to access the ”Select

language” function.

- If you do not wish to use the function shown, select

the ”Tools” button again.

NAVIGATION

- These buttons allow you to shift between different

environments.

SCROLL

- It allows you to scroll long lists which cannot be

displayed by means of one single screen.

ON-OFF

- When ON is selected, the parameters are

continuously updated.

- When OFF is selected, the parameters will be

”frozen” upon selecting.

SAVE ON FILE

- It allows you to save the parameter registration data

on a file.

PRINT

SECTION 3 - INDUSTRIAL APPLICATION

59

VECTOR 8 ENGINES

Print P2D32V001E

Base - April 2006

Diagnosis Environment

ECM electronic control unit identification code

The diagnosis instrument consults a storage area of the
electronic control unit, where the identification data are listed.
Then it displays, if available, the identification code, the control
unit and software versions, the date of manufacture and the
ECU configuration data.

In the event that communication with the control unit is
interrupted, you can print the ”Identification code” screen
(where enabled) by selecting the PRINT button.

Consulting the ”Identification code” card is essential in the
event that information is requested from the Service
Department.

Control unit identification code reading

Fault code reading

Faults (memorized by the control unit) are automatically
identified by the diagnosis instrument after actuating
communication with the electronic control unit.

This screen lists the faults or malfunctioning relative to the
components directly connected and managed by the
electronic control unit.

Reading the FAULT CODES (available in the control unit)

Stored fault code reading

Some of the stored and listed faults might be intermittent.
More precisely, some of them might, when being diagnosed,
not be present, yet previously memorized by the control unit
itself (intermittent faults).

This screen also allows you to clear the faults found in the
memory after the repair work has been carried out.

Reading the FAULT CODES (present and intermittent)

Event code reading

This screen lists anomalous faults or malfunctioning of
components not closely related to the engine management
electronic control unit, but which could in any case affect
correct operation of the engine.

Reading the EVENT CODES (out-of-range sensors)

The screen is saved automatically in the ELTRAC
folder. It is advisable to rename the identification file
because it will be overwritten if there is a
connection to the diagnostic socket of another
power unit.

Note — Save key use: pressing the save key the file
of the screen is saved in the ELTRAC folder and a
name will be automatically given to it. The name of
the file includes the hours, minutes and seconds of
when it was saved. The name is univocal and
cannot be overwritten.

NOTE

NOTE

60

SECTION 3 - INDUSTRIAL APPLICATION

VECTOR 8 ENGINES

Base - April 2006

Print P2D32V001E

Fault parameter registration

The ”Stored SnapShot” screen provides a picture of the
conditions at the time when a fault or event occurred. The
diagnosis software makes it possible to store up to 50 faults
or events. This screen also allows you to perform clearing.

Reading and recording fault parameters

Fault parameter reading - Environment conditions

By selecting a fault or event from the previous screen, the
related environment conditions are provided.

Displaying the related environment conditions

Work parameter reading

Work parameters include all the parameters available in the
control unit.

It is important that work parameters are read when the system
is active (engine running).

The ON/OFF button allows you to have, according to the
choice made, the parameters updated (button set to ON) or
frozen upon selection (button set to OFF).

Work parameter reading

Diagnostic Test

The ”Utilities” screen allows you display the Engine Test
options available.

The diagnosis software provides for the following tests:

Displaying the Engine Test options available

Note — In order to ”freeze” the parameters
displays, position the ON/OFF pushbutton on OFF.
Then save by pressing the specific pushbutton.

NOTE

SECTION 3 - INDUSTRIAL APPLICATION

61

VECTOR 8 ENGINES

Print P2D32V001E

Base - April 2006


Content   ..  20  21  22  23   ..