DAF 95XF. Manual - part 704
7
TECHNICAL DATA
Front axle(s), leading rear axle and steered trailing swivel axle
6-4
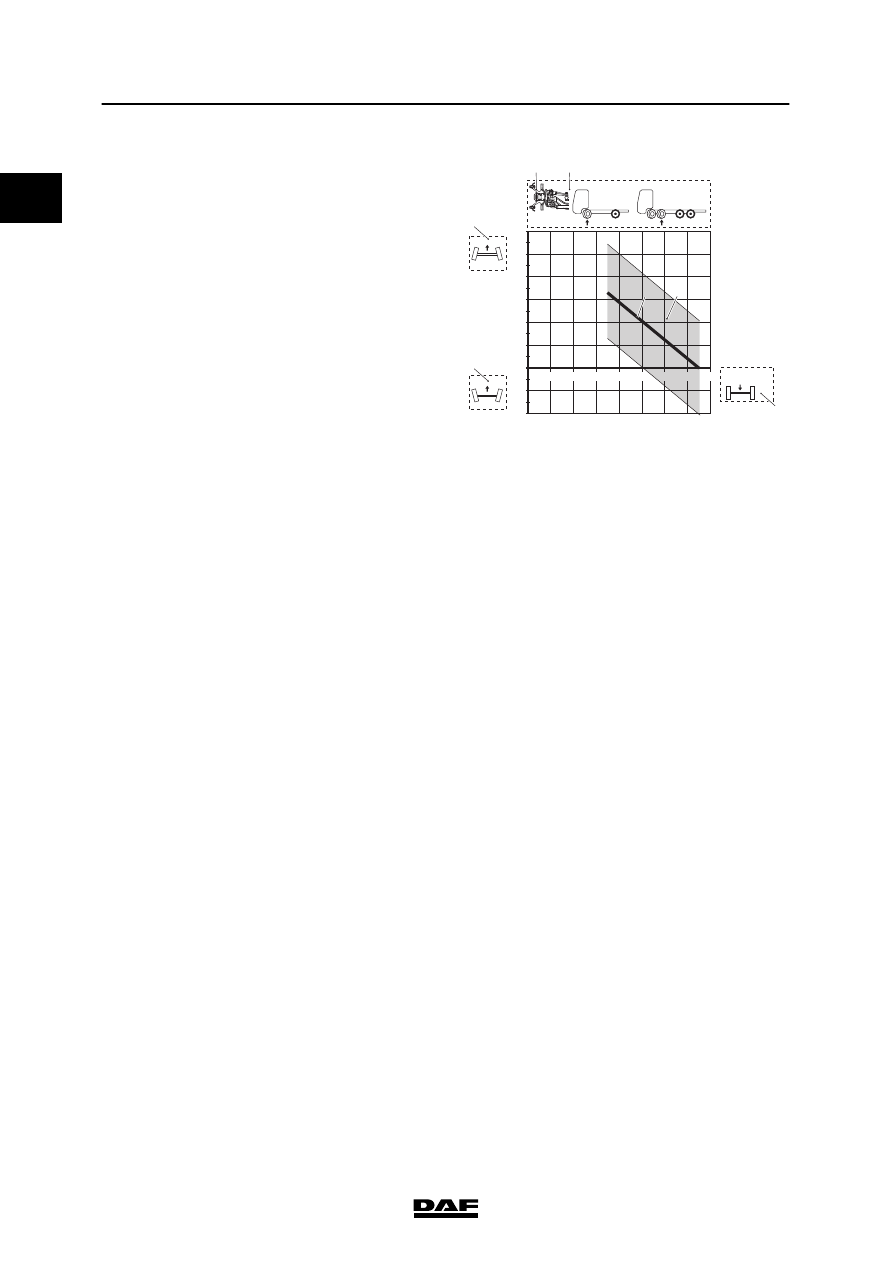
Explanation of graph
1.
The axle type and the axle configuration (1)
are shown at the top of the graph.
2.
With some axles, a distinction is made
between the disc brake and drum brake
versions. To this end either a picture (2) of a
disc brake or a drum brake is shown at the
top of the graph.
3.
On the left-hand side of the graph, the track
is shown in mm/m. The values above the 0
line show toe-in values, indicated by
symbol (3). The amounts under the 0 line
show toe-out, indicated by symbol (4). The
toe-out values are shown as negative
values.
4.
The axle load (5) is shown at the bottom of
the graph.
5.
The permitted toe at any axle load is
indicated by the shaded area (6) in the
graph.
6.
If the measured value lies outside the
shaded area, the toe must be adjusted to
the value indicated by the continuous
line (7).
1
2
3
4
5
6
7
8
0
-1
0,5
-0,5
-1,5
1,5
2,5
3,5
4,5
5,5
-2
2
3
4
5
6
1
mm/m
152 N
x 1000 KG
1
2
3
4
5
6
7
S700912
0
200424