НАК „НАФТОГАЗ УКРАЇНИ“. Річний звіт англійською (2018 рік) - 2


  Главная      Учебники - Разные     НАК „НАФТОГАЗ УКРАЇНИ“. Річний звіт англійською (2018 рік)


поиск по сайту            правообладателям  


содержание      ..      1      2      3      ..


НАК „НАФТОГАЗ УКРАЇНИ“. Річний звіт англійською (2018 рік) - 2


21

20

MARKET AND REFORMS

2018

ANNUAL REPORT 2018

EUGAL

A permit was granted for construction and operation of a planned 
pipeline in the territorial waters of Germany, as well as on the 
coast in Lubmin near Greifswald

A permit for the construction and operation of the pipeline system 
Nord Stream 2 in the German exclusive economic zone (EEZ) was received

The second permit required for the construction and operation of the Nord 
Stream 2 gas pipeline in the Finnish Exclusive Economic Zone (EEZ) was 
obtained and the procedure for obtaining permits in Finland was completed

Works on deep-water laying of the first string of 
the TurkStream gas pipeline has been completed

Works on the construction of the coastal part of 
the TurkStream gas pipeline began

Nord Stream 2 AG launched marine pre-construction works for further 
pipe laying in Greifswald Bay

The Swedish Government granted Nord Stream 2 AG a permit for laying a gas 
pipeline on the continental shelf within the Swedish economic zone of the 
Baltic Sea

Nord Stream 2 AG decided to lay a pipeline 
outside Danish waters and applied for 
construction along with an Environmental 
Impact Assessment

Nord Stream 2 AG began laying pipes in the 
Gulf of Finland and the construction of the 
gas pipeline began

More than 200 km of pipeline has been laid in the Baltic Sea

The marine section of the TurkStream gas pipeline is 
completed. According to Alexey Miller, the gas 
pipeline will be commissioned at the end of 2019

Nord Stream 2 AG started 
laying pipes in the territorial 
waters of Germany

Mecklenburg-Western Pomerania 
became the third federal unit that 
provided everything that was 
needed to approve the EUGAL pipeline

Saxon permit authorities issued a 
decision to approve project design 
for the northern part of the pipeline

All necessary permits for laying 
pipelines in the Brandenburg region 
were obtained

Permission for the construction 
of a 114-kilometer section of the 
pipeline in Russian territorial 
waters was obtained

January

March

April

May

June

July

August

September

October

November

Nord Stream 2

TURKISH STREAM 

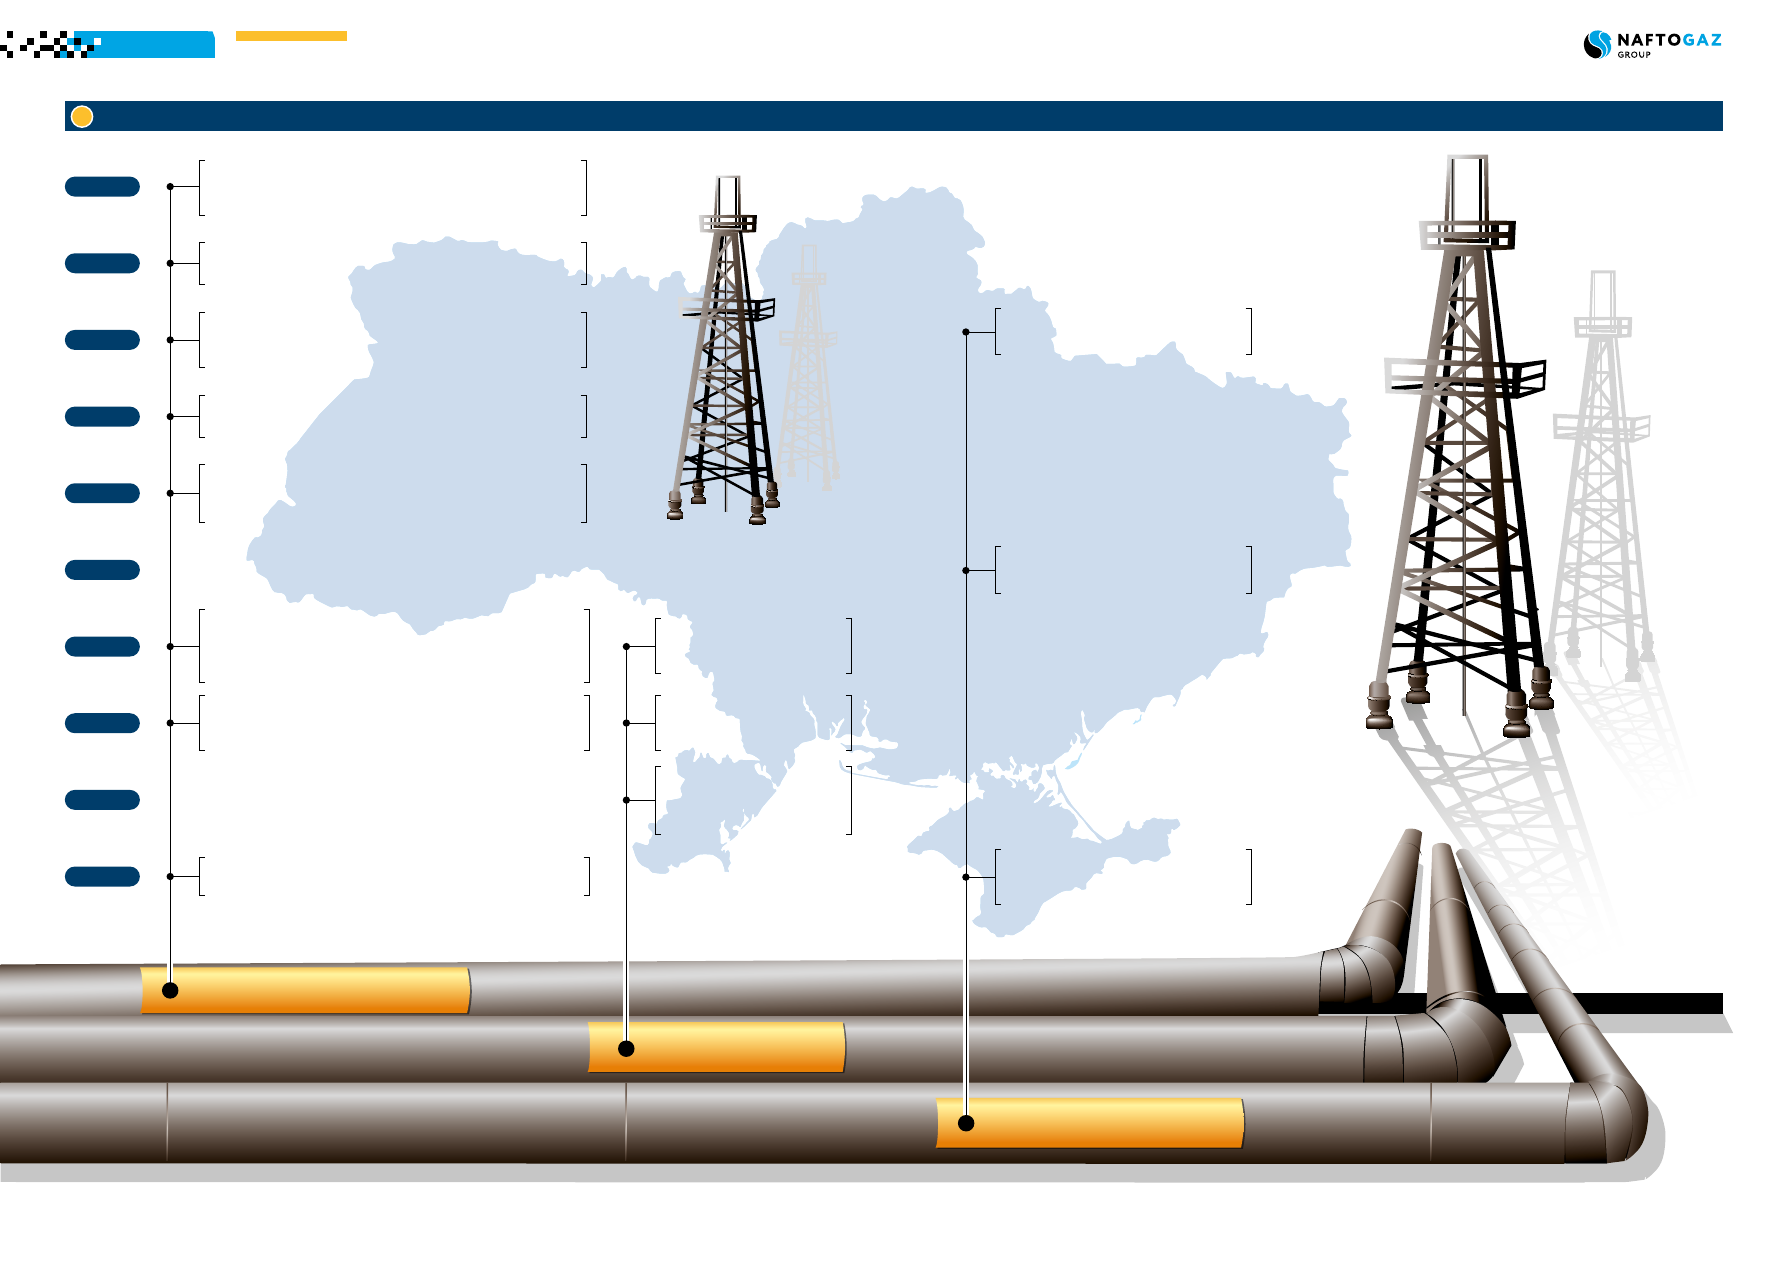
Progress in construction of bypass pipelines for Russian gas supply to the EU in 2018

-------------------------------------------------------------------------------------------------------------------------------------------------------------

23

22

MARKET AND REFORMS

2018

ANNUAL REPORT 2018

In view of the termination of the gas 

transit contract between Naftogaz and 

Gazprom in 2019, several rounds of trilat-

eral negotiations and expert consultations 

between the Ukrainian and Russian sides 

with the participation of the EU took place 

in 2018. At the time of writing this report, 

no agreement has been reached as to the 

terms of the transit contract after 2019. 

The  

Ukrainian side is open to discussing  

all possible proposals for the transit  

of Russian gas in future, given  

that the new contract should be based on 

the norms of European law.

At present, the Ukrainian side is in a 

completely different situation to that 

of 2009. The national legislation has 

changed, the new Law of Ukraine "On the 

Natural Gas Market" has been adopted, 

the Association Agreement between 

Ukraine and the EU has been concluded, 

secondary legislation has been developed 

based on European norms, and the 

extension of the current gas transit 

contract is legally impossible. Therefore, 

future relations between the Ukrainian 

and Russian sides in negotiating gas 

transit agreements should be based 

solely on European rules and regulations. 

This will ensure transparency, stability 

and predictability for each of the parties. 

In addition, future agreements with 

Gazprom should not conflict with the 

Stockholm arbitration awards rendered 

in 2017-2018, which means that the 

Russian party shall fulfill its obligations 

imposed by the arbitration.

To meet the expectations embedded 

in the Framework for Gas Production 

Increase in 2016-2020, each year, 

Naftogaz group needed 10 new 

exploration permits to be covered with 

seismic, studied, assess and select the 

most promising for further prospects 

to be tested by up to 13 exploration 

well each year. Then, Naftogaz group 

would have ensured a sufficient 

increase in recoverable reserves and 

their further development, drilling 

more than 10 wells in each new field. 

Deliberate blocking of new licenses 

by local authorities increases the risk 

of a 5.5 bсm underproduction by 

Ukrgasvydobuvannya by the end of 

2020.

In 2018, 20.95 bcm of natural gas was 

produced in Ukraine, which is 450 mcm 

more than in the previous year.  

A 2.2% growth was due to:

-  a 245 mcm increase in production by 

Ukrgasvydobuvannya, a key production 

company of Naftogaz group;

-  a 233 mcm increase by private 

producers.

The year 2018 was marked by an increase 

in Ukrgasvydobuvannya’s operating 

performance. The company reached a 

nine-year record in daily production (43 

mcm per day) and a 25-year record in 

annual production (15.50 bcm). 

Gas production in Ukraine

Pr

oduction, bc

m

14.5

13.5

12.6

11.6

10.7

0.7

1.0

1.4

1.5

0.5

0.7

0.9

1.1

1.7

2.3

1.2

2.0

3.0

1.0

1.7

2.8

14.6

15.3

16.5

18.3

20.1

Done

0.3

0.6

0.6

0.4

1 bcm in 2018 

and 5.5 bcm till the end of 2020

Impossible due to the lack 

of licenses for new fields 

0.4

2015

2016

2017

2018

2019

2020

0.1

0.3

22

21

20

19

18

17

16

15

14

13

12

11

10

0

Campaign for exploration 
and development of new fields

Drilling program 
for existing fields

Production enhancement 
program

Pressure optimization 
program

Wells recovery 
program

Basic production

17.3

9.7

The framework for gas production increase under the shortage of new fields

During the year, Ukrgasvydobuvannya 

successfully completed a program 

to offset the natural decline in gas 

production of about 1 bcm per year 

through the implementation of 

numerous technological initiatives. 

Ukrgasvydobuvannya has procured 

575 units of new equipment, thus 

upgrading 12% of its own equipment 

fleet. In 2018, 97 wells were drilled, and 

64 new wells were put into operation. 

Ukrgasvydobuvannya managed to 

maintain gas production and slightly 

increase daily and annual output 

from the existing portfolio of deposits 

through the comprehensive upgrade 

of its technical capacity, involvement 

of external drill contractors and 

technological fleets for the rehabilitation 

of wells (well workover operations), 

and enhancement of production (coiled 

tubing and fracturing). The company 

also concluded memorandums and 

multiservice contracts with leading 

service companies such as Schlumberger, 

Halliburton, Weatherford and Baker 

Hughes. Partnership with these 

companies provides access to cutting-

edge technological solutions, which 

will open up a new scope of works at 

wells that have been idle for years as 

plugged and abandoned or killed wells 

and deposits that were classified as 

off-balance or were ignored because 

previously their development had been 

assessed as unfeasible.

 bc

m

0

5

10

15

20

25

2015

2016

2017

2018

3.9

19.9

20.1

20.5

21.0

1.5

14.5

14.6

1.3

4.2

15.3

4.1

1.1

15.5

1.1

4.4

+1.0%

-3.0%

+2.3%

+2.2%

Ukrgasvydobuvannya

Ukrnafta

Private companies

Change in gas production, year-to-year, %

Gas production structure in Ukraine

The program exploration and 

development of new fields has been 

put at risk, as it takes 3-6 years to 

start commercial development after 

obtaining a license. In 2016-2017, 

Ukrgasvydobuvannya applied for new 

exploration licenses or extend the 

existing ones more than 145 times 

and received 135 refusals. As a result, 

Ukrgasvydobuvannya does not have a 

sufficient number of new fields to swiftly 

increase gas production. 

In 2018, the government announced 

an unprecedented number of new 

exploration permits to be tendered 

in 2019 through ProZorro electronic 

system for transparent bidding, as 

well as the launch of production-

sharing agreements (PSAs). For the 

first time in the history of independent 

Ukraine, the government initiated a 

transparent process to engage investors 

in exploration for new oil and gas fields, 

using best international practices. The 

State Service of Geology and Subsoil of 

Ukraine has prepared more than 30 oil 

and gas exploration permits with a total 

area of 4.63 thousand sq. km for online 

bidding procedures (ProZorro) to be 

held in 2019. The government decided 

on bidding terms and conditions for 

12 blocks with a total area of almost 

20 thousand sq. km to be offered  

for production-sharing agreements 

(PSAs).

Naftogaz group consistently transforms 

and improves its gas production 

companies, strengthening their technical 

units, which is demonstrated by the 

implementation of programs that do not 

depend on external approvals. Achieving 

energy independence in the conditions 

when the reserves and resources of the 

most promising southern oil and gas 

province of Ukraine in the Black Sea 

and Azov Sea cannot be used, requires 

synergy between the state authorities 

on the one hand, and Naftogaz group 

and private extractive companies on 

the other. The extractive industry is one 

of the most sluggish, so initiatives and 

transformations introduced last year will 

yield results in the form of produced 

cubic meters of natural gas only in a 

few years. Naftogaz group is optimistic 

about the prospects for the effective 

development of Ukraine's hydrocarbon 

resources and is ready to work together 

with all stakeholders: state agencies, 

independent E&P companies and local 

municipalities of gas-rich regions.

Source: Ukrgasvydobuvannya

Source: Ukrgasvydobuvannya

-------------------------------------------------------------------------------------------------------------------------------------------------------------

25

24

MARKET AND REFORMS

2018

ANNUAL REPORT 2018

32.3

Gas sources

20.9

Production

10.6

Imports

7.0

Naftogaz

15.5

Ukrgasvydobuvannya

4.4

Other 

1.9

 Ukrtransgaz

0.5 

Public sector

and religious organizations

2.3** 

Heat producers for public 

sector, religious organizations, 
industrial sector

1.0*

 Gas distribution operations

1.4

 Ukrgasvydobuvannya

0.3

 Ukrnafta

0.1

 Other

1.1 

Ukrnafta

-0.8

 UGS

32.3

Gas

usage

27.6

Gas consumed

by users

15.4

 Households

9.4

Industrial consumers

10.6

 Households

(direct use) 

4.8***

Heat producers for 

households

3.6

Private importers 

GAS BALANCE

* including unauthorized gas withdrawals (~0.9 bcm)
**  including unauthorized gas withdrawals (~0.6 bcm)
*** Source: NJSC Naftogaz of Ukraine Gas Sales Department 

2018, bcm

Own needs

and technological

losses

4.7


-------------------------------------------------------------------------------------------------------------------------------------------------------------

27

26

MARKET AND REFORMS

2018

ANNUAL REPORT 2018

In 2018, Ukraine imported gas 

exclusively from the European gas 

market. Compared to 2017, gas imports 

decreased by 25%, from 14.1 bcm to 

10.6 bcm. At the same time, the share 

of Naftogaz in the total gas imports to 

Ukraine increased to 66% in 2018 from 

61% in 2017.

In 2018, Naftogaz purchased natural gas 

from 18 European suppliers (in 2017 – 

13). None of these companies supplied 

more than 30% of the volume imported 

by Naftogaz.

65 companies imported gas to Ukraine 

in 2018 (67 companies in 2017). In the 

second and third quarters of 2018, 

private importers significantly reduced 

the volume of imports of natural gas 

compared to Naftogaz's imports

5

.

In 2018, the Slovak direction remained 

the major gas supply route to Ukraine 

while the share of supplies through 

Hungary increased for the second 

consecutive year, from 9% in 2016 to 32% 

in 2018.

Although Ukraine's annual need in gas 

imports is fully covered by the available 

reverse capacities, gas supplies to 

Ukraine from neighbouring countries 

are still not in line with European rules: 

relations with operators of the adjacent 

gas  system and Gazprom are not in line 

with European and Ukrainian energy 

legislation. For instance, the EU's 

standard interconnection agreements 

have not been fully applied.

Gas imports to Ukraine

Gas consumption

bc

m/year

8.2

8.7

7.0

2.9

5.4

3.6

0%

10%

20%

30%

40%

50%

60%

70%

80%

90%

100%

0

2

4

6

8

10

12

14

16

2016

2017

2018

Other importers (left axis)

Naftogaz (left axis) 

Naftogaz’s share in total gas imports (right axis)

Gas imports to Ukraine in 2016-2018

Naftogaz imports
Other companies

 mc

m

January

February

Mar

ch

April

M

ay

June

July

August

Sep

tember

Oct

ober

No

vember

December

0

200

400

600

800

1 000

1 200

1 400

Distribution of gas imports in 2018

Ukraine’s total gas consumption in 2018 

increased by 1.3% (from 31.9 to 32.3 bcm) 

compared to 2017. 

Households used 10.6 bcm of gas, which 

is 0.6 bcm less than in 2017 (-5.4%) due to 

the following factors:

•  the number of subsidy recipients more 

than halved in autumn and winter;

•  social consumption standards for subsidy 

recipients were cut by nearly 10% since 

1 May 2018;

•  the end user gas price grew by 22.9% 

since 1 November 2018

6

Meanwhile, gas consumption by district 

heating companies for household needs 

amounted to 4.8 bcm in 2018, which is 

0.2 bcm more than in 2017 (+4.3%) due to 

the following factors: 

•  lower temperature in 2018 compared to 

2017; 

•  households are largely not able to reg-

ulate the use of heat in their homes (or 

such regulation in individual apartments 

has little effect on the apartment block 

due to redistribution of heat among the 

rest of the apartments). This is why the 

said gas-saving factors by households are 

insignificant when it comes to gas use for 

household heating. 

Heat generation for public institutions and 

the industrial sector accounted for 2.3 bcm, 

which is 0.4 bcm more than in 2017. Higher 

gas consumption by this category was not 

only due to weather conditions but also 

due to the price factor. This customer cate-

gory is subject to the PSO Resolution, which 

means buying gas at regulated prices. In 

2017, gas prices for heat producers (to 

cover the needs of commercial customers) 

were 1.6 times higher than the prices for 

household needs, but since November 

2018, gas prices for heat production equal-

ized for all customers. This was due to a 

21% decrease in the wholesale gas price 

for heat producers to cover the needs 

of commercial customers. Other market 

segments increased their gas consumption 

by 0.4 bcm from 14.2 bcm to 14.6 bcm. 

Against the background of economic recov-

ery, the industrial sector posted a 0.2 bcm 

growth, having used 9.4 bcm.

6

   http://www.naftogaz.com/files/Information/Dynamika-cina-2014-2018-Naselennya.pdf

From Poland (Hermanowice)

From Hungary (Beregdaroc)

From Slovakia (Budince)

9%

9%

82%

9%

7%

20%

71%

32%

61%

2016

2017
2018

Distribution of gas imports by entry point in 2016-2018

5

 http://www.nerc.gov.ua/data/filearch/monitoryng/gas/2018/monitoryng_gaz_II-2018.pdf

Debts for unauthorized withdrawal of 

natural gas continued to accumulate in 

2018. In 2018, the debt for unauthorized 

withdrawal of natural gas grew by 

UAH 14 billion and amounted to 

UAH 34 billion as of the end of the year. 

The volume of gas used for balancing 

decreased to 1.5 bcm in 2018 from 1.8 bcm 

in the previous year, which was due to the 

extension of the PSO Resolution to all heat 

producers starting from April 2017 and 

alleviated requirements to heat producers 

when concluding supply agreements with 

Naftogaz. 

Under the current PSO regime, the dif-

ference between the price for industrial 

customers and the regulated price contin-

ued to be tangible in 2018. As of the be-

ginning of the heating season 2018/2019, 

this difference in prices reached a record 

130%, the highest since 2017.

UAH, V

AT exc

l./ t

cm

0

 2 000

 4 000

 6 000

 8 000

 10 000

 12 000

January 2015

Mar

ch 2015

Ma

y 2015

July 2015

Sep

tember 2015

No

vember 2015

January 2016

Mar

ch 2016

Ma

y 2016

July 2016

Sep

tember 2016

No

vember 2016

January 2017

Mar

ch 2017

Ma

y 2017

July 2017

Sep

tember 2017

No

vember 2017

January 2018

Mar

ch 2018

Ma

y 2018

July 2018

Sep

tember 2018

No

vember 2018

Households 

Industrial sector

Naftogaz wholesale prices since January 2015

Source: Ukrtransgaz

Source: Ukrtransgaz

Source: Ukrtransgaz, Naftogaz calculations

2018
2017

11.2

4.6

1.9

0.5

9.3

4.4

10.6

4.8

2.3

0.5

9.4

4.7

Households (direct use)

Heat producers for households***

Heat producers

for public sector, religious 

organizations and industrial sector**

Public sector and religious organizations

Industrial sector

Operating needs (gas production,

transmission and distribution),

LPG production*

* including unauthorized gas withdrawals (~0.9 bcm) 

** including unauthorized gas withdrawals (~0.6 bcm) 

*** Source: Naftogaz calculations

Ukraine's gas consumption 2017-2018, bcm

Source: Ukrtransgaz, Naftogaz calculations

Source: Naftogaz

-------------------------------------------------------------------------------------------------------------------------------------------------------------

29

28

MARKET AND REFORMS

2018

ANNUAL REPORT 2018

0%

20%

40%

60%

80%

100%

120%

140%

January 2017

February 2017

Mar

ch 2017

April 2017

Ma

y 2017

June 2017

July 2017

August 2017

Sep

tember 2017

Oct

ober 2017

No

vember 2017

December 2017

January 2018

February 2018

Mar

ch 2018

April 2018

Ma

y 2018

June 2018

July 2018

August 2018

Sep

tember 2018

Oct

ober 2018

No

vember 2018

December 2018

Change in the difference between market and regulated gas prices, % 

In 2018, the Ukrainian government 

extended the terms of the PSO 

several times. The latest decision of 

the government, as of the time of 

preparation of this report, enshrined 

in the Resolution of the Cabinet of 

Ministers of Ukraine dated 19 October 

2018 (#867) provided for the extension 

of the PSO until 30 April 2020

7

. After 

long negotiations with the IMF, the 

government made a compromise and 

increased the price of natural gas for 

household consumers. Meanwhile, even 

with the decrease in the market price 

at the end of the year, the difference 

between market and regulated price as 

of December 2018 was about 50%. 

In 2018, hidden subsidies (the difference 

between market and regulated prices)

8


accounted for 6% of state budget 

revenues. Such hidden subsidies 

lead to the following negative 

consequences:

1.  The seller’s proceeds are lower than 

they are supposed to be (meaning 

financial losses).

2.  Encouraging inefficient consumption of 

the subsidized product: the lower the 

price, the more the consumption.

3.  Poor people get less benefit from 

hidden subsidies than those who are 

richer and consume more.

4.  Higher decline in production, since 

lower the prices usually contribute  

to lower output.

5.  If hidden subsidies are provided only 

to certain categories of  buyers on the 

market, it stimulates speculation and 

corruption. Certain buyers purchasing 

at a price reduced in an administrative 

way will try to resell it at the market 

price. Administrative restrictions on 

these black market transactions will 

lead to more scheming in order to 

bypass restrictions.

According to international experts, 

Ukraine traditionally relied on hidden 

subsidies for gas, although it would be 

worthwhile to create conditions for the 

growth of wages and pensions, which 

would allow customers to pay market 

prices.

The gas distribution segment is the "last 

mile," the interface with the end user.

Therefore, the operation of this segment 

under market rules is important for the 

development of an efficient market. The 

publication of the Council of European 

Regulators for Energy

9

 identified some 

characteristics of a well-functioning 

retail gas market. From the supply side, 

there should be a low concentration of 

market power of any market participant, 

which allows consumers to benefit 

from competition and innovations. In 

addition, entry barriers should be as 

low as possible, allowing new vendors 

to enter the market. Finally, there 

should be a close connection between 

wholesale and retail prices. This 

includes transparent pricing for gas as a 

commodity, giving market participants 

input in setting retail gas prices. As for 

demand, it is important that consumers 

have access to information about 

offers from different suppliers and the 

supplier changing procedure. Currently, 

Ukraine continues fundamental reforms 

of its gas market. Many of major 

disadvantages of the previous market 

model have been completely or almost 

fully eliminated, but a number of 

problems remain unresolved. The key 

remaining problems include lack  

of competition in retail, accumulation  

of debt for unauthorized offtake, 

 and administrative regulation of gas 

prices.

7  

https://zakon.rada.gov.ua/laws/show/867-2018-%D0%BF#n91 

8

 https://biz.nv.ua/ukr/naftogaz-protiv-gazproma/shcho-take-prihovani-subsidiji-i-chomu-ce-nebezpechno-dlya-derzhavi-50008684.html

9

 Noorlander, M. (February 2016). What should a well-functioning retail energy market look like? The Council of European Regulators of Energy, CEER.

Source: Naftogaz calculations

-------------------------------------------------------------------------------------------------------------------------------------------------------------

31

30

MARKET AND REFORMS

ANNUAL REPORT 2018

2018

GLOBAL OIL MARKET

In 2018, like in previous periods, 

political factors played one of the key 

roles in shaping prices. In mid-April, 

the president of the United States 

voiced criticism towards OPEC – he 

accused the organization of artificially 

inflated oil prices, calling such actions 

unacceptable

1

. The statement concerned 

the deal between members of the 

Organization of Petroleum Exporting 

Countries (OPEC) and other non-member 

states, including Russia, with regard to 

the curtail oil production. The deal was 

reached at the end of 2016 and were 

repeatedly extended. Then on 8 May 

2018, the United States announced their 

withdrawal from the nuclear agreement 

with Iran and their readiness to impose 

sanctions on the country. It was also 

claimed that the United States would 

resume economic sanctions against Iran, 

which were relieved under the terms 

of the agreement, and would introduce 

new restrictions that would come into 

force in 90 and 180 days. The commodity 

market responded to such events by the 

growth of oil quotations to the level of 

November 2014, and subsequently for 

several months in view of uncertainty as 

to the possible effect of the imposition 

of sanctions, prices remained at a rather 

high level, in the range USD 72 to 80 per 

barrel.

Existing expectations that the world 

economy could slow down  and, 

consequently, lead to a possible reduction 

in demand for oil in the future periods 

coincided with the decision of OPEC 

countries in June 2018 to increase 

production by 1 million barrels per day. 

This led to a minor decrease in prices 

in the beginning of the second half of 

2018 to USD 65-67 per barrel. However, 

in the autumn, the market was rather 

uncertain about the assessment of the 

real economic consequences of the US 

withdrawal from the nuclear agreement 

and the possible reduction of supply 

on the market due to the imposition of 

sanctions on Iran, including in the energy 

sector. These factors contributed to a 

gradual increase in prices to USD 85 per 

barrel in November 2018.

At the end of 2018, the price of oil 

was formed under the influence of 

a new round of trade wars between 

China and the United States

3

which caused, among other things, 

negative expectations regarding the 

transformation of the conflict into a 

global trade war and further downturn 

of the global economy

4

. In addition 

to the trade conflict, an increase in 

interest rates in developing countries 

and the deterioration of economic 

growth in the EU led to a decline in IMF 

forecasts for global economic growth in 

2018 and 2019 by 0.2%. The difficulties 

faced by the US in adopting a budget 

added to fears of recession. All this 

meant that demand for oil could drop 

significantly – and such expectations 

led to a sharp drop in prices. 

In addition, a significant gap between 

supply and demand persisted for 

several months. Relatively high 

prices established back in May have 

contributed to world growth of oil 

production – from May to November 

2018, this has grown by 2.5 million 

barrels per day. Meanwhile, oil exports 

from Iran began to decline during the 

summer, indicating that pressure from 

the United States and expectations of 

possible sanctions in the energy sector 

had an impact. However, the pace of 

decline in production and export of 

oil by Iran, which was expected as a 

result of the introduction of sanctions, 

appeared to be overestimated, and the 

pace of decline in production appeared 

to be slower. According to the OPEC 

Secretariat, oil production in Iran in 

2018 amounted to 3.56 million barrels 

per day, compared to 3.8 million barrels 

per day in 2017. The final negative 

factor for prices was the granted waivers 

for purchase of Iranian oil for eight 

countries, which reduced the effect of 

sanctions.

Unlike 2017, which had been successful 

for European refineries due to high 

margins and capacity utilization level, 

the situation changed in 2018. The 

relatively high oil prices in the first to 

third quarter of 2018 led both to a 

decrease in the consumption levels of 

petroleum products, and to a decrease 

in the profitability of European refineries 

(which, as a rule, are not able to entirely 

transfer the increase in raw material 

prices into a comparative increase in 

prices for petroleum products).

1

 https://www.bloomberg.com/news/articles/2018-06-05/u-s-said-to-ask-opec-for-1-million-barrel-a-day-oil-output-hike

2

 https://uk.reuters.com/article/uk-oil-prices-kemp/commentary-global-economic-slowdown-is-likely-and-necessary-later-in-2018-or-2019-idUKKBN1K815G

3

  On September 17, the United States imposed duties on the largest portion of Chinese imports worth USD 200 billion a year. Soon China replied that they would impose import duties on US imports worth USD 60 billion a 

year. 

4

  In January 2019, China reported its largest monthly drop in exports over two years, which led to the collapse of Asian stocks and subsequently European stocks. Exports from China dropped sharply by 4.4% in December 

compared to the same month in a previous year.

US

D/ barr

el 

45

50

55

60

65

70

75

80

85

90

02

.01

16

.01

30

.01

13

.02

27

.02

13

.03

27

.03

10

.04

24

.04

08

.05

22

.05

05

.06

19

.06

03

.07

17

.07

31

.07

14

.08

28

.08

11.

09

25

.09

09

.10

23

.10

06

.11

20

.11

04

.12

18

.12

Development of Brent oil spot prices in 2018

European oil refining market

million barr

el/da

y

Supply

95

96

97

98

99

100

101

102

103

Jan

uar

y

Febr

ua

ry

M

ar

ch 

Ap

ril

May

Jun

e

Jul

y

Augu

st

Sep

temb

er

Oc

tob

er

No

vemb

er

De

cemb

er

Demand

Global oil demand and supply in 2018

US

D/

ba

rr

el

US

D/

ba

rr

el

78%

80%

82%

84%

86%

88%

90%

92%

94%

25

35

45

55

65

75

85

Q1

2015

Q2

2015

Q3

2015

Q4

2015

Q1

2016

Q2

2016

Q3

2016

Q4

2016

Q1

2017

Q2

2017

Q3

2017

Q4

2017

Q1

2018

Q2

2018

Q3

2018

Q4

2018

EU-16 refineries capacity utilization level (right axis)  

Brent oil refining margin, North-Western Europe (left axis)

3

4

5

6

7

8

9

10

78%

80%

82%

84%

86%

88%

90%

92%

94%

Q1 

2015

Q2 

2015

Q3

2015

Q4

2015

Q1

2016

Q2

2016

Q3

2016

Q4

2016

Q1

2017

Q2

2017

Q3

2017

Q4

2017

Q1

2018

Q2

2018

Q3

2018

Q4

2018

Brent oil price (left axis) 
EU-16 refineries capacity utilization level (right axis)

EU-16 refineries capacity utilization level, Brent oil price

EU-16 refineries capacity utilization level and refining margin

Source: S&P Global Platts

Source: EIA, Eikon Thomson Reuters

Source: OPEC Monthly Report, S&P Global Platts, IEA/KBC Monthly Global Indicator Refining Margins 

Source: OPEC Monthly Report, S&P Global Platts, IEA/KBC Monthly Global Indicator Refining Margins 

-------------------------------------------------------------------------------------------------------------------------------------------------------------

33

32

MARKET AND REFORMS

ANNUAL REPORT 2018

2018

A striking trend in 2018 was that during 

the summer season, the margins for oil 

refineries were kept at the same level 

due to the sale of gasoline fractions. Due 

to increased demand in the African and 

US East Coast markets, gasoline stocks 

decreased significantly and oil refiners 

could supply gasoline to these markets at 

higher prices. 

In recent years, long-term expectations 

tend to prevail in the market. This means 

that the trend in Europe to increase the 

consumption of energy from renewable 

sources will hold back the development 

of the oil refining industry. In addition, 

the more stringent environmental 

standards introduced by the European 

Union and national governments can 

further reduce demand for oil in the 

region and accordingly affect the margin 

of oil refining in European countries, 

which is already lower than in other 

regions

5

.

The trend towards reducing oil refining 

capacities in Europe is clearly traced 

against the background of global trends. 

The global capacity of Fluid Catalytic 

Cracking Unit of refineries (FCCU) has 

increased from 19.65 million barrels per 

day in 2013 to 20.64 million barrels per 

day in 2018 (an annual increase of about 

1%). This rate is expected to increase 

to 25.76 million barrels per day in 2023 

(+ 4.4%)

6

. Unlike global trends, FCCU 

capacity in Europe has actually dropped 

from 2.47 million barrels per day in 2013 

to 2.34 million barrels per day in 2018, 

with a negative average annual growth 

rate of -1.1%. This trend is expected to 

continue.

At present, Kremenchuk oil refinery 

(Ukrtatnafta)

8

 accounts for almost all oil  

imports. According to the State Fiscal 

Service, imports of oil to the country 

decreased in 2018 by 25% to 0.87 

million tons from 1.01 million tons in 

2017. Despite a number of statements 

about the possibilities to fully provide 

Ukraine with high-quality fuels, in 

2018 Ukrtatnafta failed to increase the 

amount of raw material processing. 

According to the company's reports

9

this was due to the anticompetitive 

actions of oil producers in the Russian 

Federation and Belarus which, in turn, 

buy oil in Russia at a price that does 

not include export duty, this is in turn 

boost refinery margins of Russian 

and Belarusian refineries. Due to the 

protectionist policy of Customs Union 

countries with regard to refineries and 

logistic proximity, the latter manage to 

maintain a high share of the Ukrainian 

fuel market. In 2018, Shebelynka 

gas processing plant (Shebelynske 

VPGKN), the main oil refining asset of 

Ukrgasvydobuvannya, continued its 

systematic work on the implementation 

of projects aimed at intensification of 

hydrocarbon commodities processing 

using modern deep processing 

technology, increasing Euro-5 gasoline 

production volumes and optimizing 

its product portfolio. The volume of 

petroleum raw material processing at 

the plant in 2018 decreased due to the 

reduction of gas condensate and oil 

production by Ukrgasvydobuvannya.

The domestic oil market, as in previous 

periods, was commoditized both through 

the domestic extraction of oil and 

through the import of oil. According to 

the company,  the volume of processing 

of oil, gas condensate and other  raw 

materials at the Kremenchuk oil refinery 

and Shebelynka refinery amounted to 

2.7 million tons, which was roughly 80% 

covered by oil of Ukrainian origin. 

The volume of oil and gas condensate 

production in the country increased by 

4% to 2.1 million tons in 2018. For the 

first time in 12 years, the downward 

trend in oil and condensate production 

was reversed. At the same time, 

according to the results of 2018, the 

largest oil company in Ukraine, PJSC 

"Ukrnafta", increased its production by 

5% compared to the previous year (to 

1.45 million tons). In 2018, Ukrnafta 

carried out 17 hydraulic fracturing 

operations, completed workovers of 

121 wells, and conducted 93 production 

intensification operations. As a result 

of these workovers, an additional 58.4 

thousand tons of oil and condensate 

were extracted in 2018, while 

intensification operations resulted in 

an additional 27.2 thousand tons of oil. 

The volume of gas condensate and oil 

production  by Ukrgasvydobuvannya (454 

thousand tons) is lower than the same 

indicator in 2017 by 3%. 

Despite the improvement in Ukrnafta's 

production figures, the overall oil 

production trend demonstrated by 

Naftogaz group in recent years has 

remained negative due to, among 

other things, the accumulated tax 

debt problem, which makes any active 

investment program aimed at the 

development of the company’s reserves 

impossible.

5

 According to the IEA data on oil refining margin indicators

6

 According to GlobalData

8

 Ukrgasvydobuvannya is engaged in gas condensate processing 

9

 https://www.ukrtatnafta.com/news.php?id=526

10

 With adjusted figures the volume of processing in 2017 amounted to 516.000 tons of oil and gas condensate and components

11

 http://enkorr.com.ua/a/news/Ukrainskiy_rinok_avtogaza_za_god_viros_na_9/235318

7

  The starting auction price is calculated based on average quotations for the 15 days preceding the date 

of registration of applications for the auction

Oil and petroleum market of Ukraine

In view of the fact that Ukrnafta does 

not have its own oil refining capacity, 

the company, in accordance with 

Article 4 of the Law of Ukraine "On Oil 

and Gas," sells oil and gas condensate, 

its own production, at auction. 

Ukrgasvydobuvannya processes oil and 

gas condensate using its own production 

facilities.

The results of these auctions show that 

the trend in oil and condensate sale 

prices corresponded to the trend of 

changes in world oil prices. Taking into 

account the peculiarities of the formation 

of the starting price for auctions for 

the sale of oil and condensate

7

, the 

price of oil sales was lower than the 

average monthly price of Brent oil in 

the first three quarters of 2018 (when 

the average price on the world market 

increased) and higher than Brent prices 

in the fourth quarter of 2018 (when the 

price in the world market declined).

In 2018, growth in the estimated 

balance (general consumption) of the 

Ukrainian petroleum products market 

was observed. While the production 

volume remained almost unchanged, 

demand on the petroleum products 

market was satisfied due to an increase 

of petroleum product imports to the 

country. The main trend in recent 

years, including in 2018, is the decline 

in consumption of automotive gasoline 

and its replacement with Liquefied 

petroleum gas. According to industry 

publications

11

, the import of Liquefied 

petroleum gas in 2018 grew by 12.7% 

from 1.17 to 1.32 million tons.

m

ill

io

n t

on

s

0,00

0,50

1,00

1,50

2,00

2,50

3,00

2013

2014

2015

2016

2017

2018

Ukrgasvydobuvannya

Ukrnafta

CAGR - 5,5%

0

50

100

150

200

250

300

350

50

55

60

65

70

75

80

85

 th

ou

sa

nd t

on

s

US

D/

ba

rr

el

Jan

uar

Febr

ua

ry


M

ar

ch 

Ap

ril

May

Jun

e

Ju

ly 

Augu

st

Sep

temb

er

Oc

tob

er

No

vemb

er

De

cemb

er

Sales of oil (right axis)

Average monthly Brent oil price (left axis)

Estimated average auction sale price normalized to USD/barrel (left axis)

Sales of oil and gas condensate by Ukrnafta in 2018

Oil and gas condensate production 

by Naftogaz group companies, 2013-1018

473

515

516

481

100

150

200

250

300

350

400

450

500

550

2015

2016

2017

2018

th

ou

sa

nd

 to

ns

Shebelynka refinery: dynamics of processing volumes in 2015-2018

10 

84%

12%

2%

2%

84%

11%

3%

2%

86%

9%

3%

2%

0%

10%

20%

30%

40%

50%

60%

70%

80%

90%

100%

Light petroleum products

Heavy petroleum products

Liquefied gas

Losses

2016

2017

2018

Shebelynka refinery: structure of petroleum products in 2016-2018

-2.00

0.00

2.00

4.00

6.00

8.00

10.00

12.00

14.00

Export

Production

Import

Balance

2016

2017

2018

Indicative balance  of the Ukrainian 

petroleum products market, 2018-2018, million tons

Source: UICE, S&P Global Platts, in-house calculations 

Source: Ukrgasvydobuvannya, Ukrnafta

Source: The State Fiscal Service, in-house calculations 

Source: Ukrgasvydobuvannya (processing volumes including components, additives, etc)

Source: Ukrgasvydobuvannya, in-house calculations

-------------------------------------------------------------------------------------------------------------------------------------------------------------

35

34

MARKET AND REFORMS

ANNUAL REPORT 2018

2018

Despite the relatively tangible success 

of domestic refineries in improving 

the quality of petroleum products, 

the domestic market continues to be 

significantly dependent on imported 

supplies of petroleum products. In 

2018, approximately 76% was imported. 

According to the State Fiscal Service, 

in 2018 Ukraine imported 8.06 million 

tons

11

 of petroleum products worth 

USD 5.54 billion, which is 33% more than 

in 2017 in monetary terms. 

Since the Ukrainian petroleum product 

market is dependent on imports, the 

price of petroleum products on the 

domestic market is formed based on price 

quotations in the major European hubs in 

South and North Western Europe.

-40%

-30%

-20%

-10%

0%

10%

20%

30%

40%

A-95 gasoline (Ukraine), net of taxes and duties

Eurobob quotations (North West Europe)

Jan

uar

y

Feb

ru

ar

y

M

ar

ch

Ap

ril

May

Jun

e

Jul

y

Augu

st

Se

pt

emb

er

Oc

tob

er

No

ve

mb

er

De

ce

mb

er

Comparative dynamics of wholesale gasoline prices in Ukraine  

and North West Europe in 2018 (price as of 04.01.2018 = 100%) 

Transportation of oil via the main 

pipelines in Ukraine is carried out 

exclusively by Ukrtransnafta, which is 

part of Naftogaz group. In 2018, the total 

volume of transported oil amounted 

to about 15.4 million tons. A decline in 

volumes of transportation is observed 

both in transit flows (due to reduced 

utilization of European refineries 

capacities), and transportation of oil 

that is imported to Ukraine. At the same 

time, records showed the growth of 

transportation of oil produced in Ukraine 

(from 1.25 million tons in 2017 to 

1.34 million tons in 2018).

Reducing the volume of oil transit has 

been a long-term trend. Over the past 

ten years, the volume of transit through 

the Ukrainian oil transportation system 

has decreased by more than half. In 

view of the fact that the volume of oil 

transit depends on Russia's policy as 

the main customer of oil transportation 

services through Ukraine, as well as on 

the resource supply and diversification 

of oil supplies to the refineries of the 

Czech Republic, Slovakia and Hungary, 

the operator of the oil transportation 

system of Ukraine is considering the 

extension of the number of customers 

of transportation services. One of the 

steps towards achieving this goal is the 

implementation of a project that would 

enable transportation of different types 

of oil to European refineries using the 

“Southern Friendship” pipeline, which 

involves the use of existing infrastructure 

and available stranded oil transit 

capacities. On 29 November 2018, 

the project was assigned the status of 

PMI (Project of Mutual Interest) in a 

resolution from the Energy Community 

Ministerial Council. This decision was 

the result of cooperation between 

Ukrtransnafta and other stakeholders 

during the selection of projects 

nominated for the status of PMI.

Another important issue is the 

establishment of economically feasible 

tariffs for oil transportation services for 

Ukrainian consumers, which still remains 

a loss-making segment of Ukrtransnafta's 

operations. 

Back in the summer of 2017, the NCREU 

adopted a resolution approving a new 

procedure for the formation of tariffs for 

the transportation of oil and petroleum 

products via the main pipelines

12

Ukrtransnafta, for its part, based on 

the approved procedure, developed 

a package of documents for changing 

the existing tariffs for oil transportation, 

which would allow the introduction of 

an effective and economically sound tariff 

policy. However, when the proposed 

changes were discussed, domestic oil 

producing and oil refining companies 

expressed their unwillingness to adopt 

a new tariff mechanism.

Taking into account the position of the 

enterprises of the oil extracting and oil 

refining sectors, Ukrtransnafta offered 

a phased recalculation of tariffs within 

three years. At the beginning of 2018, 

the company submitted its proposals 

to NCREU. The NCREU Resolution of 

10.10.18 #1150 approved changes 

to the procedure, including the 

envisaged transition period of three 

years. During this period, the tariffs for 

oil transportation through the main 

pipelines for consumers in Ukraine 

shall be calculated using a simplified 

methodology and the annual tariff 

growth rate. By the end of the transition 

period, the tariff for the transportation  

of oil through the main pipelines  

for each route should reach the  

target level.

Oil transit and transportation 

11

 Excluding the volume of imported crude oil and liquefied petroleum gas

12

  The procedure for the formation of tariffs for oil and petroleum product transportation through the main pipelines, approved by the resolution of the National Commission for State Regulation in Energy and Utilities 

Sector, dated 25 May 2017, #690

1.4

2.1

2.0*

0

1

1

2

2

3

2016

2017

2018

m

ill

io

n t

on

s

13.8

13.9

13.3

0

2

4

6

8

10

12

14

16

2016

2017

2018

m

ill

io

n t

on

s

Volumes of domestic transportation of imported  

oil and domestically produced oil in 2016-2018

Volumes of oil transit 

in 2016-2018

Source: UPECO, S&P Global Platts, in-house calculations

Source: Ukrtransnafta

Source: Ukrtransnafta

*excluding volumes of oil transmission by Ukrtransnafta

-------------------------------------------------------------------------------------------------------------------------------------------------------------


содержание      ..      1      2      3      ..