USM 08 RMGView Diagnostic Software. Operation instructions (2014)
USM 08 RMGView Diagnostic Software
OPERATING INSTRUCTIONS
Serving the Gas
Industry Worldwide
STATUS JANUARY 2014
by Honeywell
CONTENTS
1
INTRODUCTION
1
1.1
Installation
1
2
USM WINDOW
2
2.1
"Live values"
2
2.2
USM 08 ultrasonic meter:
8
2.3
Detailed path information:
9
2.4
Angle of swirl:
10
2.5
Status displays:
11
2.6
Path speeds:
12
3
"RMGVIEW LIST" WINDOW
13
3.1
Editor of the user-defined lists
18
3.2
Recording of list values
21
3.3
Plots "New plot" (Graphics)
22
3.4
y scale:
23
3.5
Autoscale:
23
3.6
Zoom
25
3.7
Exporting of plot files
25
3.8
Protocols
26
3.9
Tools
33
3.10
Protocol editor
33
3.11
Configure USE
35
3.12
USE09 error/warnings
35
3.13
Modbus notifications
36
3.14
Parameter log
36
3.15
Event log
37
3.16
Save window configuration
37
3.17
Recreate window configuration
37
3.18
Closing all RMGView windows
37
3.19
Opening RMGView APPDATA folder
37
CONTENTS
4
INSTRUMENT PANEL
38
4.1
General information:
38
4.2
Flow profiles:
39
4.3
Path & transmitter measurement values:
39
4.4
Live Plots:
40
5
TEST VALUES
42
5.1
"Run Inspection" button
44
5.2
"Configuration protocol" button
45
5.3
"USM history" button
46
5.4
"Generate test protocol from log file" button
47
5.5
The USM 08 test protocol
48
6
RMGVIEW CONFIGURATION
54
6.1
"Generate new cfg-file" button
57
6.2
"Configure Directories" button
58
6.3
"Edit password list" button
58
7
TROUBLESHOOTING
59
7.1
Reference file is absent
59
7.2
cfg-file is absent
59
7.3
Connection to the meter is disrupted
60
7.4
"RMGView is already running..." display
60
7.5
Display "The file USE_112c.rmx …
60
1 INTRODUCTION
1 Introduction
The RMGView diagnostic software supplied with the USM 08 ultrasonic gas meter enables direct
access to the electronic measuring equipment of the ultrasonic gas meter with a standard PC
(system requirements: Windows 2000, XP, 7).
The speed, working memory, and hard drive memory requirements are low. A minimum screen
resolution of 1024 x 768 pixel is necessary for sensible use.
A serial interface is required to connect the USE 09. Standard COM interfaces or USB interfaces
1
can be used. A converter is necessary for USB and standard COM interfaces (RS 485).
RMGView diagnostic software offers the following functions:
o Selecting all available data from an ultrasonic gas meter with the USE 09
o Automatic recognition of the USE09 software version
o Display of the measurement values and parameters as a list
o Password-protected editing option for the USE09 parameters
o Display of the measurement values as a plot (graphics)
o Creation of user-defined lists
o Creation of user-defined plots
o Option of configuring the USE09 (with the calibration switch open)
o Drafting of test reports
o Graphic diagnostic function
1.1 Installation
If you install a new version of RMGView, it is not necessary to uninstall the old version beforehand.
If you have received the program by email, unzip the zip file in the attachment. Boot the RMGView
installer (version number).exe.
If you have received the program on CD, the CD should start up automatically upon insertion. If
this is not the case, navigate to the CD directory and start the RMGView installer (version
number).exe.
The installer will take you through the next installation steps.
2 USM WINDOW
2 USM window
2.1 "Live values"
2
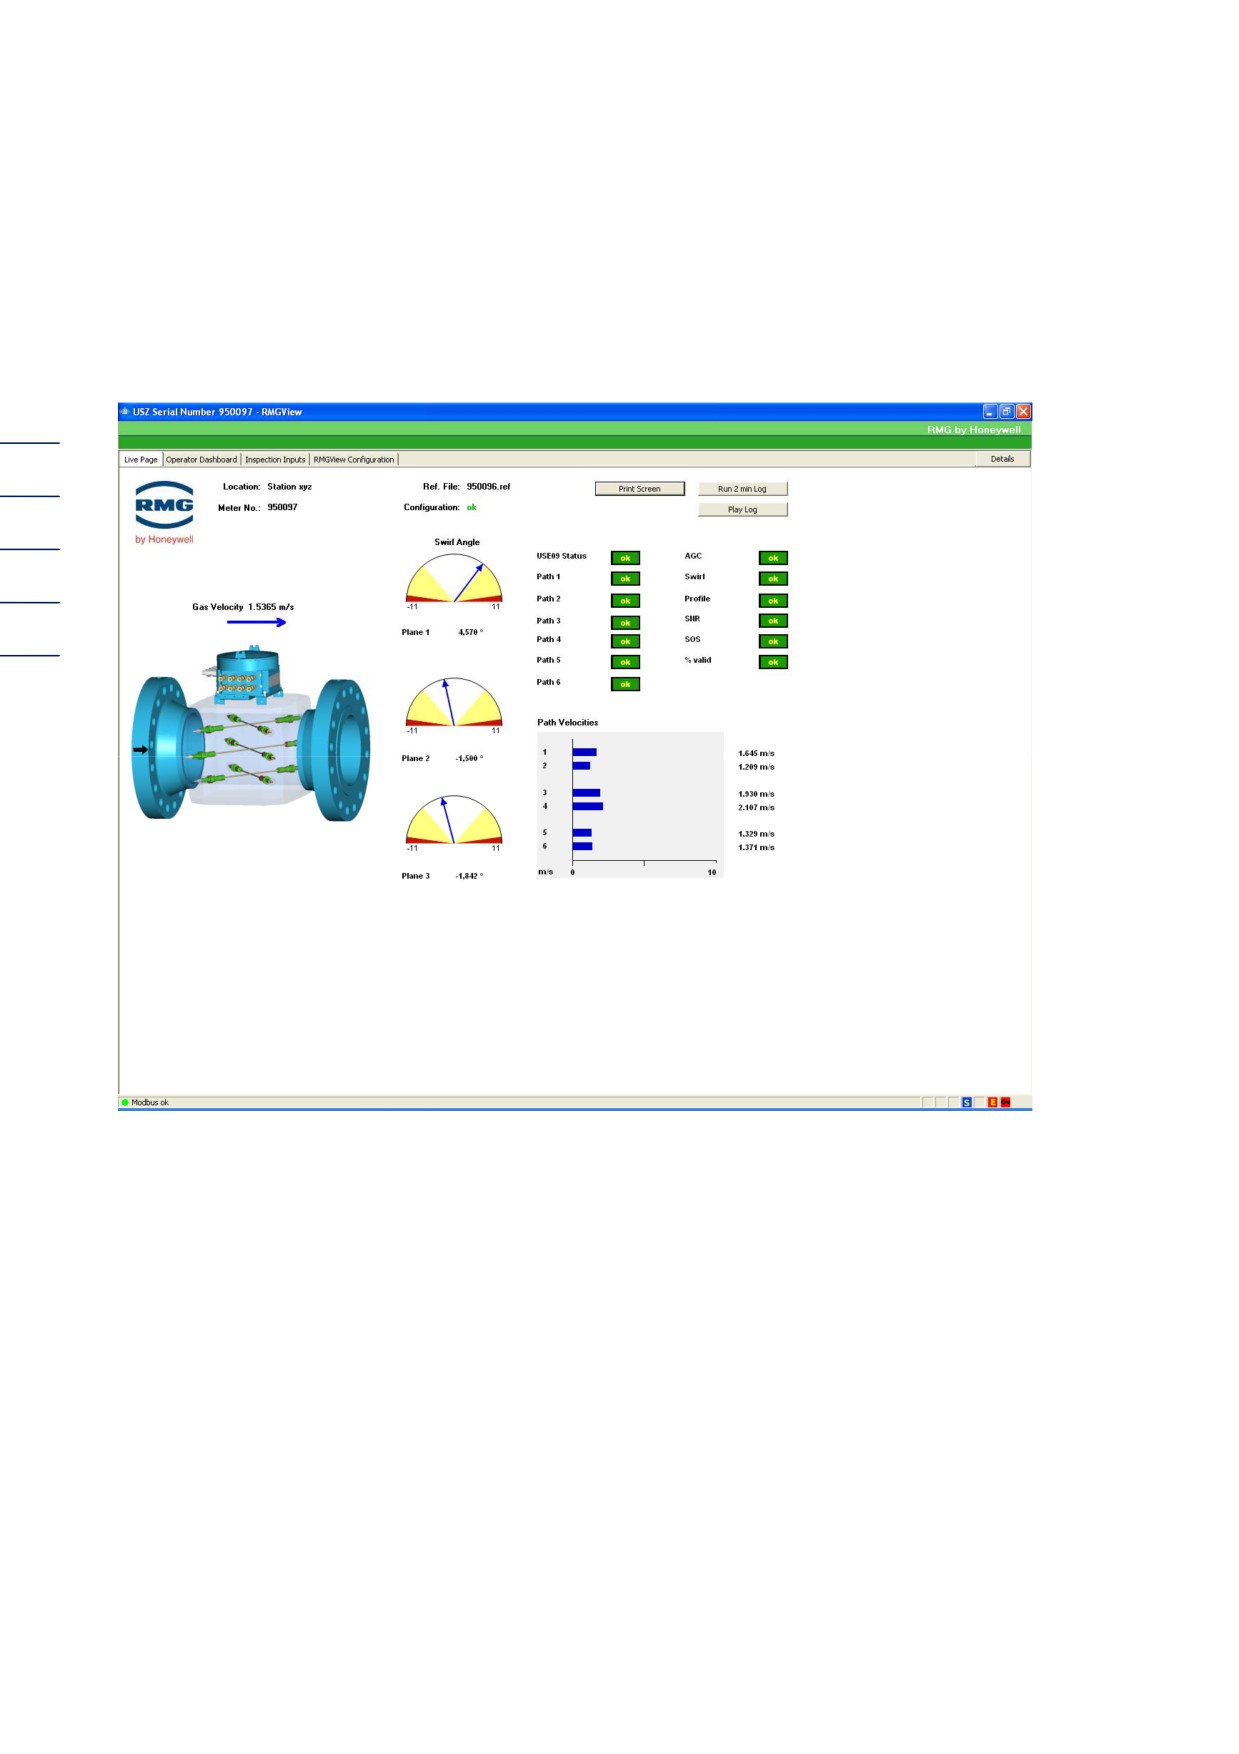
Figure 1: Live values
The "live values" dialog box opens as a launch window.
"Live values" is a display designed with several graphic illustrations and in different colors which
displays the status of the meter graphically and with diagrams.
Firstly, configure the COM interface.
To do so, first click on the "Details" button at the upper right.
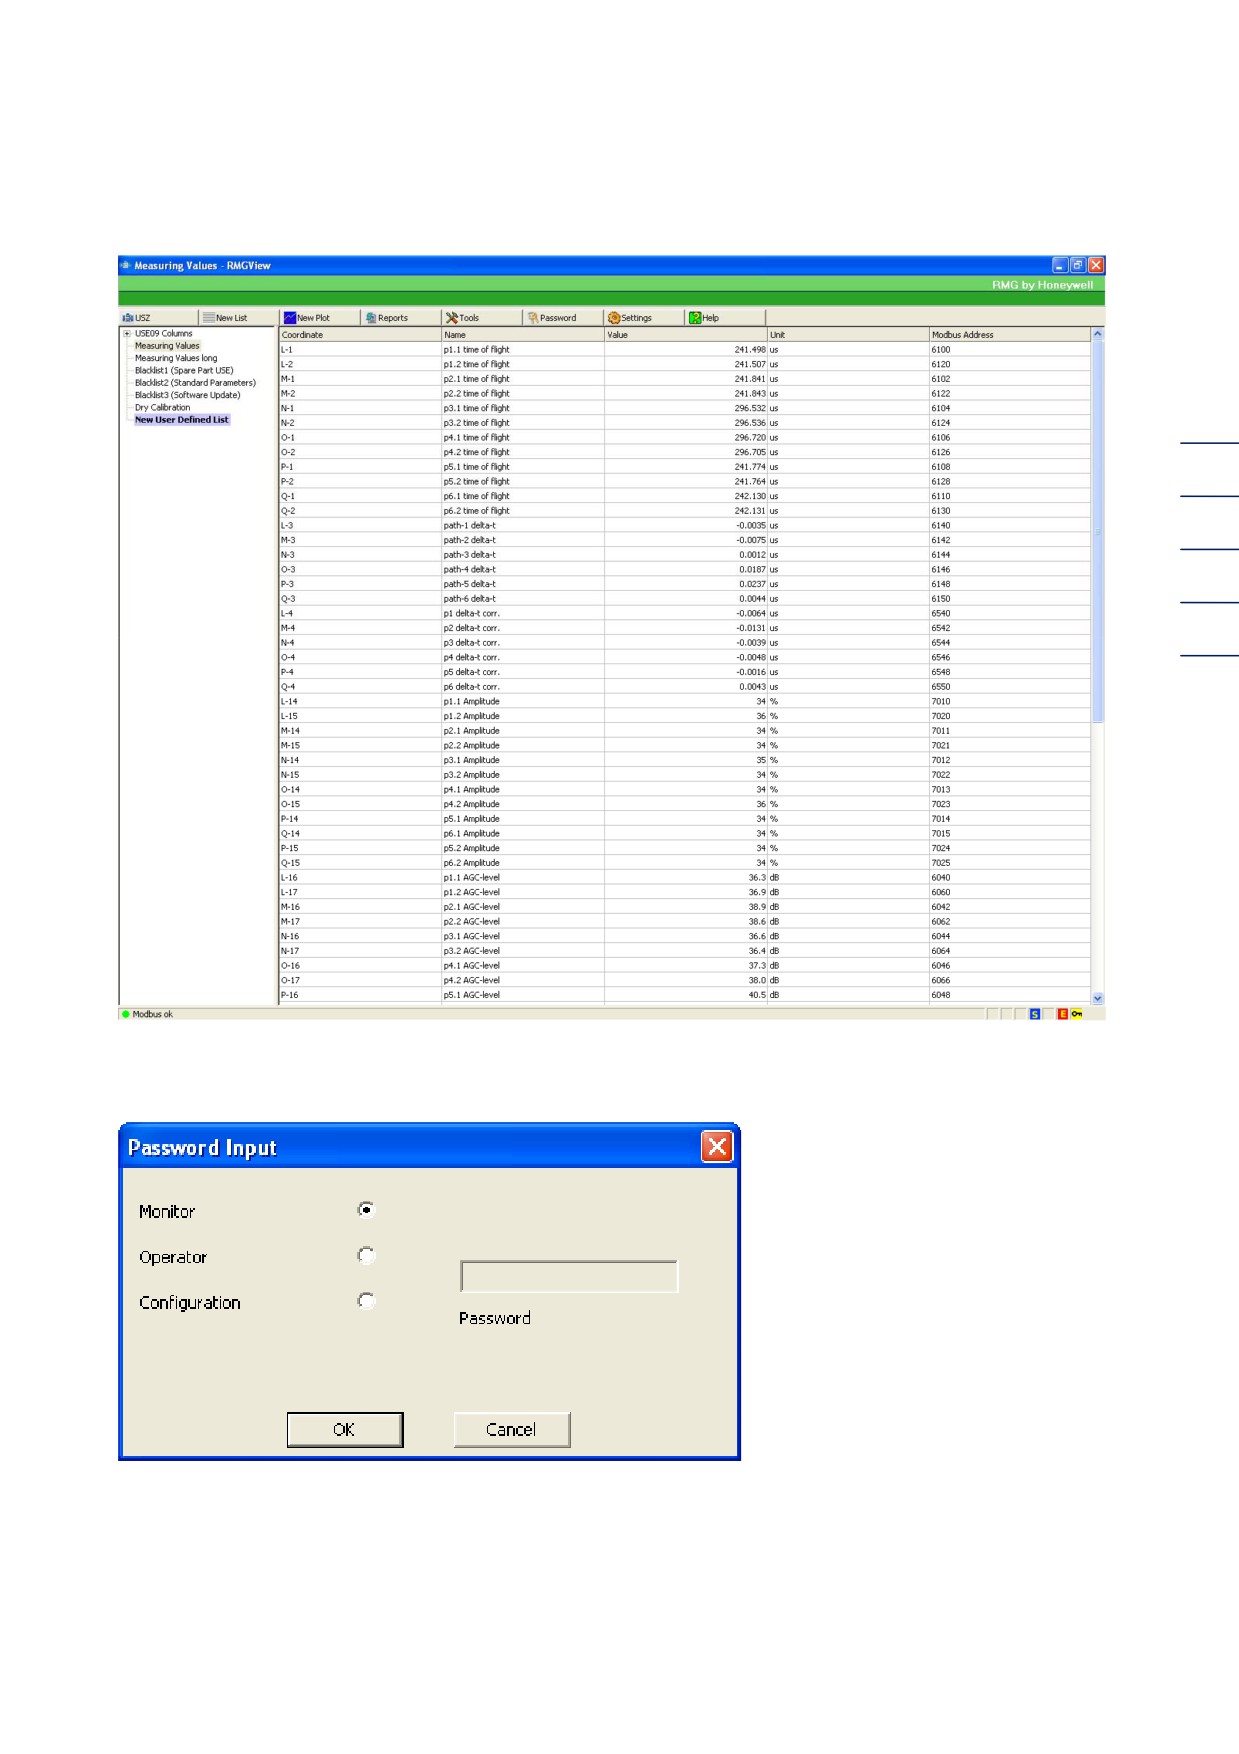
A new dialog box will open: List - RMGView
2 USM WINDOW
3
Figure 2: List - RMGView
When you click on "Settings" you are asked to enter a password.
Figure 3: Input of password
Click on "Configurator," input the password
RMGUSE-P
into the white field above "input password," and click "Ok."
2 USM WINDOW
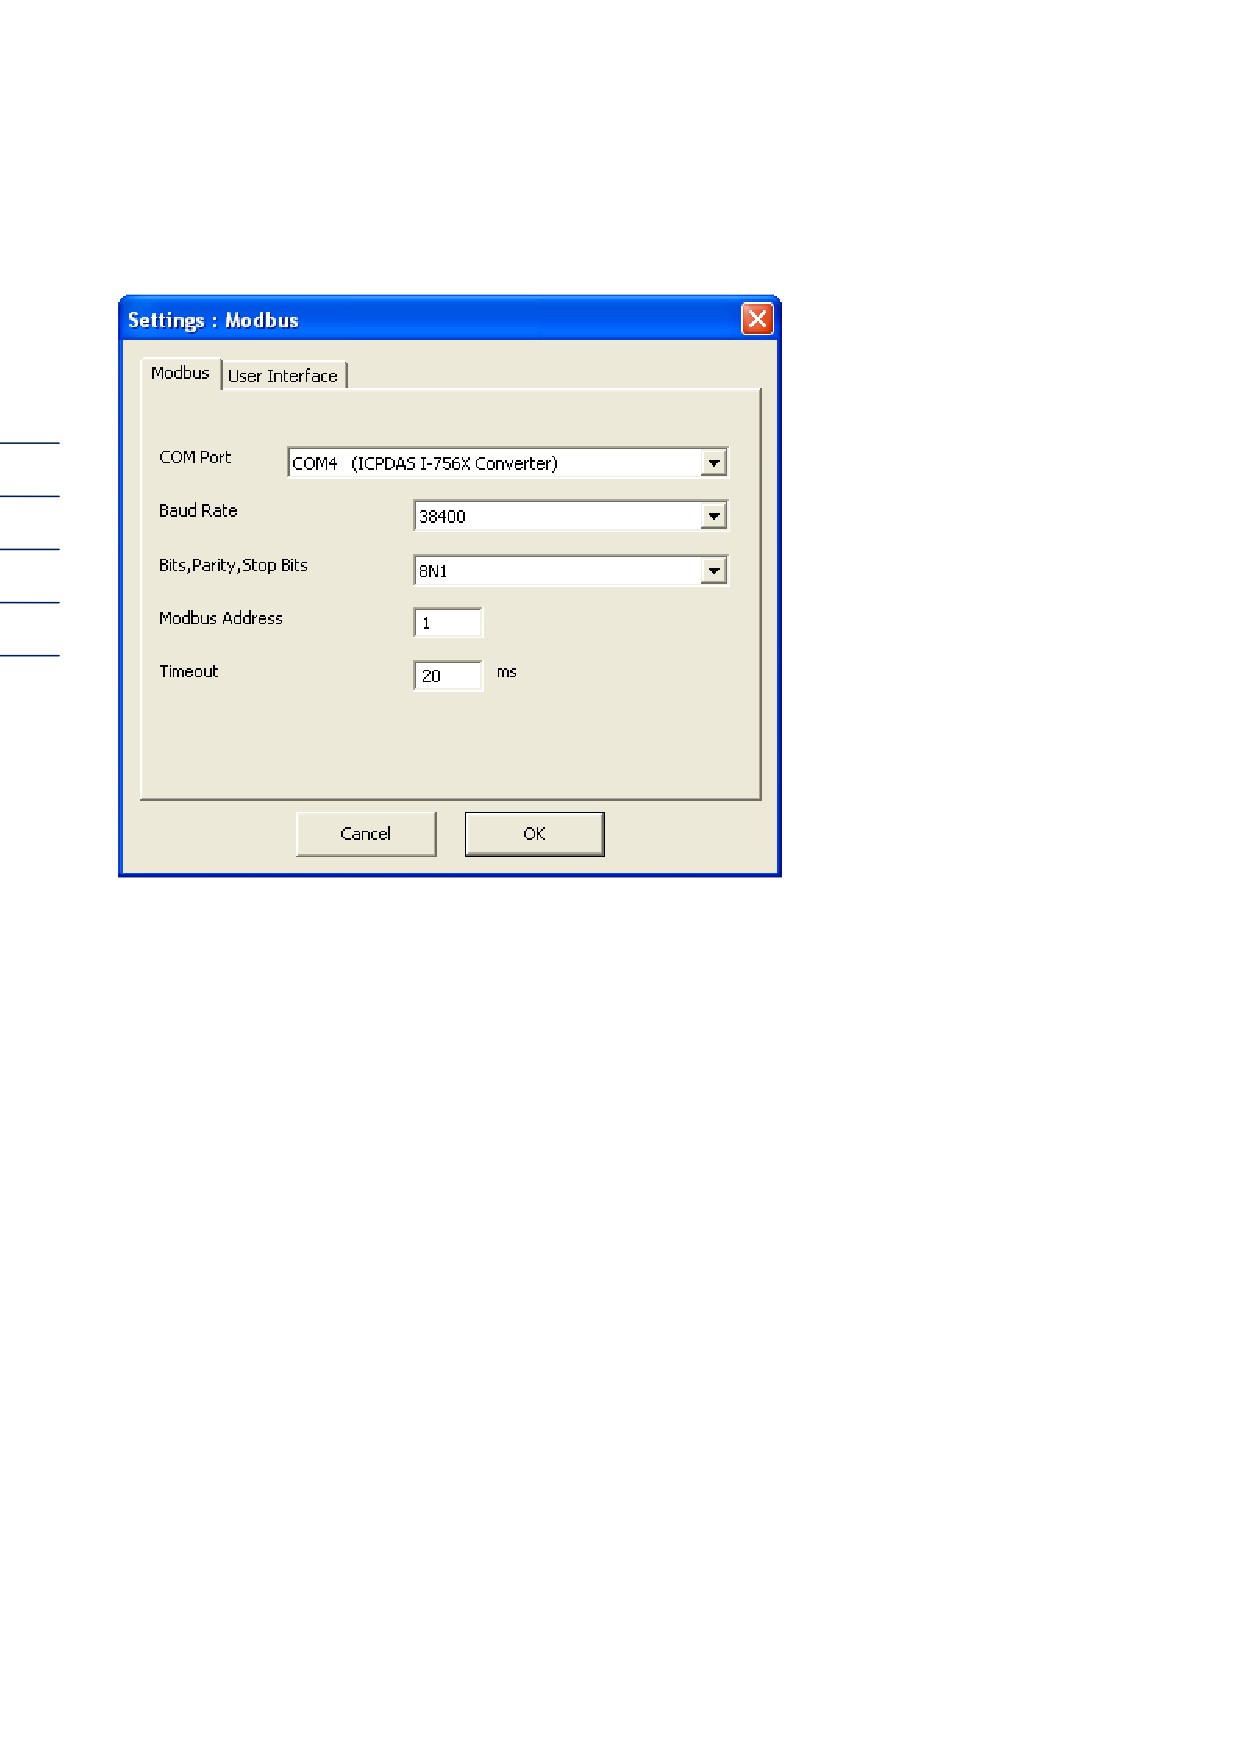
The window appears
4
Figure 4: Settings: Modbus
First of all, set up the Modbus parameters under "Modbus settings." A physical PC - USM 08
connection must exist to this end. Determine a COM port (system-dependent) and select baud rate
38400, bits-parity-stopbits 8N1, Modbus address 1.
Close the "RMG view list" window by clicking on the cross in the upper right and open "Measuring
element no. xxx" underneath again in the status bar. This will take you back to the "Live values"
launch window.
2 USM WINDOW
We will go into the individual illustrations in this window in detail below:
In the upper left, directly adjacent to the RMG by Honeywell logo, the location (e.g. the station) and
the measuring element number of the ultrasonic meter are displayed.
5
Figure 5: Location and measuring element information
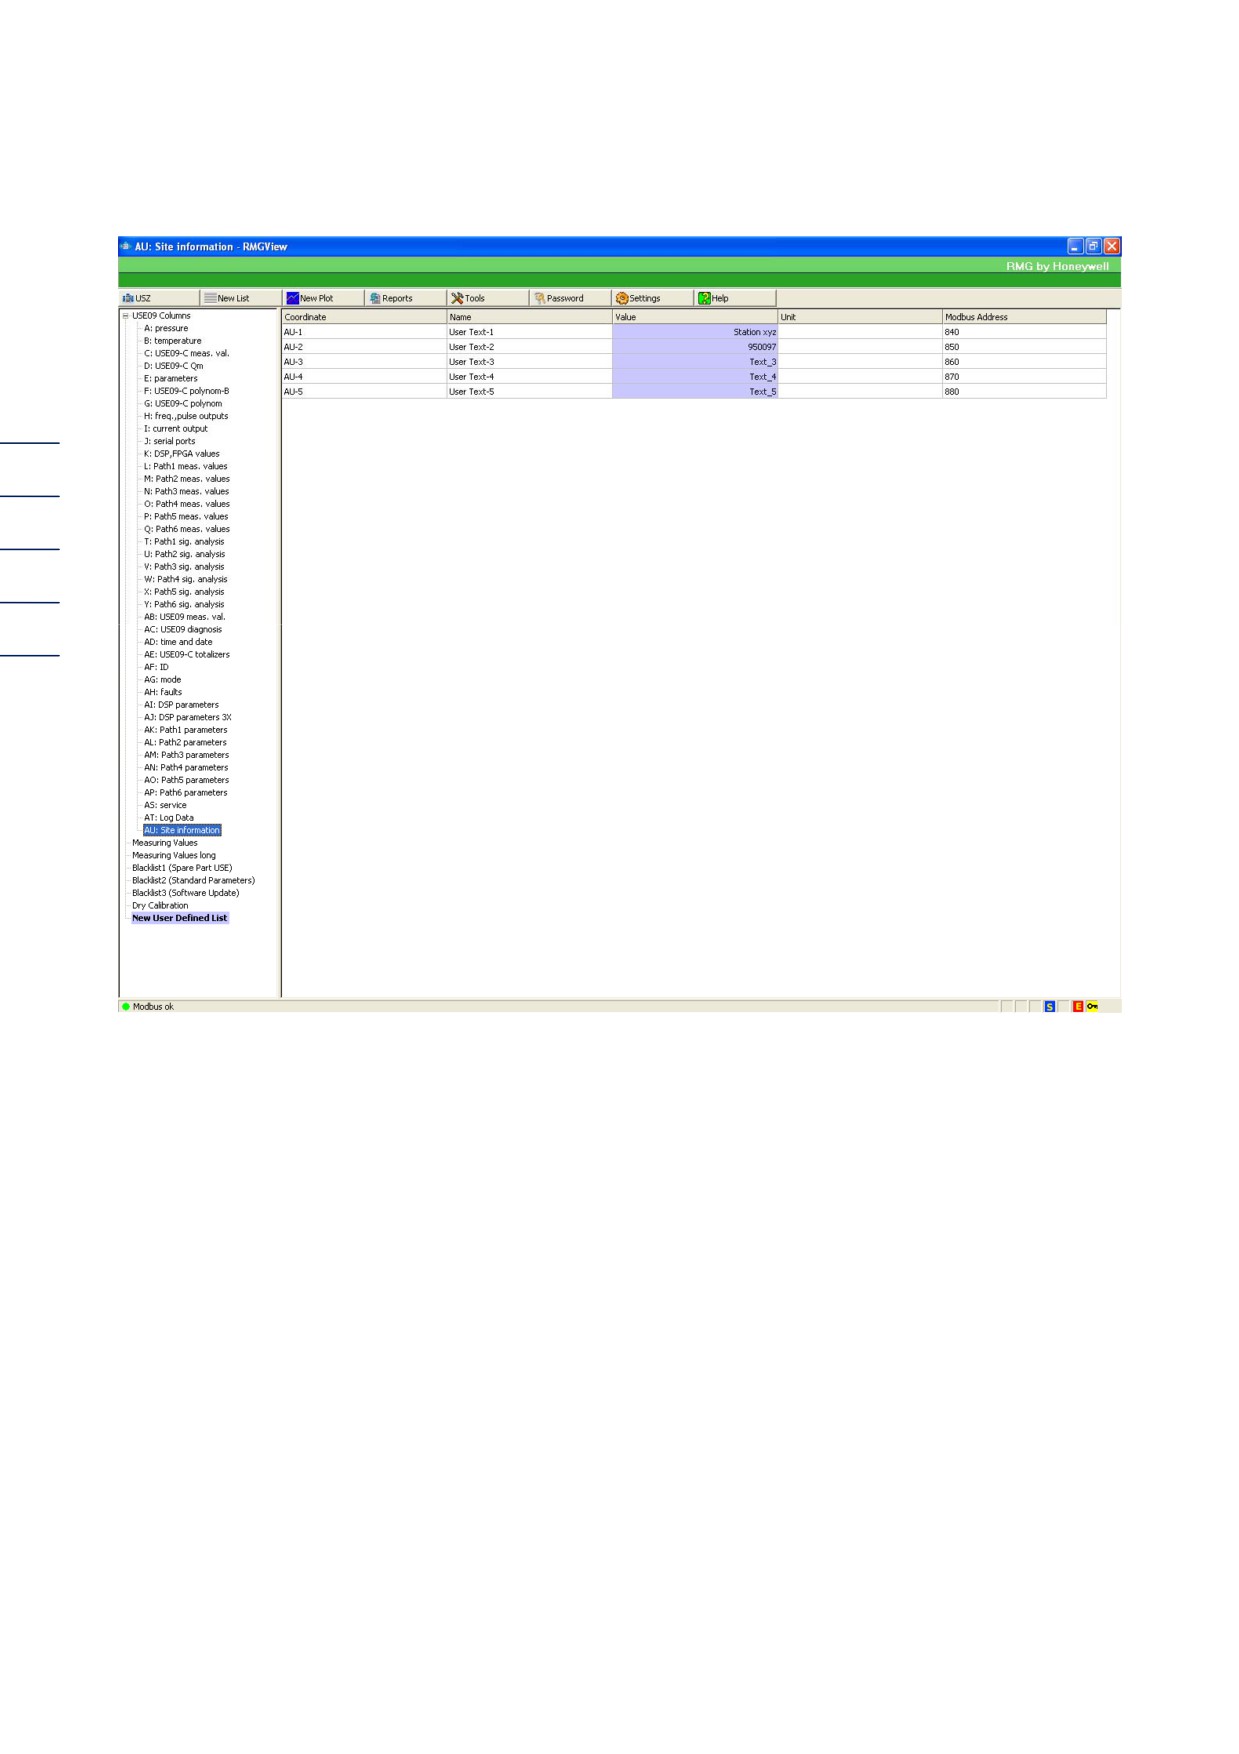
The content of the AU-1 coordinate is displayed under location according to conventions.
The content of coordinate AU-2 can be found under Measuring element.
Procedure:
-
Go to the upper right button "Details" in the "Live values" window.
-
In the upper left you will see "+USM 09 columns"
-
Click on the + symbol
-
The list opens with all tables available for the measurement values
-
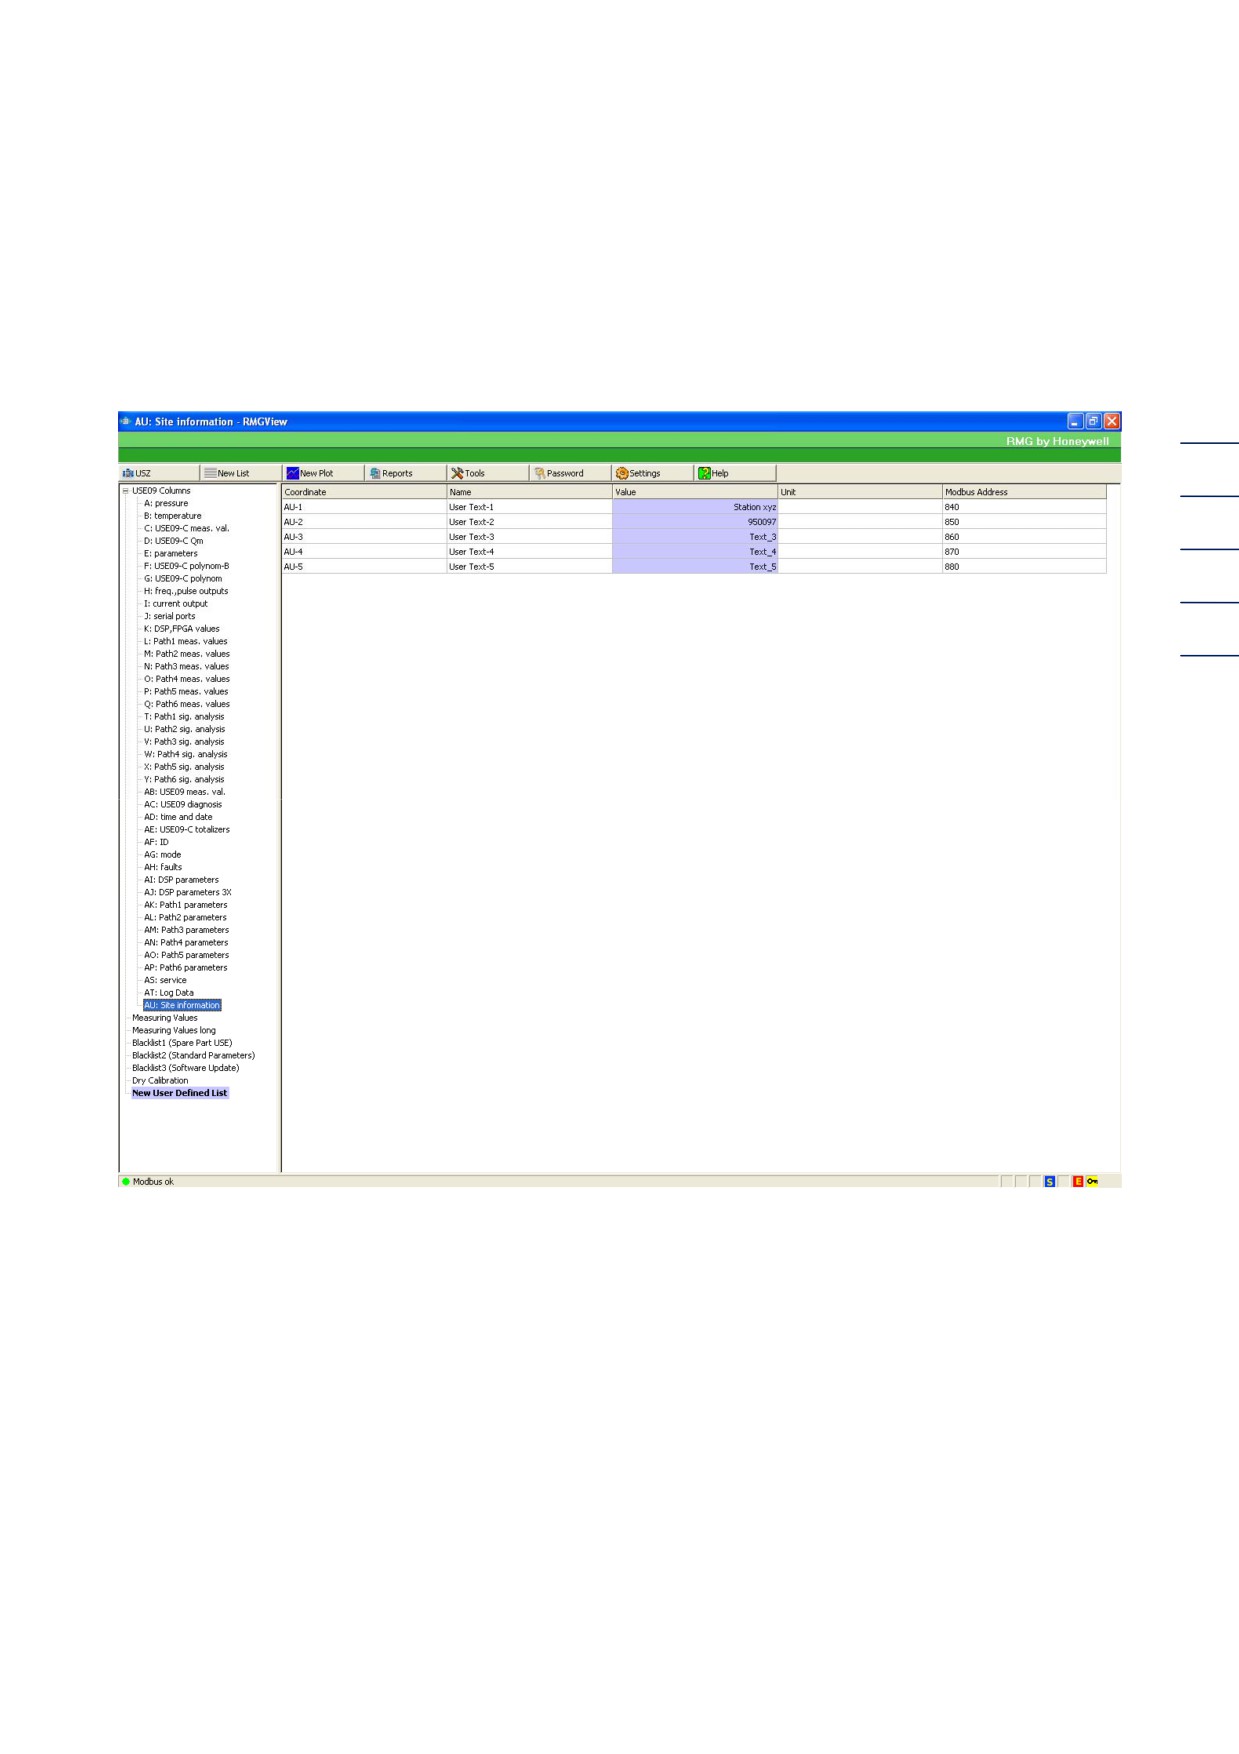
At the bottom of the file, click on "AU: user info" and a table into which you can input your data
appears on the right. At the very top you will find
Coordinates
Name
Value
Unit
Modbus address
AU-1
User text 1
Text_1
840
AU-2
User text 2
Text_2
850
….
The fields with a purple background can be changed at will, dependent on authorizations. This applies to all
tables.
Now enter the name of your location in User text 1.
2 USM WINDOW
6
Figure 6: List USE 09, coordinate AU: User info
2 USM WINDOW
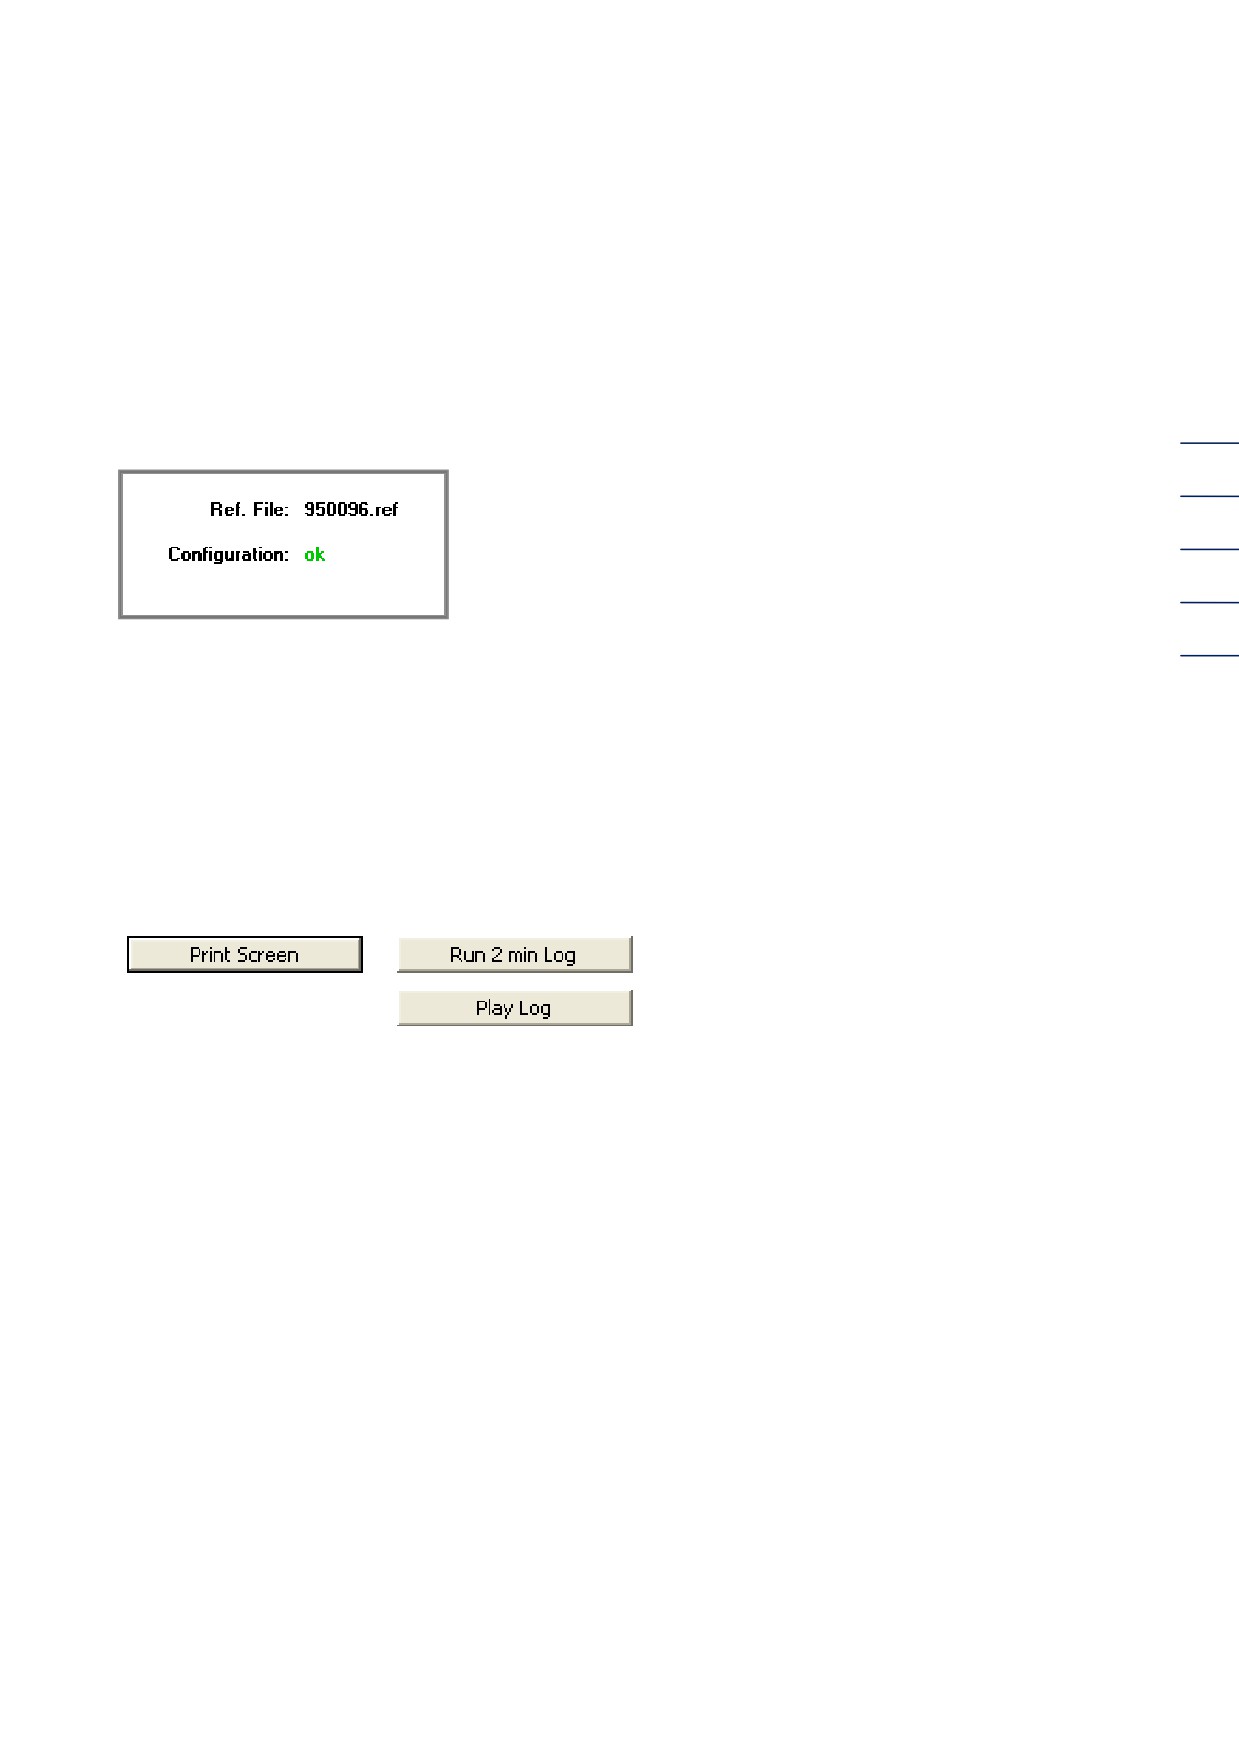
Back in the Live Values window, you will find the loaded reference file on the right, adjacent to the
location and the measuring element number. The reference file is the comparative basis for
measurement values (see test protocol). The display for the loaded configuration should be green
("Ok").
RMG View compares the parameters of the connected USM with the parameter set saved in the
pertaining cfg file (measuring element number-cfg) in the background. The result (Ok/Error) is
displayed depending on the configuration.
7
Figure 7: Reference file and configuration status
The buttons are situated on the right
"Print Screen" (generates a pdf file of the screen with the date and time)
"Record 2 min log" (records the data from the meter for 2 minutes, a window opens "Log is
running…," select name for log file and click Ok) and
"Play back log" (the record stored in the log file is played back with the aid of the RMGView
log player).
Figure 8: Printing, recording, and playback buttons
2 USM WINDOW
2.2 USM 08 ultrasonic meter:
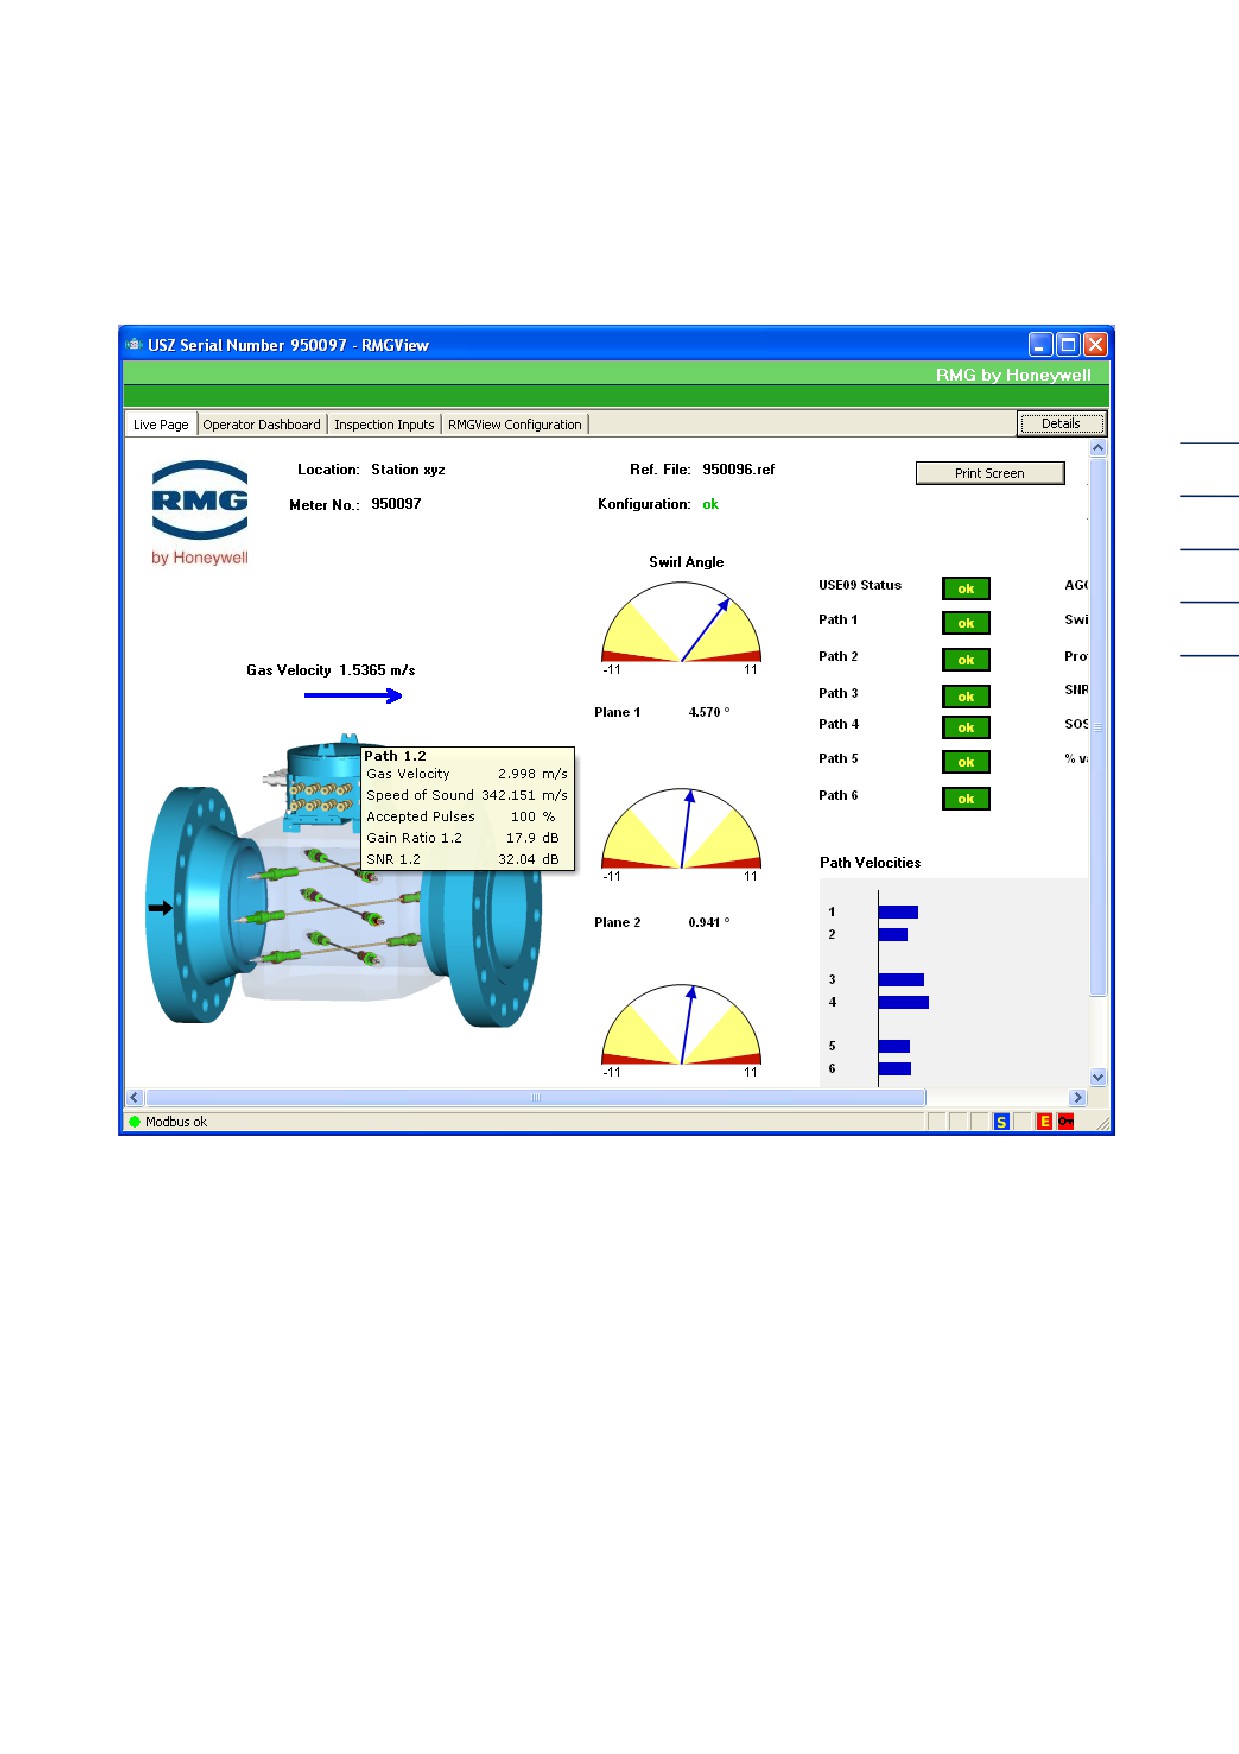
The ultrasonic gas meter is depicted in a diagram in the lower left. The actual state of the USM 08
is displayed. The measurement electronics, the configuration of the sensors, and the 6 paths can
be recognized. If the measurement electronics are blue, the status of the meter is Ok. This is also
displayed in the graphics on the right. The green color in the small box adjacent to "USE09 status
Ok" shows that the status is fine. If the measurement electronics are red, a red error notification
appears in the same small box (see under "Status displays"). The same applies to the six
8
measurement paths. These are green in their error-free state and red in the event of errors. If the
cursor arrow is directed onto the path, information on the status can be obtained (see "Detailed
path information"). In the case of error, the cause of the error is also displayed here.
The current gas speed is displayed via the measurement electronics. The blue arrow beneath
states that this measurement is a "forwards" measurement (from left to right). For a "backwards
measurement" (right to left), the arrow is red and points in the other direction.
Figure 9: Ultrasonic gas meter with status display
2 USM WINDOW
2.3 Detailed path information:
9
Figure 10: Detailed information
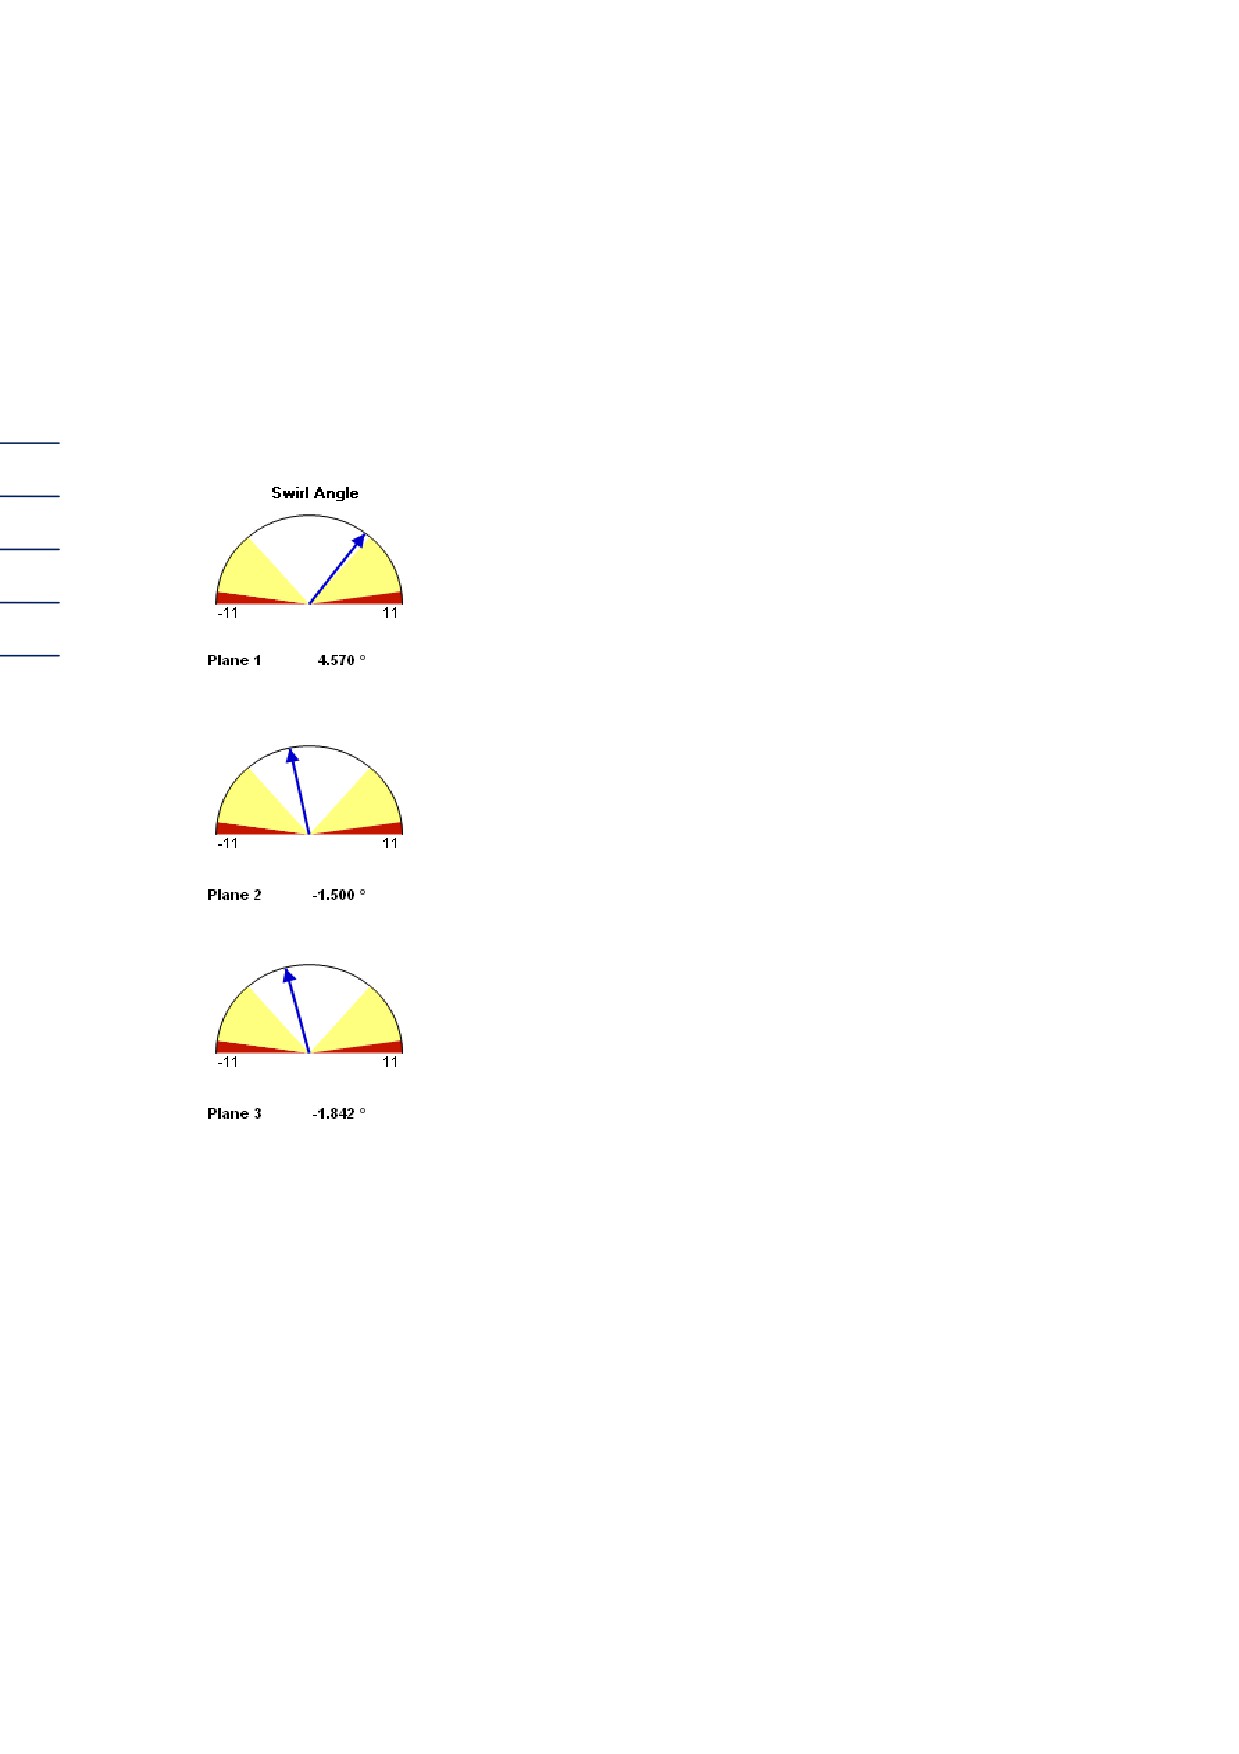
If you hover over one of the sensors with the mouse cursor without clicking, an information window
opens which displays the following current values via the path clicked on (e.g. for path 1,
direction/sensor 2):
Path 1.2
Gas speed:
2.998 m/s
Speed of sound:
342.151 m/s
%valid:
100 %
AGC ratio 1.2:
19.9 dB
SNR 1.2:
32.04 dB
This information is available for all sensors.
2 USM WINDOW
2.4 Angle of swirl:
The three diagrams adjacent to the meter on the right display the angle of swirl of the three levels.
Ideally, the total of all three angles of swirl should be equal to 0°. If the total of the three angles of
swirl is not equal to 0°, the flow profile is not completely recorded and the measured flow might be
lower or higher than the real flow.
10
Figure 11: Angle of swirl
2 USM WINDOW
2.5 Status displays:
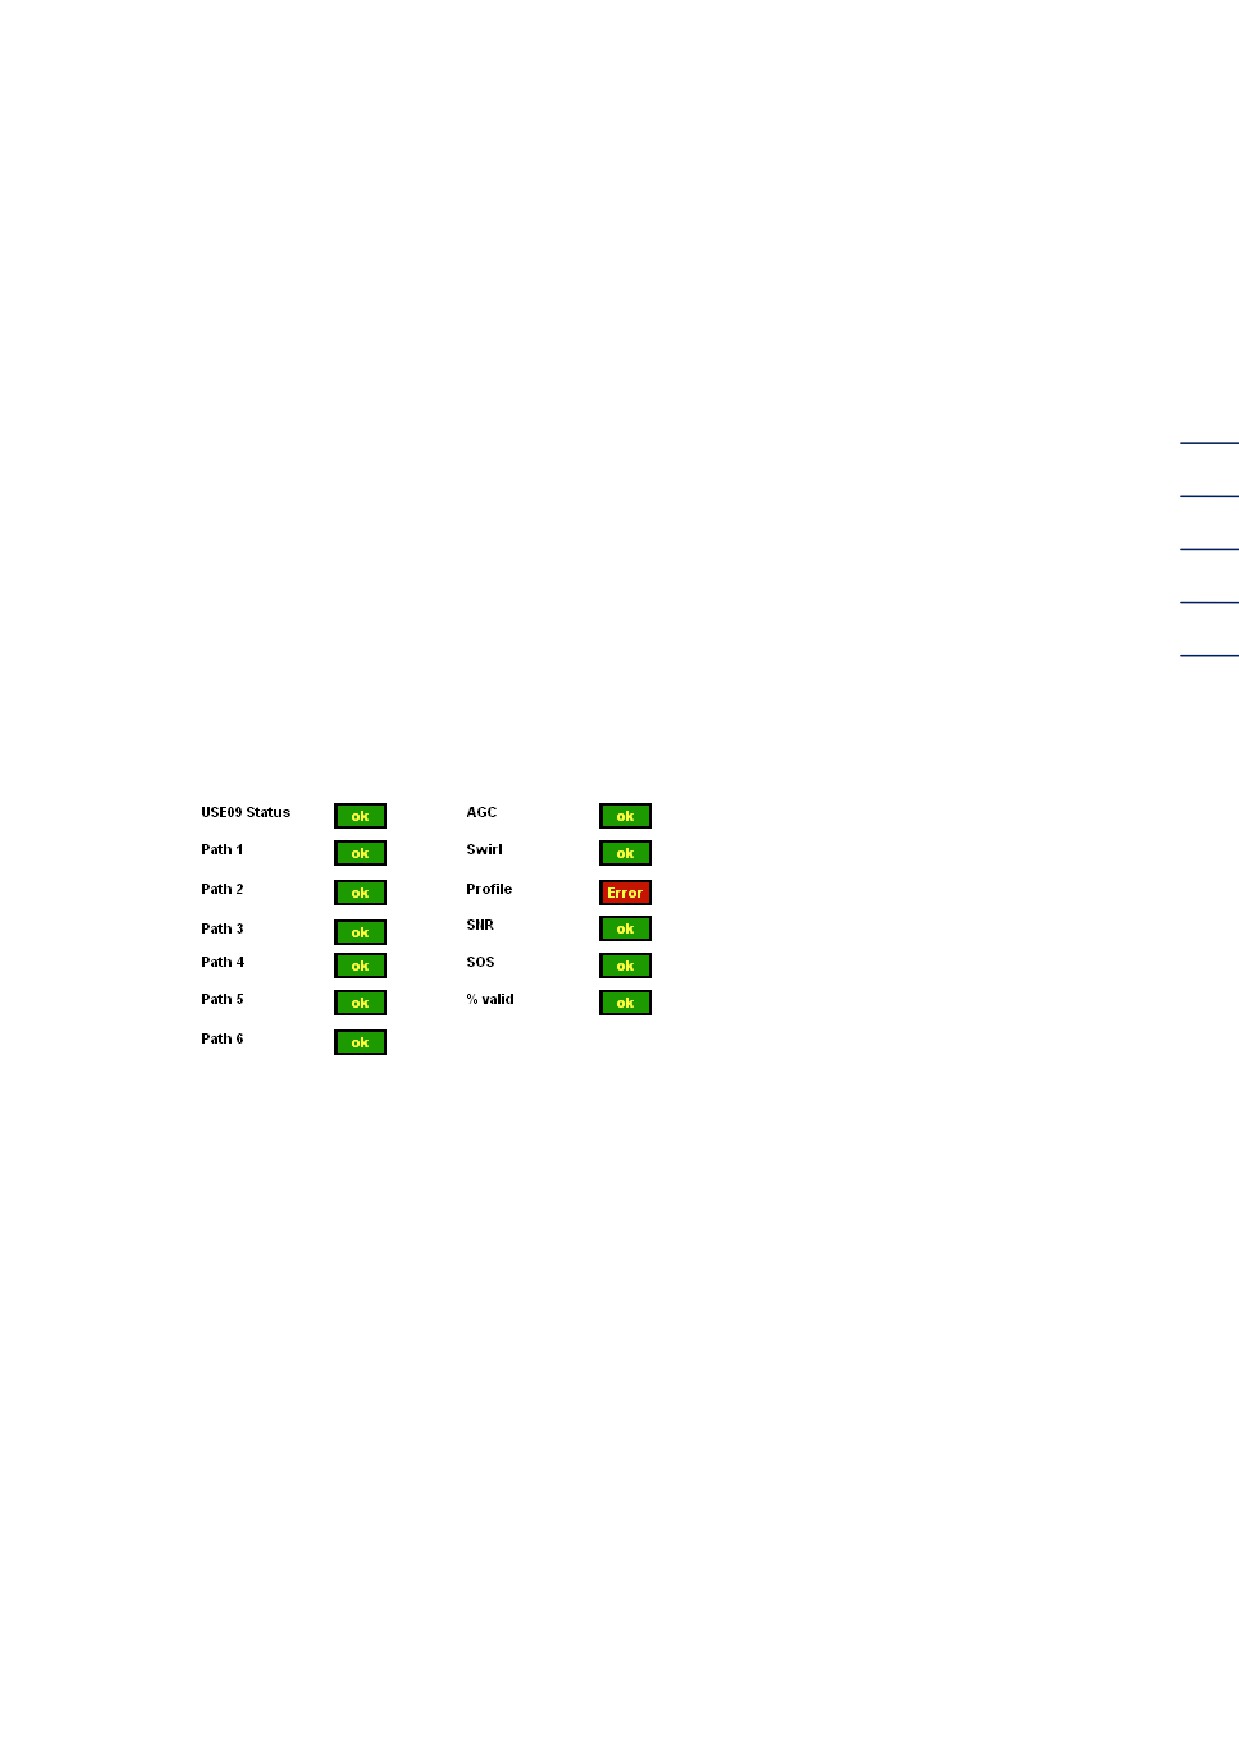
On the right you will find the status displays for USE 09 and paths 1 to 6.
You can also verify the status displays here from:
-
AGC (Automatic Gain Control),
(valid reference file necessary)
11
-
Swirl,
-
Profiles,
-
SNR (Signal-to-Noise Ratio),
-
SOS (Speed of Sound); deviation from the calculated speed of sound.
Gas quality and operating conditions (inputted under test values) must concur.
-
%valid (number of valid measurements) displayed.
If everything is fine, the status "Ok" is displayed in green. Where there are error trends, the display
changes to "Warning" in yellow and then to "Error" in red.
Limit values are test values.
Figure 12: Status display
2 USM WINDOW
2.6 Path speeds:
12
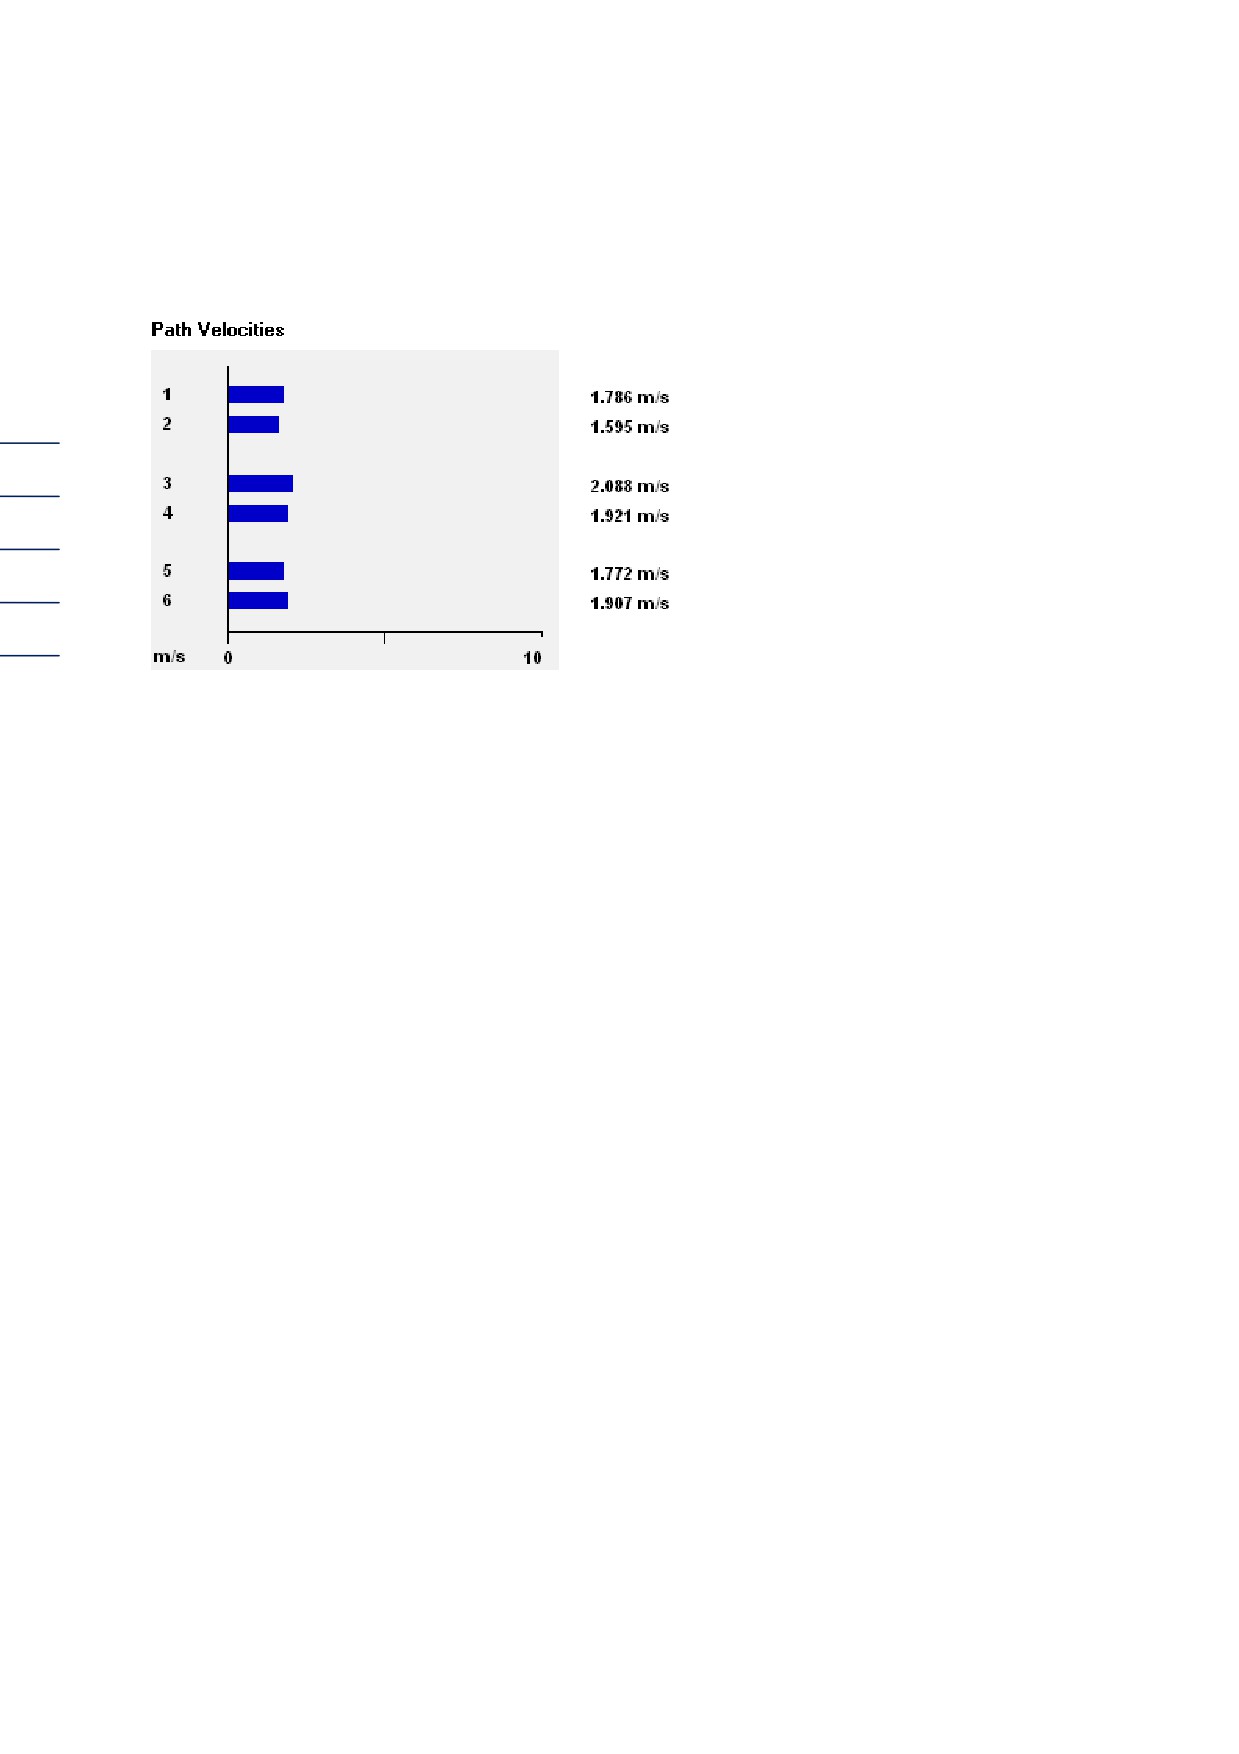
Figure 13: Path speed
A diagram is located below the status display which outlines the path speeds. If everything is working
correctly, the middle level (paths 3 and 4) should show the highest speed.
The
-
Instrument panel
-
Test values
-
RMGView configuration
masks are only visible after a password is entered.
Three different user levels are available, two of which can only be reached by inputting a
password.
Monitor: no password required. The "Live values" window and the masks under the "Details"
button can be called up and viewed in this level. You cannot change any parameters.
Operator: password required.
Configurator: password required.
3 "RMGVIEW LIST" WINDOW
3 "RMGView list" window
13
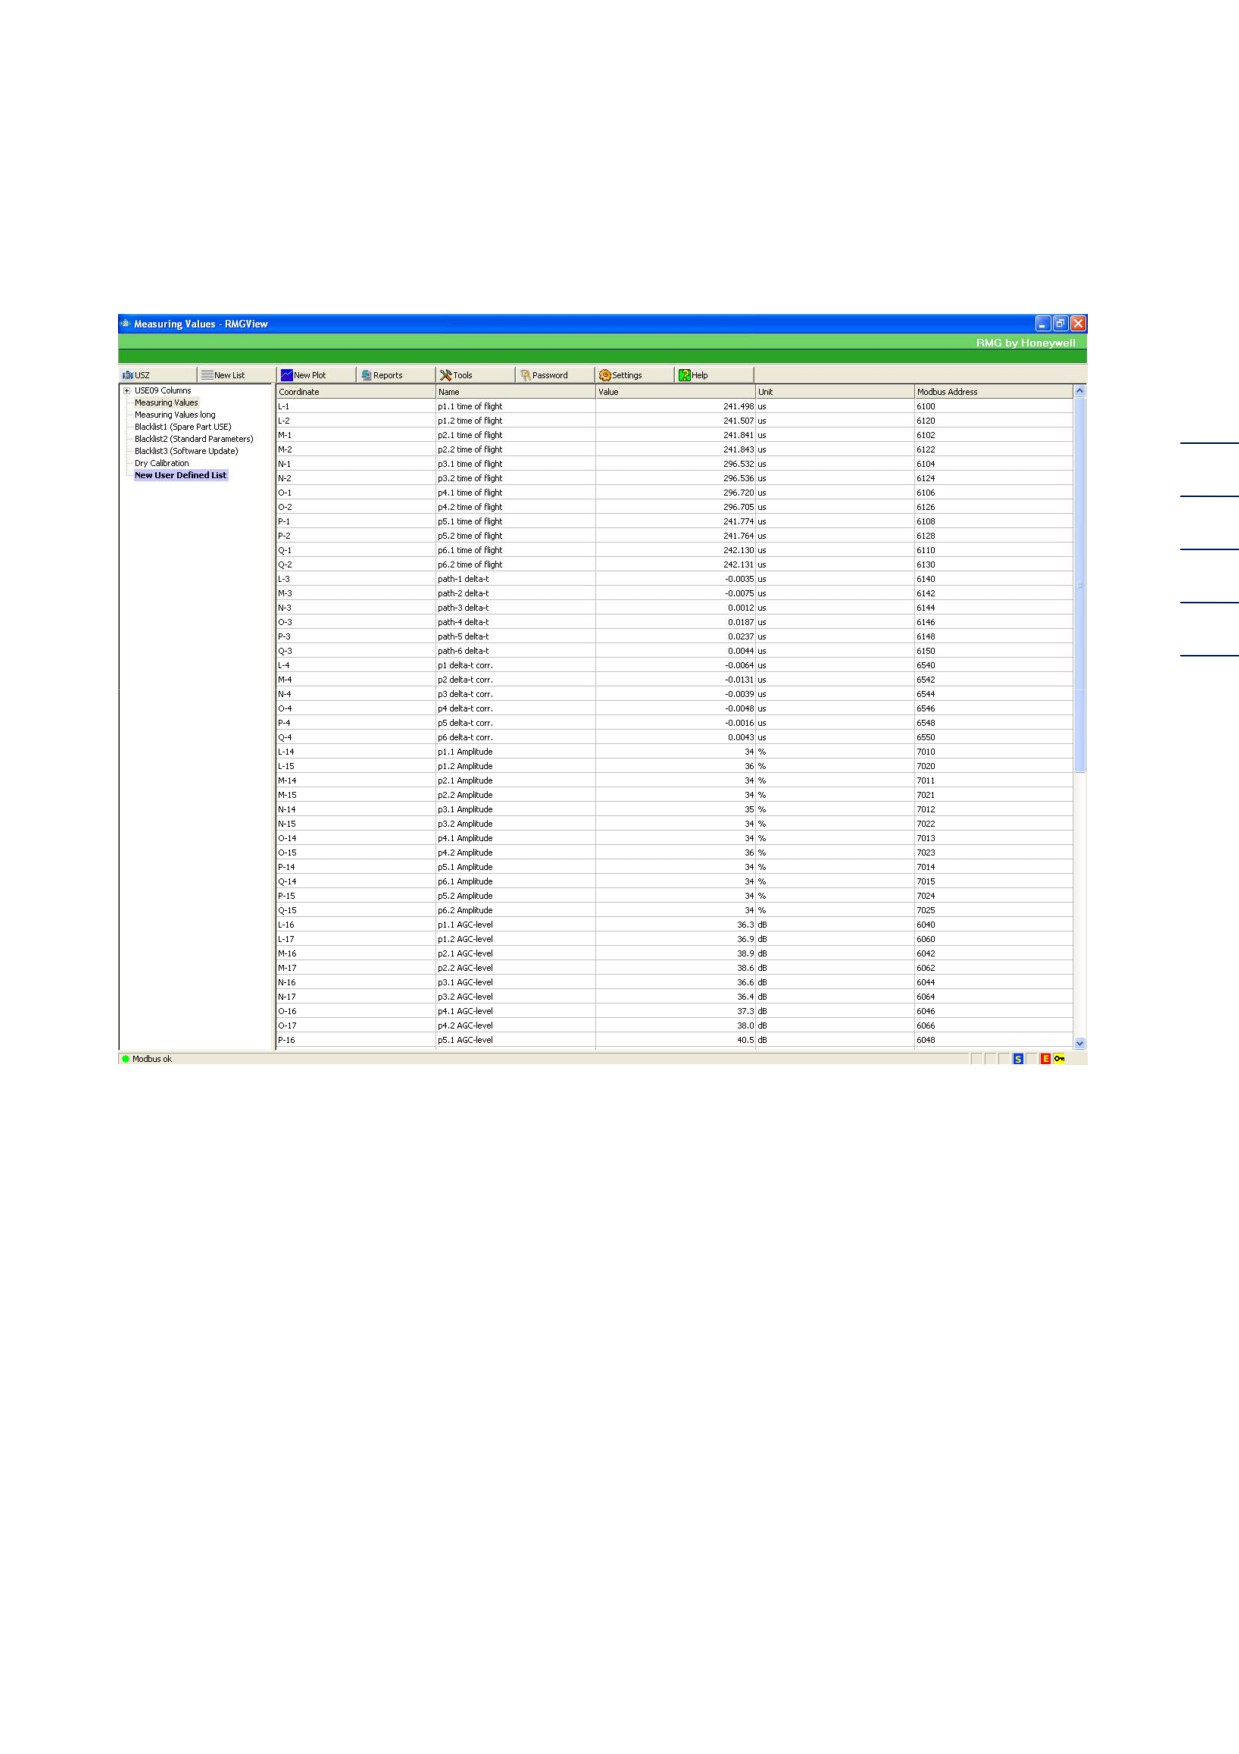
Figure 14: The "RMGView list" window
Press the "Details" button at the upper right of the "Measurement element no. xx - RMGView"
window, the aforementioned "RMGView list" window appears.
The toolbar buttons can be found in the upper section of the "RMGView list"
o "USM" (USM overview mask)
o "new list"
o "new plot"
o "protocols"
o "tools"
o "password"
o "settings"
o "help"
These windows belong to the same program. A new window opens each time one of these
commands is executed. The program is terminated when you close the final window. The size of
the windows can be changed. Opening too many windows slows down updates of the values
displayed.
3 "RMGVIEW LIST" WINDOW
To the lower right of the screen you will find a status bar which contains the following information:
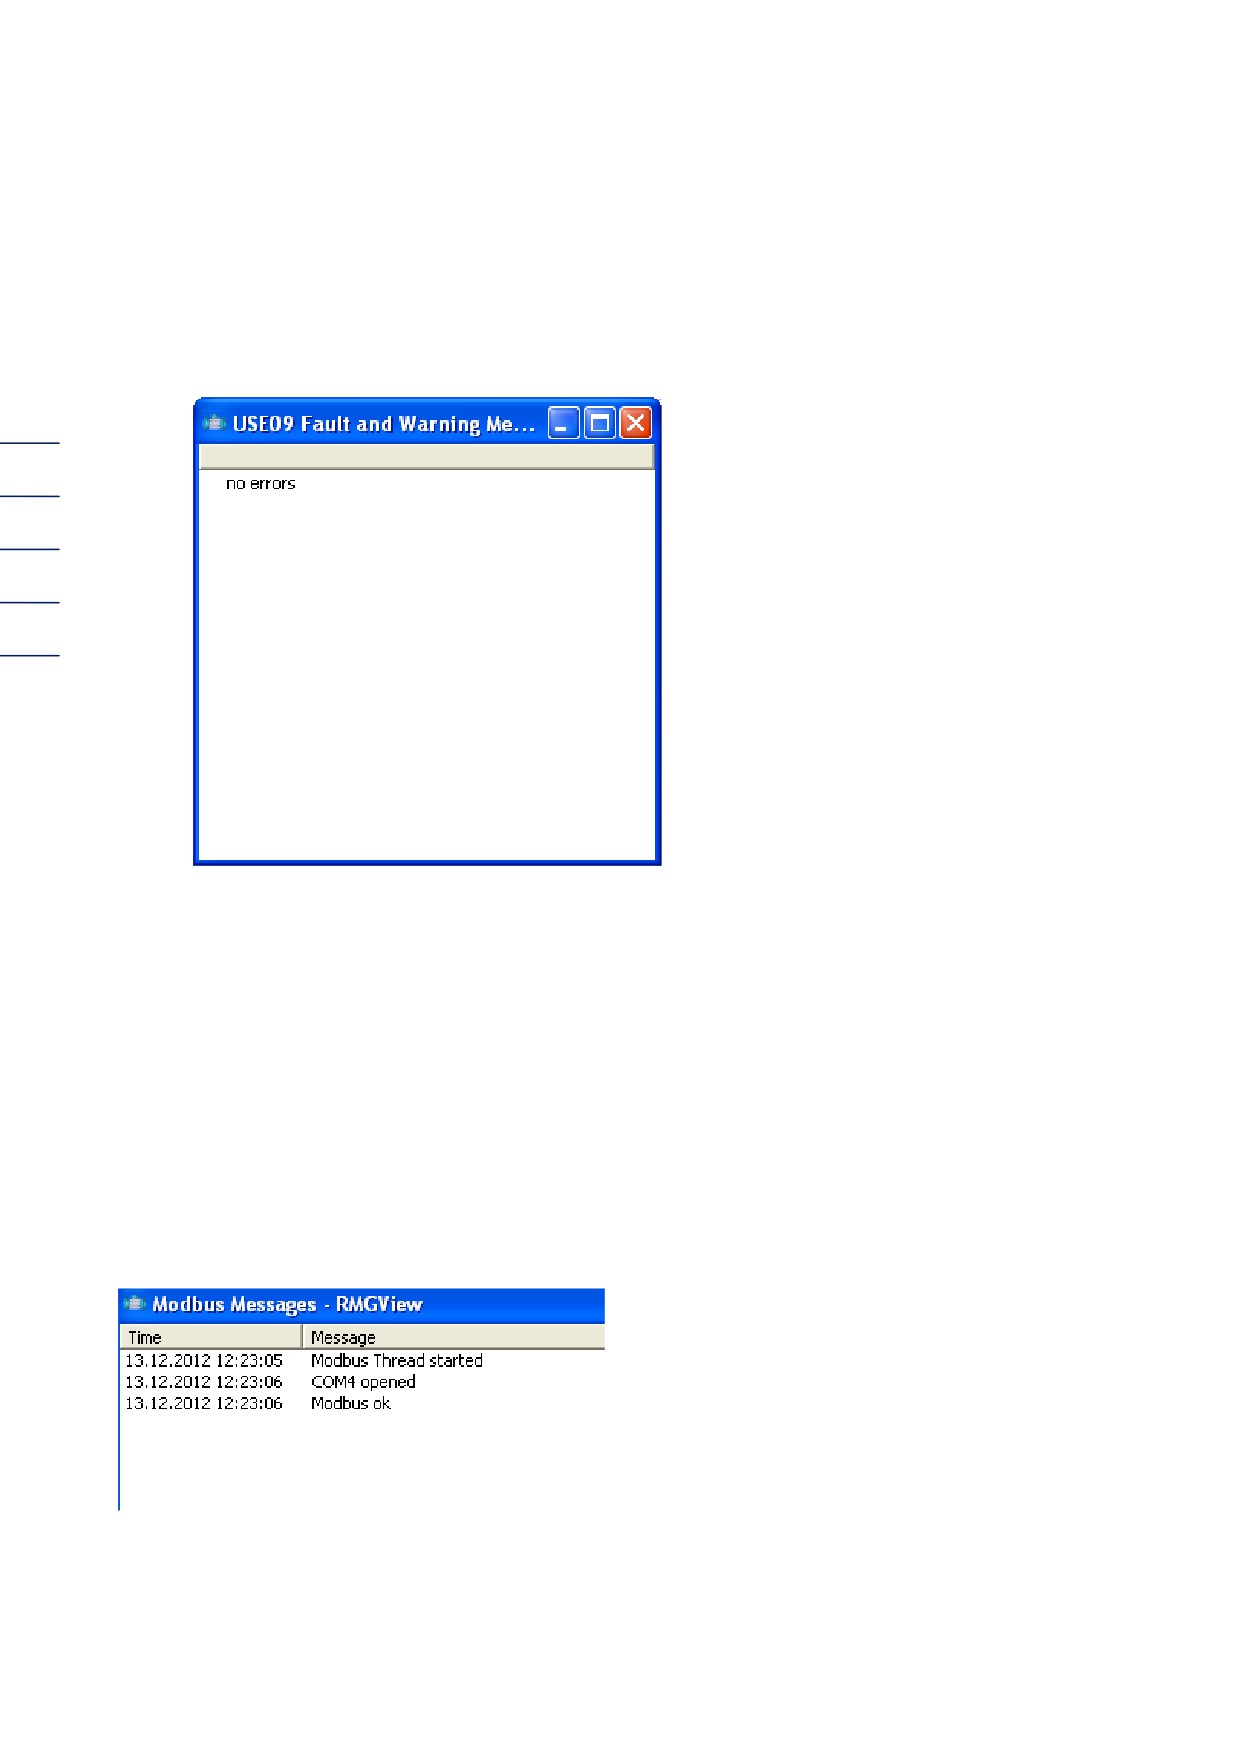
o USE09 error notifications and USE09 warning notifications (double-click on the first or
second empty field from the left on the right-hand side)
14
Figure 15: USE09 error and warning notifications
o USE09 battery status
o USE09 service switch (blue means "open")
o Code word USE09
o USE09 calibration switch (red means "open," when the calibration switch is open,
parameters relating to the Office of Weights and Measures can be changed in the
configuration mode)
o Access level (a key is displayed on a yellow background in configurator mode)
There is a Modbus connection indicator at the lower left. The following window opens by double-
clicking on "Modbus Ok:"
Figure 16: Modbus notifications
3 "RMGVIEW LIST" WINDOW
By clicking on the "Details" button at the upper right in the USM 08 measuring element window,
you can open the "RMGView list" window.
The individual buttons are listed on page 15 of this documentation. A list of displayable parameters
with relevant coordinates opens at the top left by clicking on the + symbol in front of the USM09
columns.
15
Figure 17: Example of a table with Live values
3 "RMGVIEW LIST" WINDOW
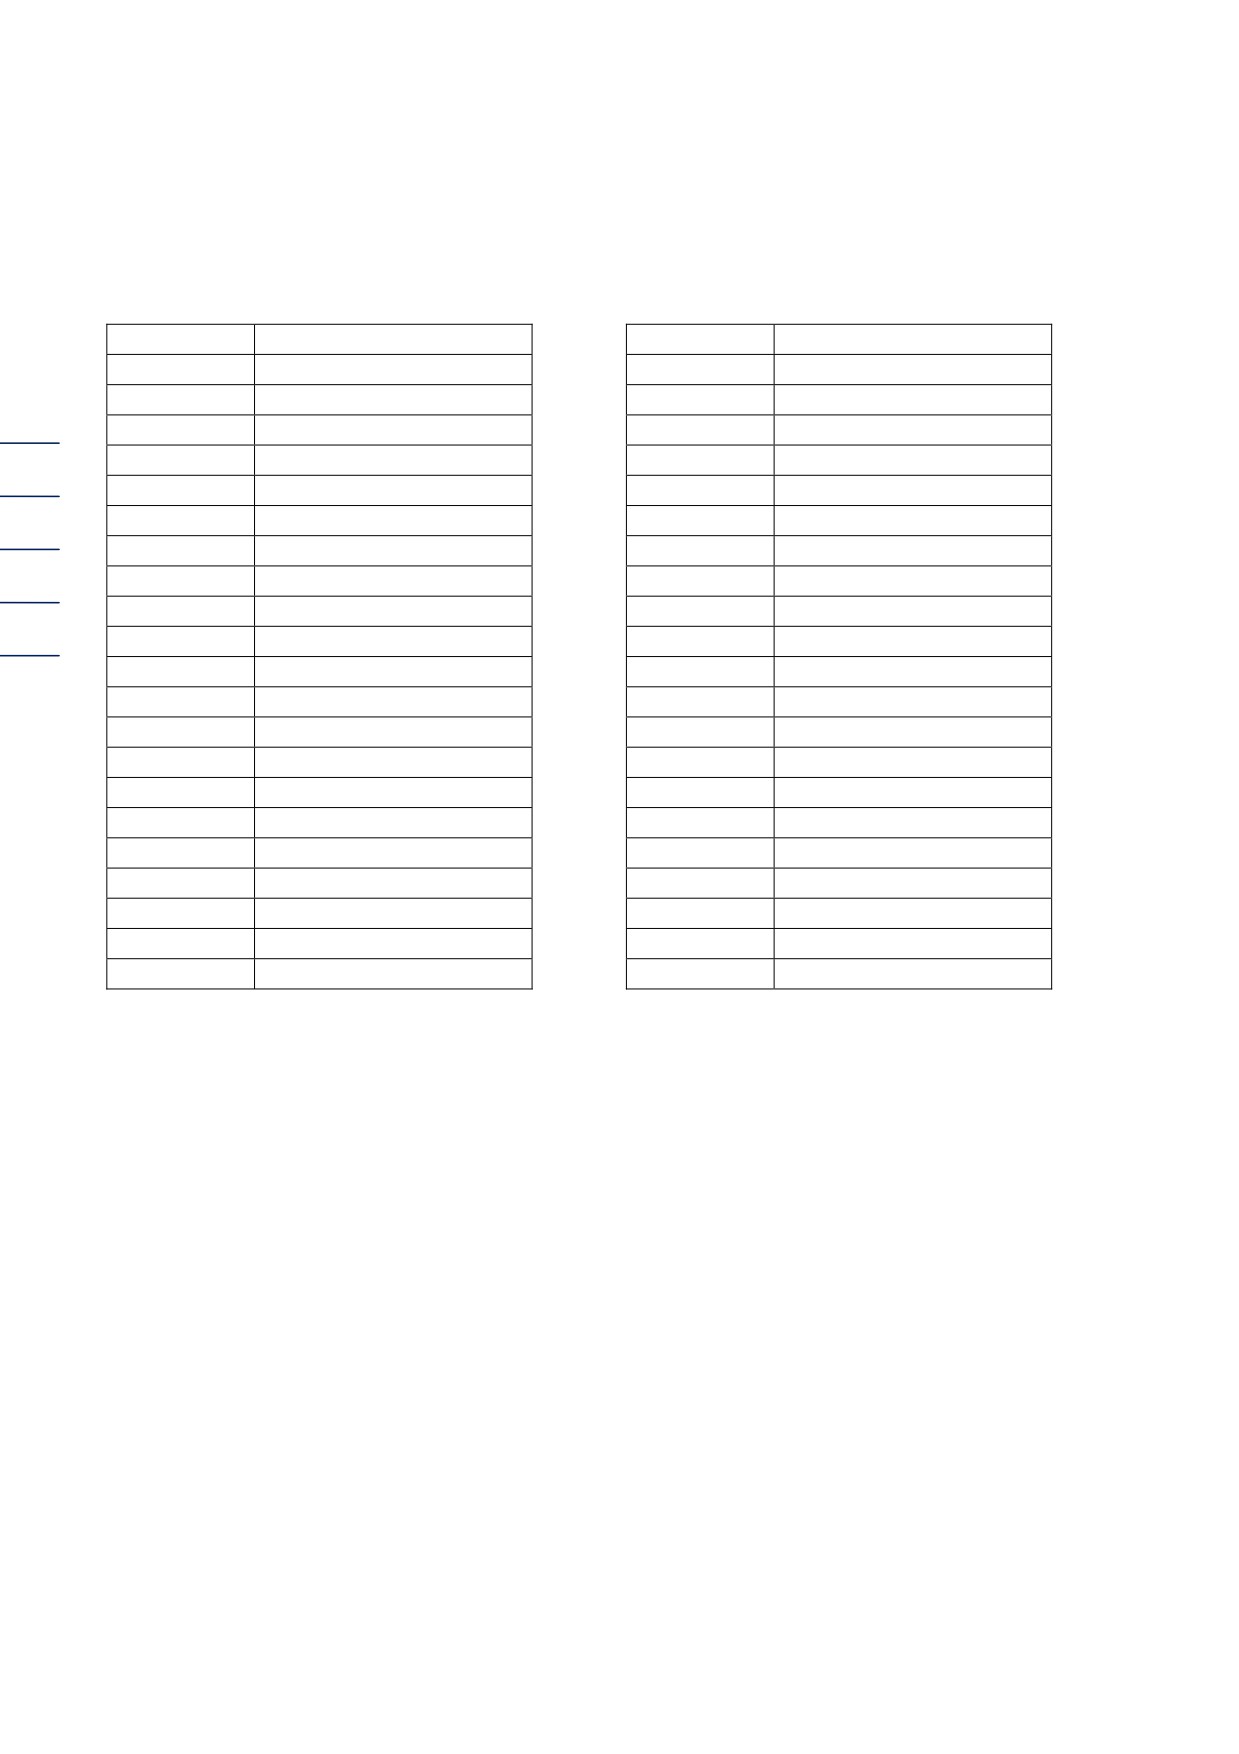
Here is an overview of the displayable parameters with the relevant USM09 columns.
Coordinates
Name
Coordinates
Name
A
Pressure
X
Path 5 signal analysis
B
Temperature
Y
Path 6 signal analysis
C
USE09-C measurement values
AB
USE09 measurement values
D
USE09-C flow
AC
USE09 diagnostics
16
E
Parameter
AD
Times
F
USE09-C Polynome-G
AE
USE09-C metering elements
G
USE09-C Polynome
AF
Type plate
H
Freq., pulse outputs
AG
Mode
I
Power output
AH
Error
J
Serial ports
AI
DSP parameters
K
DSP, FPGA values
AJ
DSP 3X parameters
L
Path 1 measurement values
AK
Path 1 parameters
M
Path 2 measurement values
AL
Path 2 parameters
N
Path 3 measurement values
AM
Path 3 parameters
O
Path 4 measurement values
AN
Path 4 parameters
P
Path 5 measurement values
AO
Path 5 parameters
Q
Path 6 measurement values
AP
Path 6 parameters
T
Path 1 signal analysis
AS
Service
U
Path 2 signal analysis
AT
Log memory
V
Path 3 signal analysis
AU
User info
W
Path 4 signal analysis
Figure 18: Table of parameters
By clicking on a coordinate in this list, the concise table with the Live values which are updated
every second opens on the right.
The following can be read off:
o Coordinates
o Name of the parameter
o Value
o Unit
o Modbus address
It is necessary to input a password and (for most parameters) open the USE09 calibration switch
or input a code word to amend the values.
The values are automatically transferred into the USE09 upon leaving the input field.
3 "RMGVIEW LIST" WINDOW
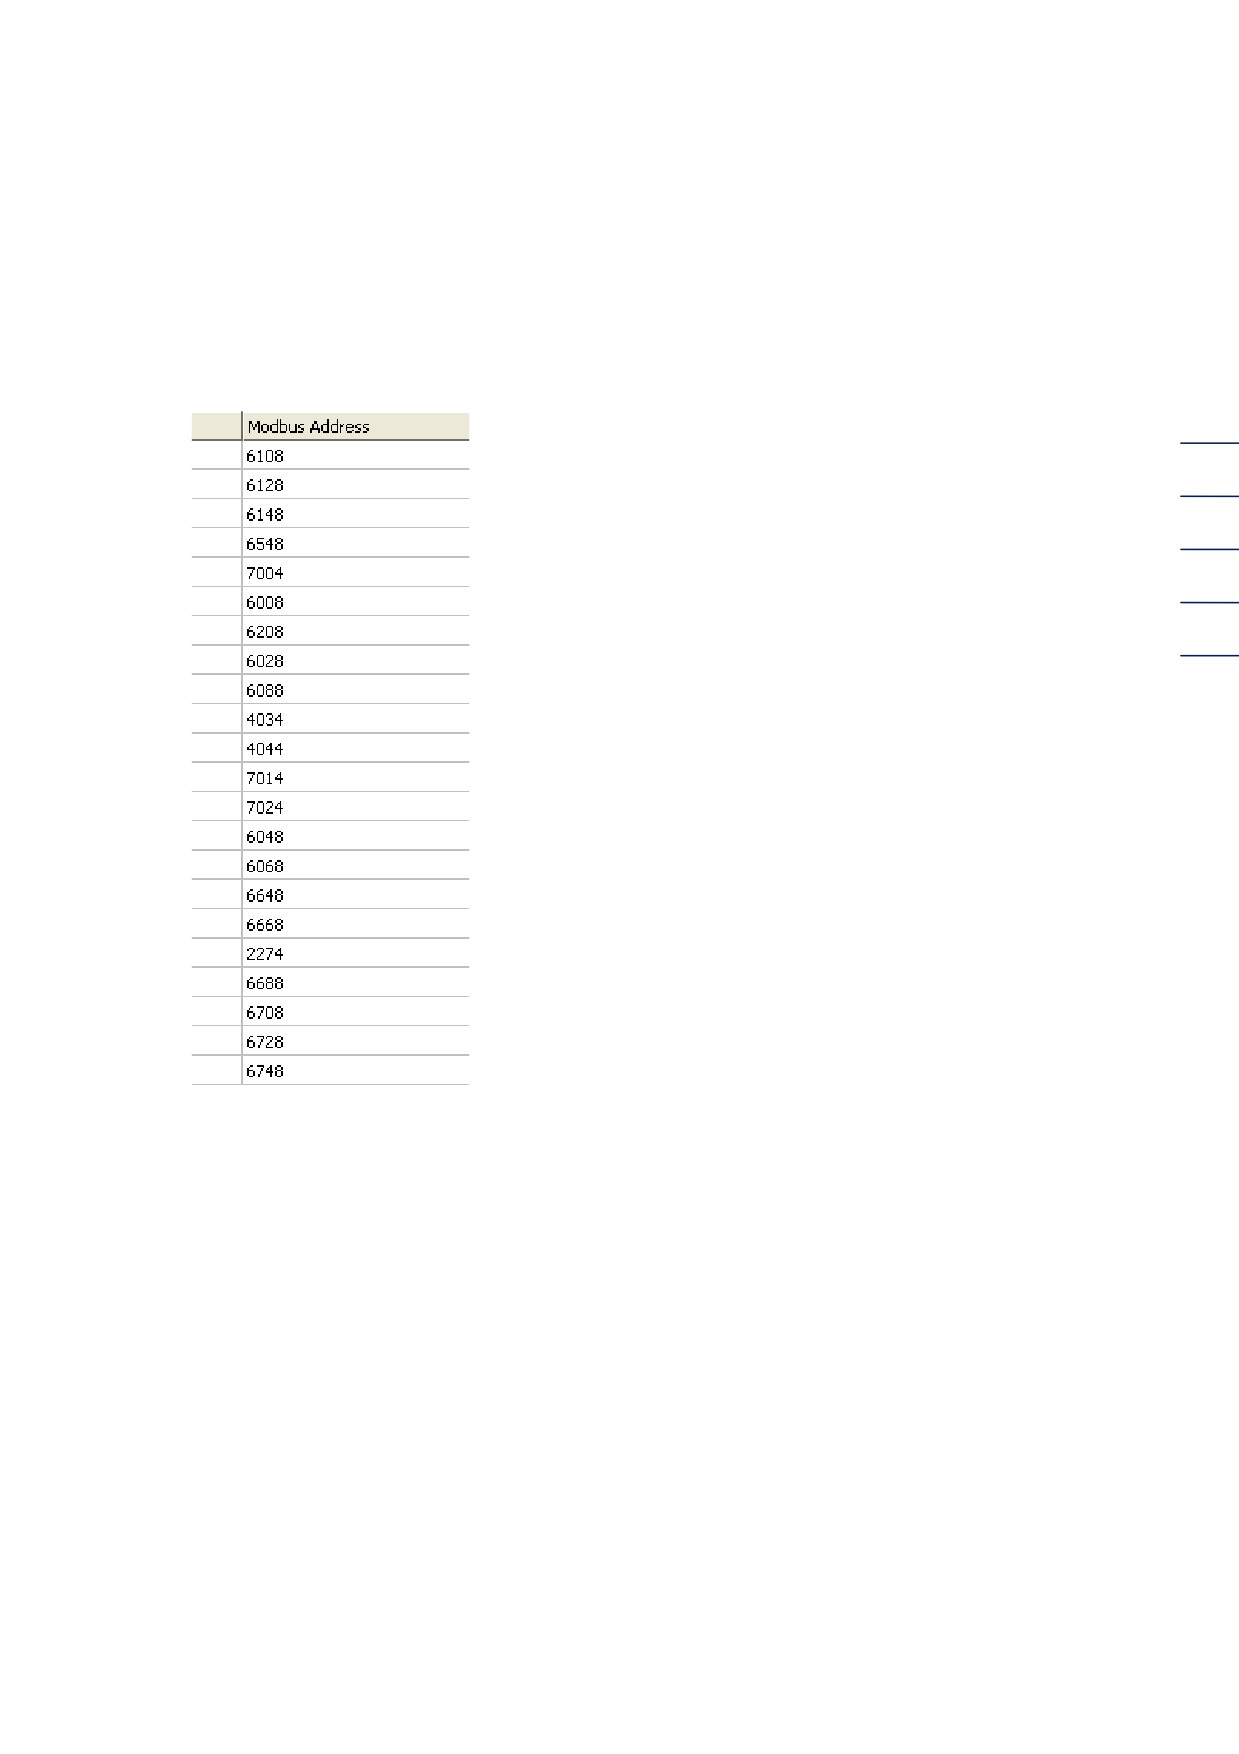
Every value can be called up by the management system via the Modbus address. The Modbus
address of each parameter can be read off in column 5 "Modbus addresses" of every
measurement value or parameters list in RMGView. A Modbus register is also available in the html
documentation of every firmware version in ascending order.
17
Figure 19: Modbus addresses
3 "RMGVIEW LIST" WINDOW
3.1 Editor of the user-defined lists
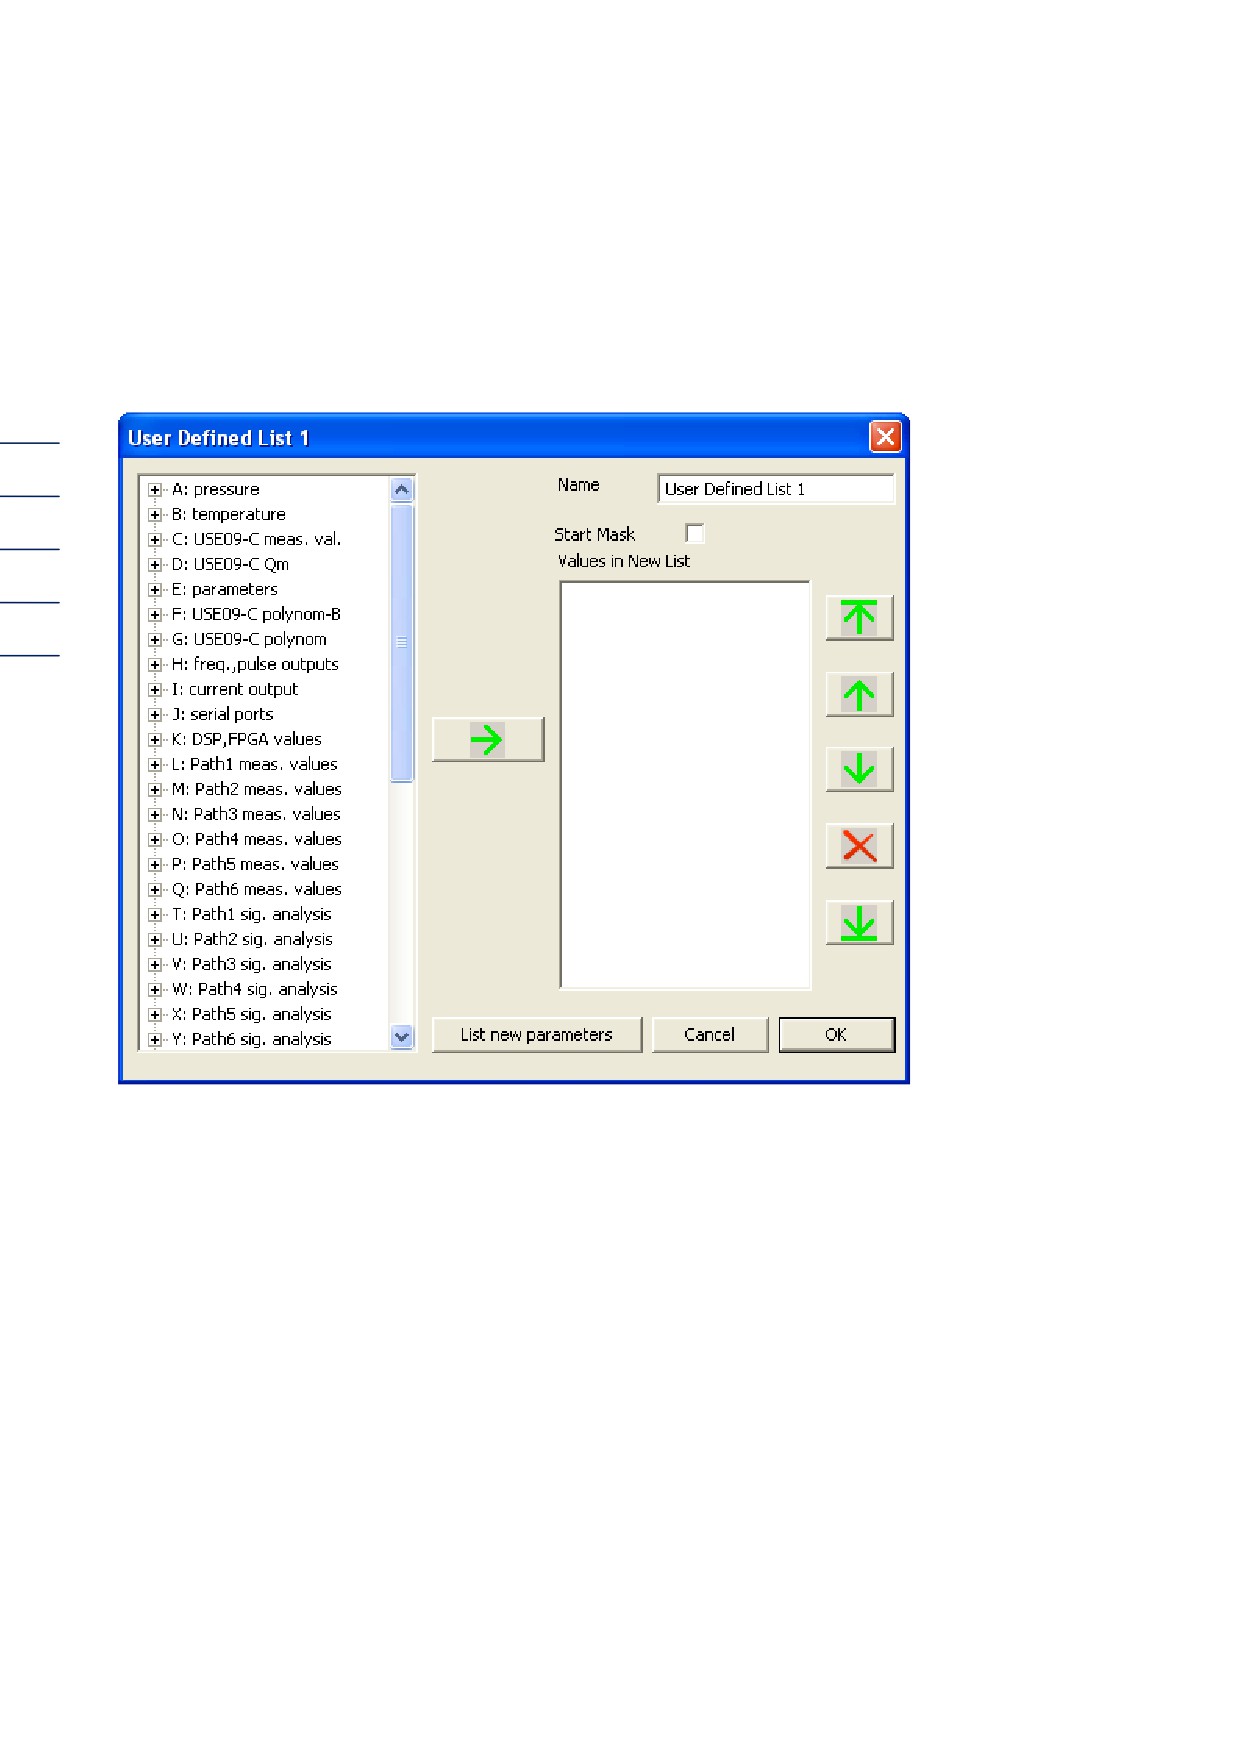
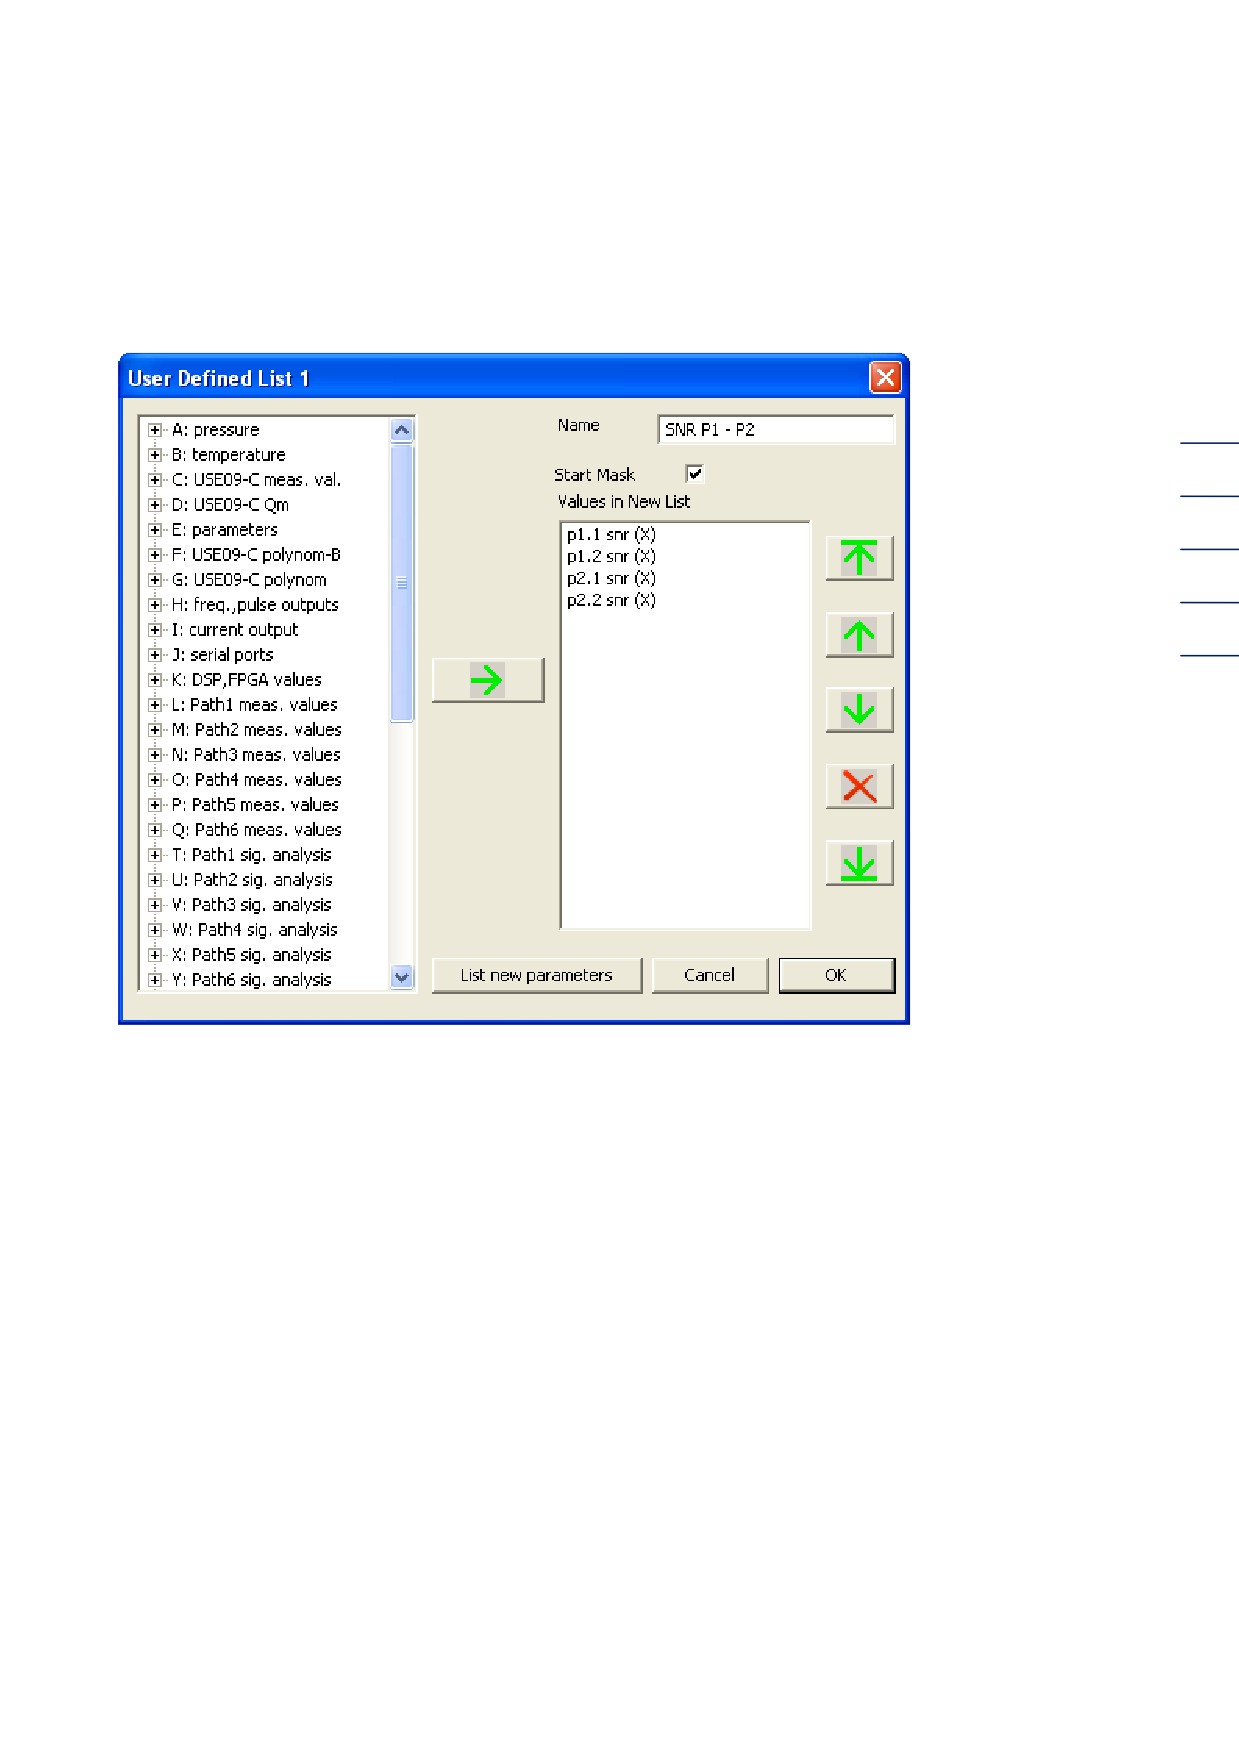
Double-clicking on "New user-defined list" opens a "User-defined list 1" editor on the right, with the
help of which individual lists can be compiled. It is possible to amend an existing list by double-
clicking or by selecting the context menu point (right-click) "Edit."
18
Figure 20: Editor of the user-defined lists
3 "RMGVIEW LIST" WINDOW
In the left section of the editor all values of the USE09 can be selected and transferred in the
middle into the right section which depicts the new list by double-clicking or by clicking on the
green arrow symbol.
19
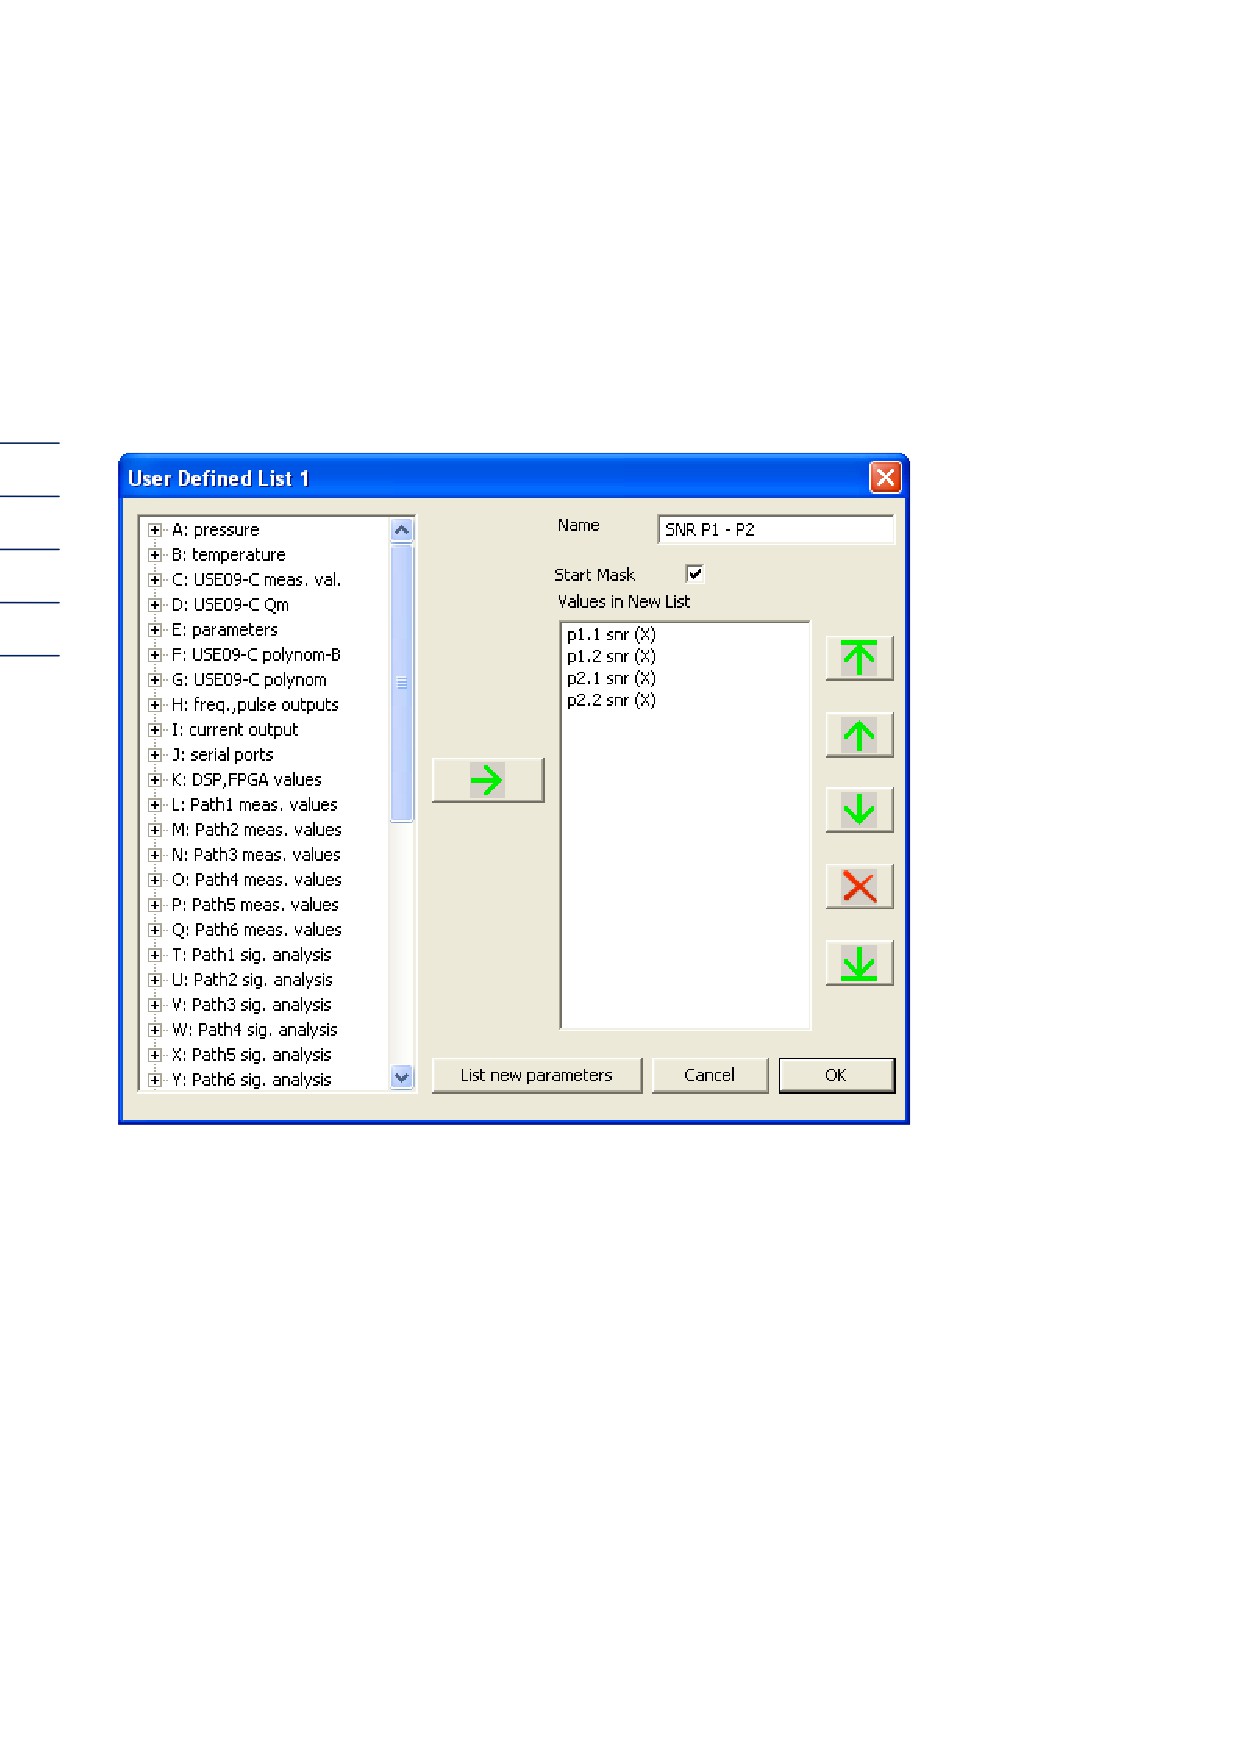
Figure 21: Example of the inputting of user-defined lists
You can scroll through your own list with the green upward and downward arrows on the right and
delete individual parameters with the red deletion cross. You can rename this list.
Selecting "Start mask" displays this list when new list views are opened.
"List of new parameters" opens a dialog in which a USE09 (previous) version can be selected. In
the list, the parameters which are new in the current version compared to the selected version are
transferred.
When you have completed your list, name it and click Ok. The Live values list with your selected
parameters appears in the right screen.
3 "RMGVIEW LIST" WINDOW
Example:
The values for SNR (signal noise ratio) on sensor 1.1 and sensor 1.2 were selected in each
instance from the "RMGView list" for the user-defined list under the L-coordinate and the SNR
values for sensors 2.1 and 2.2 were selected under the M-coordinate and transferred to the
"Values in new list" list. The name was changed to "SNR P1 - P2."
20
Figure 22: Creation of a user-defined list
3 "RMGVIEW LIST" WINDOW
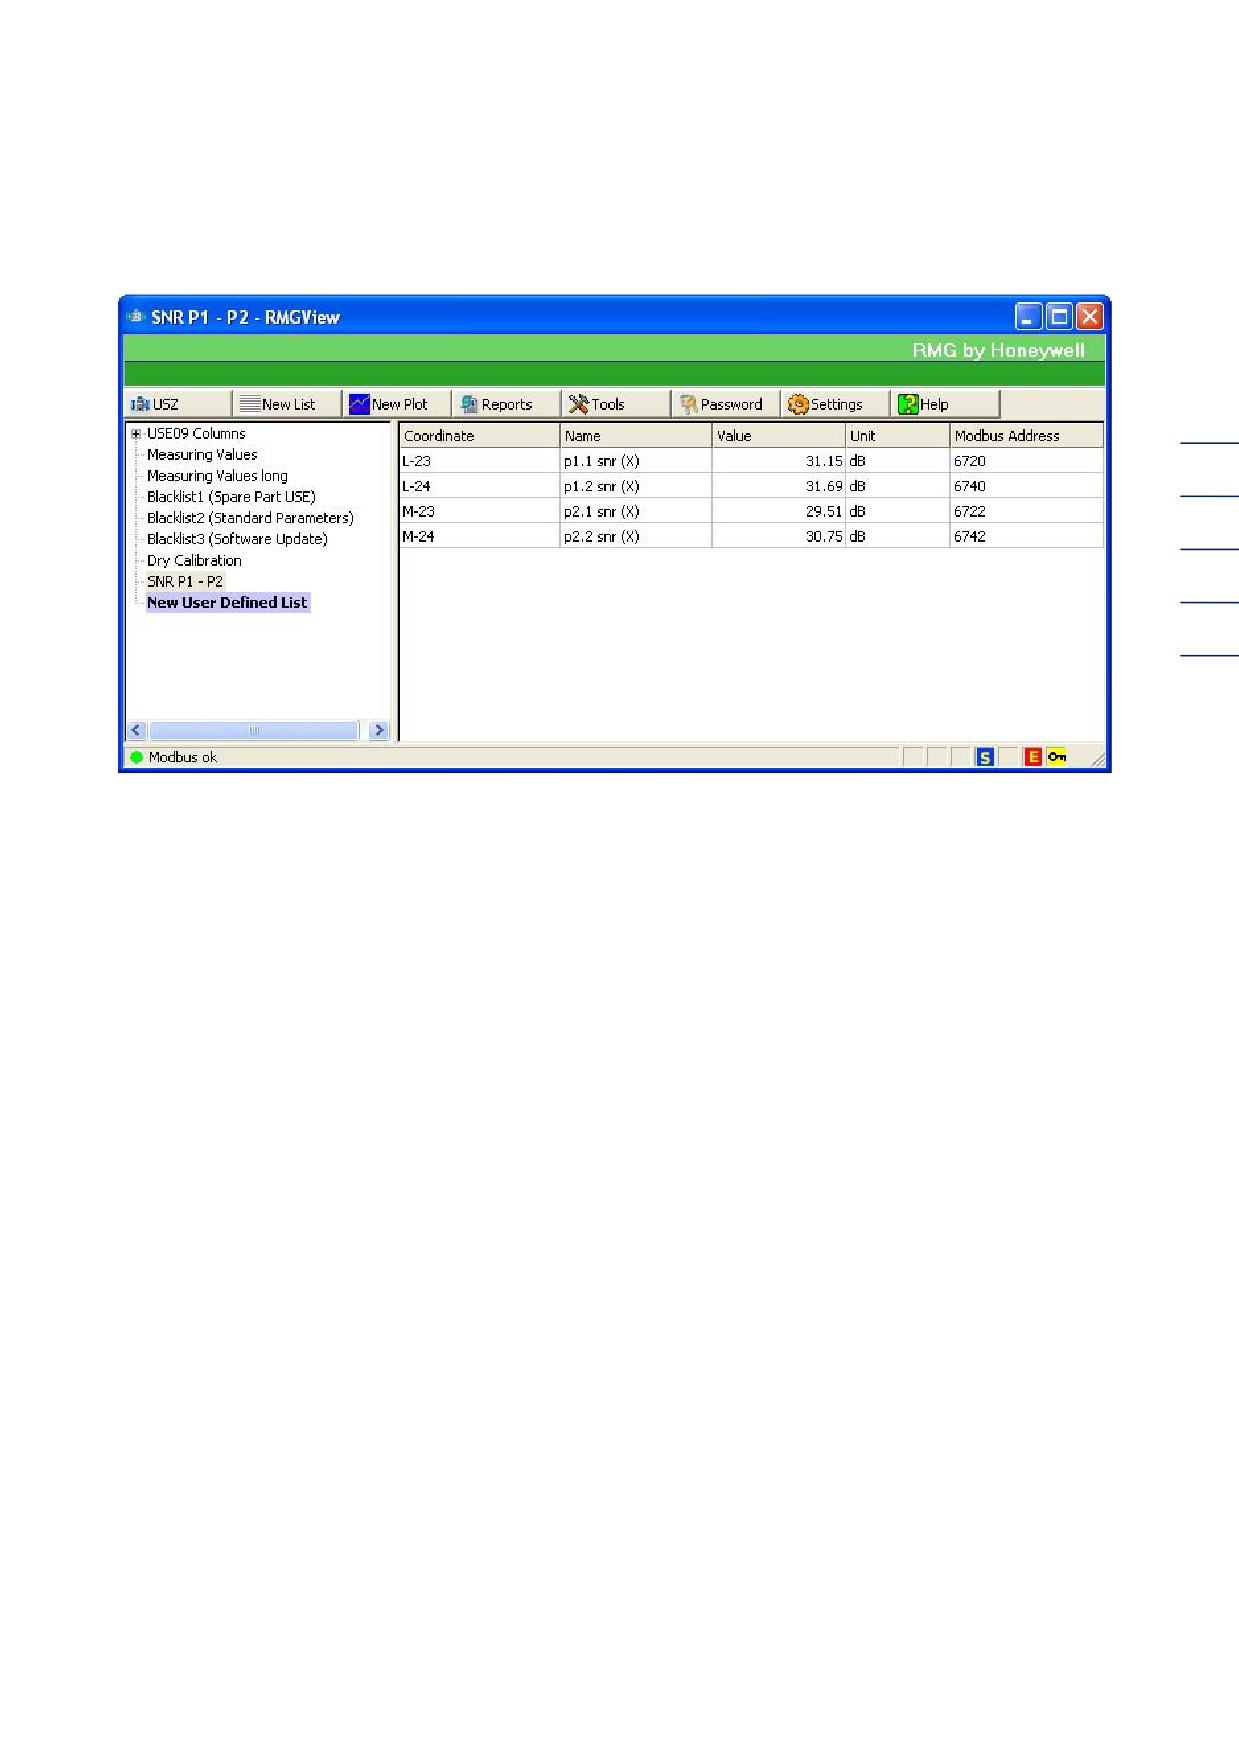
The following table appears when you click Ok:
21
Figure 23: Example of user-defined list
You can delete this list again by right-clicking to the left of your list's name and selecting "Delete."
This list is deleted the next time the window is opened.
3.2 Recording of list values
The "Record data" menu point can be selected in the context menu (right-click) which enables
recording of the values outlined in the list as a CSV file. Recording is terminated by right-clicking
again and selecting the "Terminate recording" menu item or by closing the list. The list can then be
imported into table processing programs.
Clicking on the "New value" button opens a new list window.
3 "RMGVIEW LIST" WINDOW
3.3 Plots "New plot" (Graphics)
22
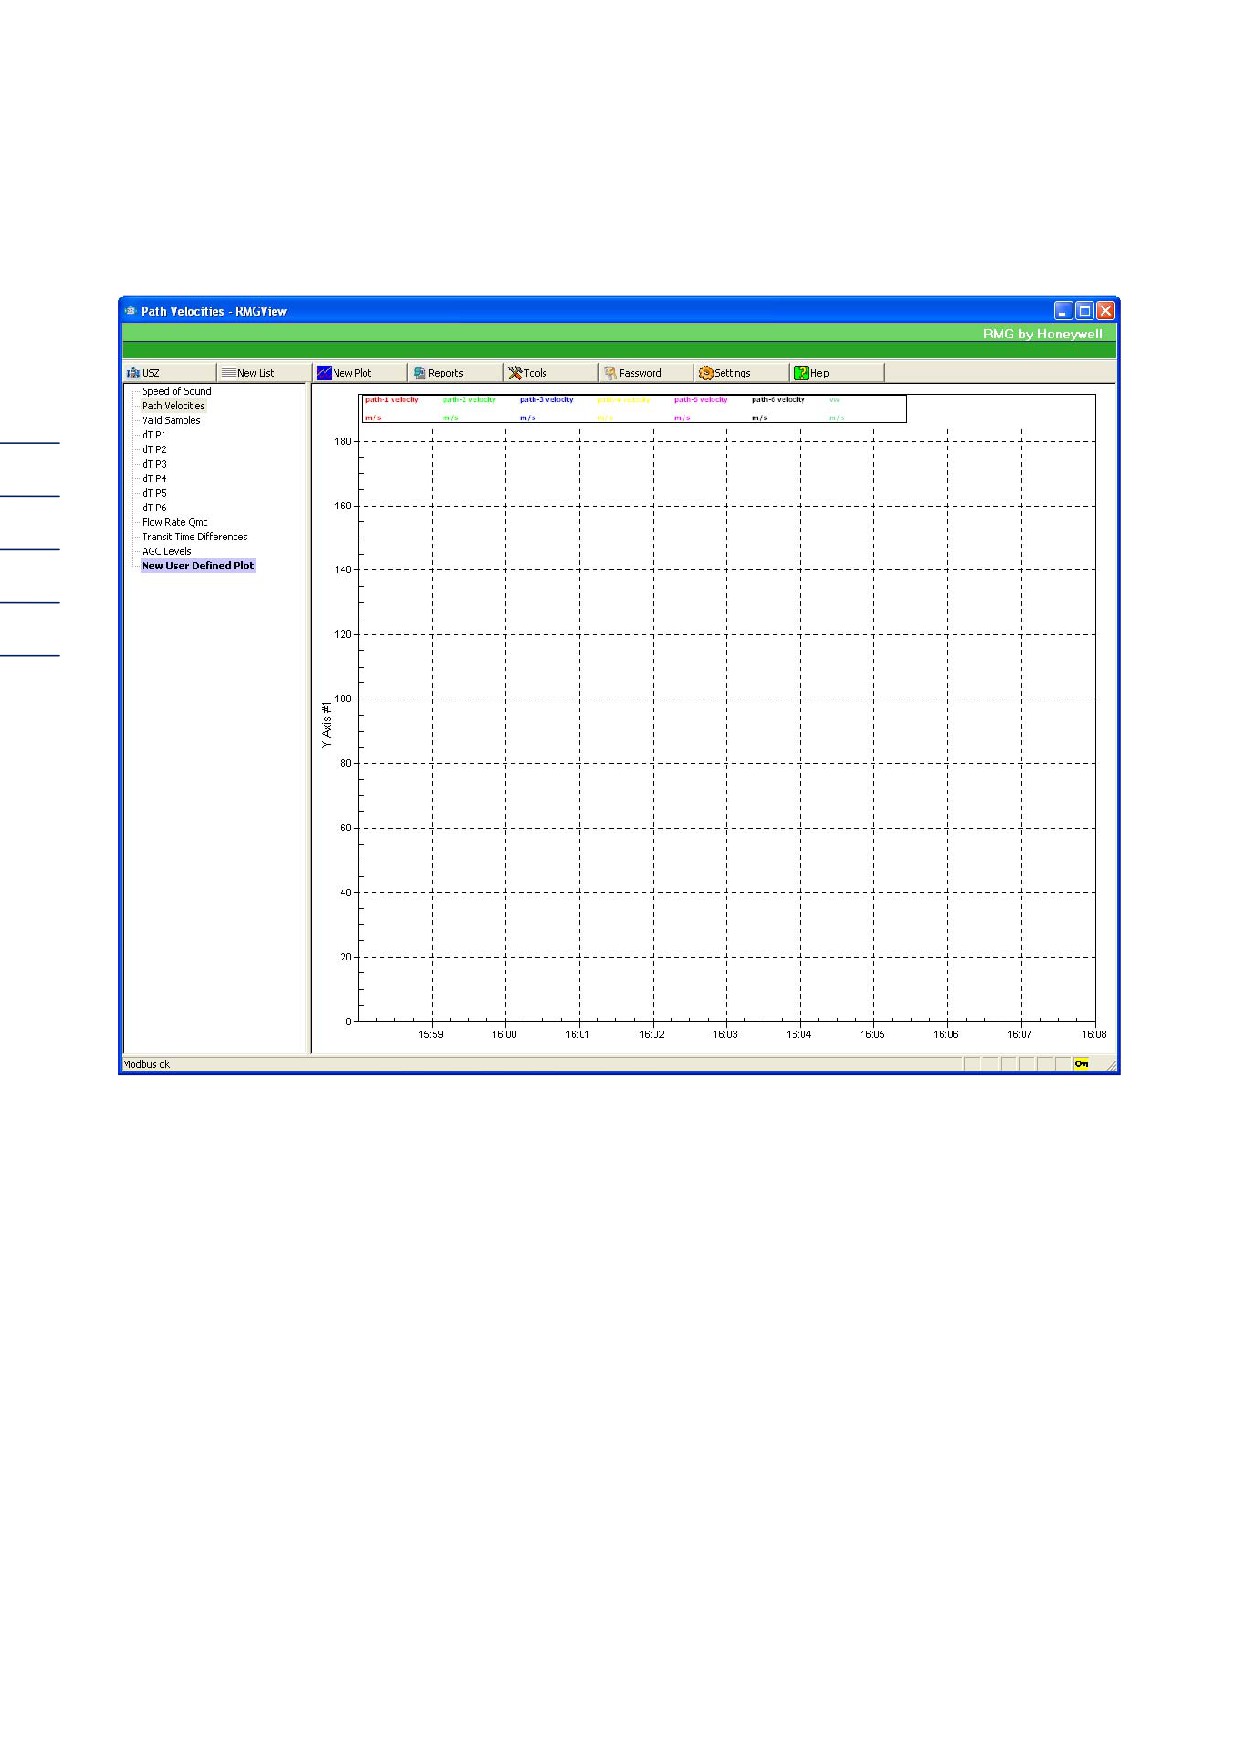
Figure 24: "New plots" window
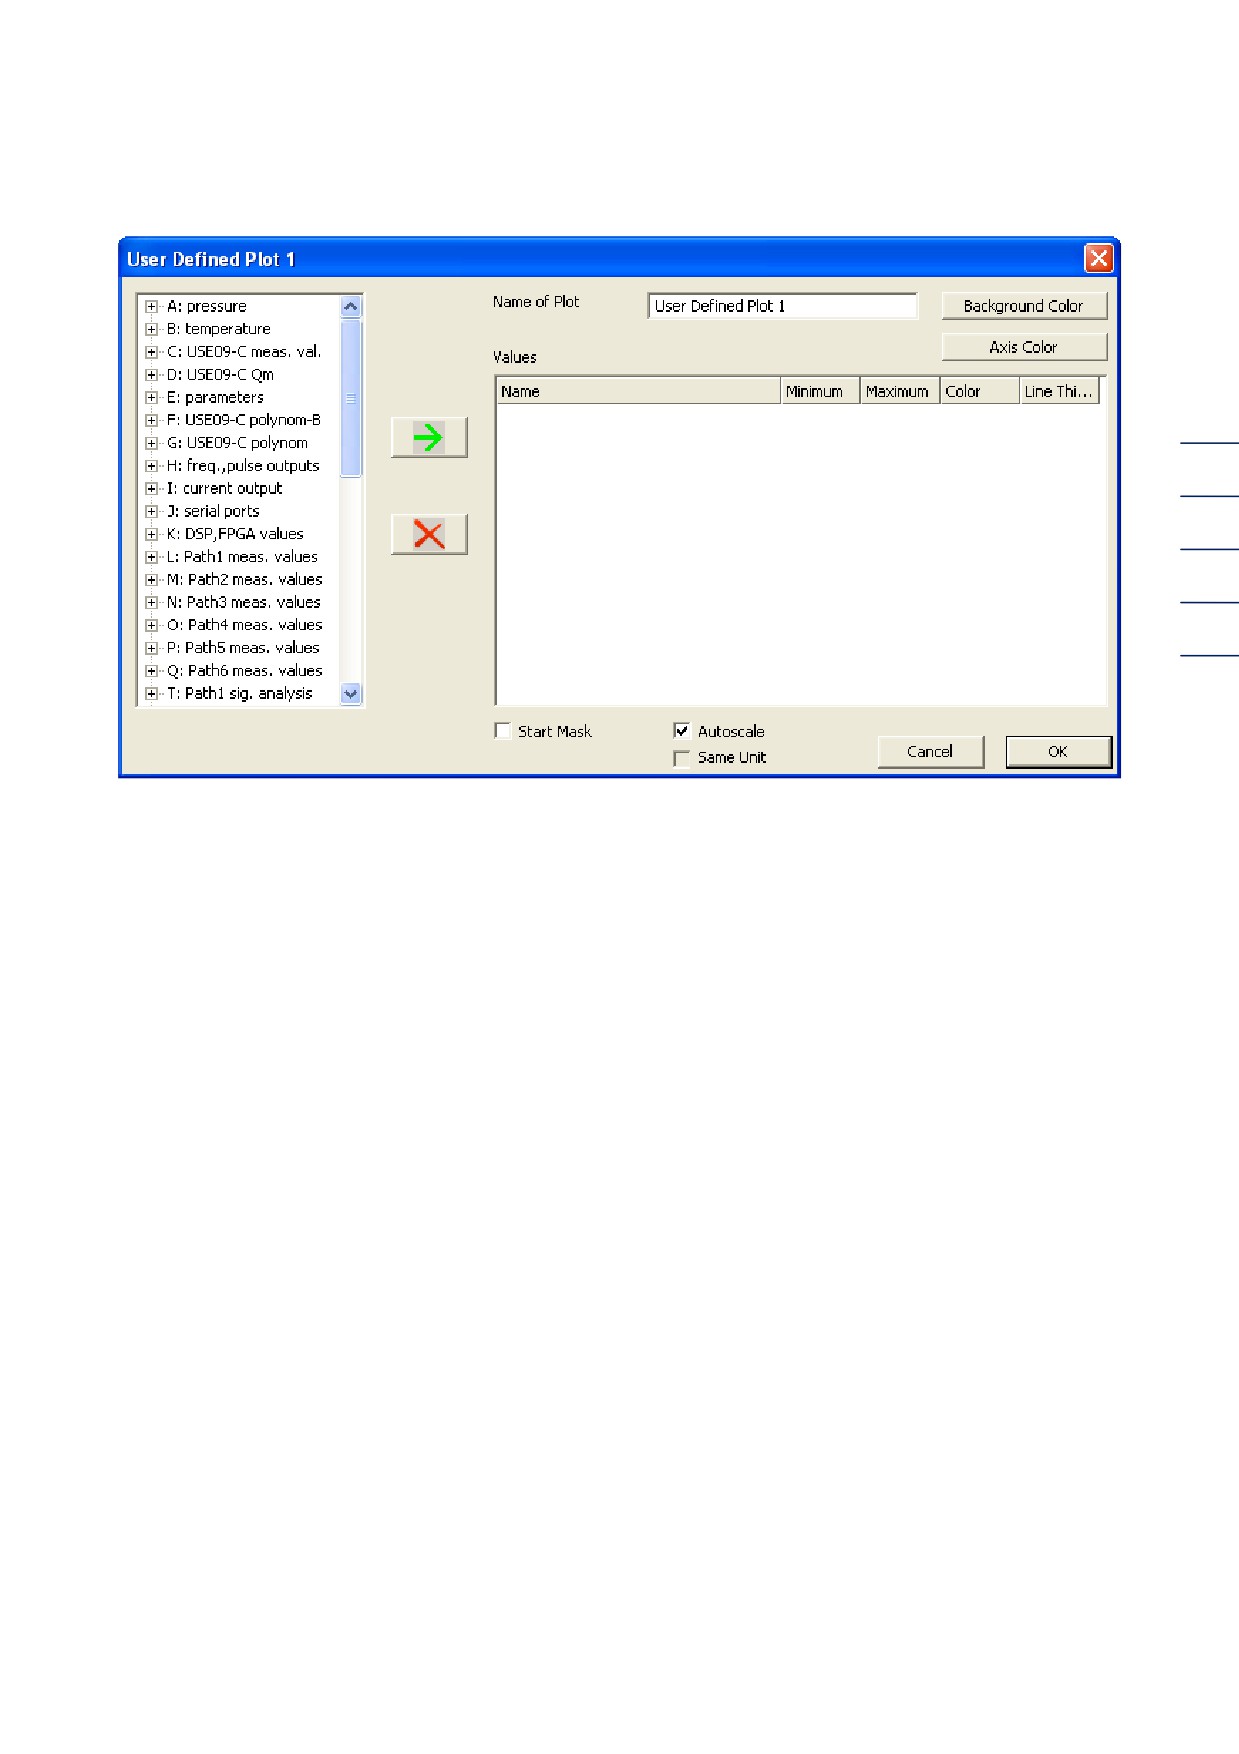
New plots can be created with the "Editor for user-defined plots" (double-click on "New user-
defined plots").
3 "RMGVIEW LIST" WINDOW
23
Figure 25: Editor for user-defined plots
The procedure is the same as for "Editor of user-defined lists." The selected data is displayed in
the empty field on the right by double-clicking on the parameter list on the left or by single-clicking
with the green arrow pointing to the right.
A color and line width are assigned to the graphs, which can be changed at any time.
The selected data is recorded in a 1-second grid.
3.4 y scale:
If all values depicted in the plot have the same unit, the y-scale is depicted in this unit, otherwise in
percent.
3.5 Autoscale:
When "Autoscale" is activated, the range limits are adjusted automatically and is tracked to the
minimum and maximum values attained since plot start. If "Autoscale" is not activated, the range
limits must be specified (minimum and maximum) according to whether the values have an
identical unit, on one occasion or individually for each value.
3 "RMGVIEW LIST" WINDOW
24
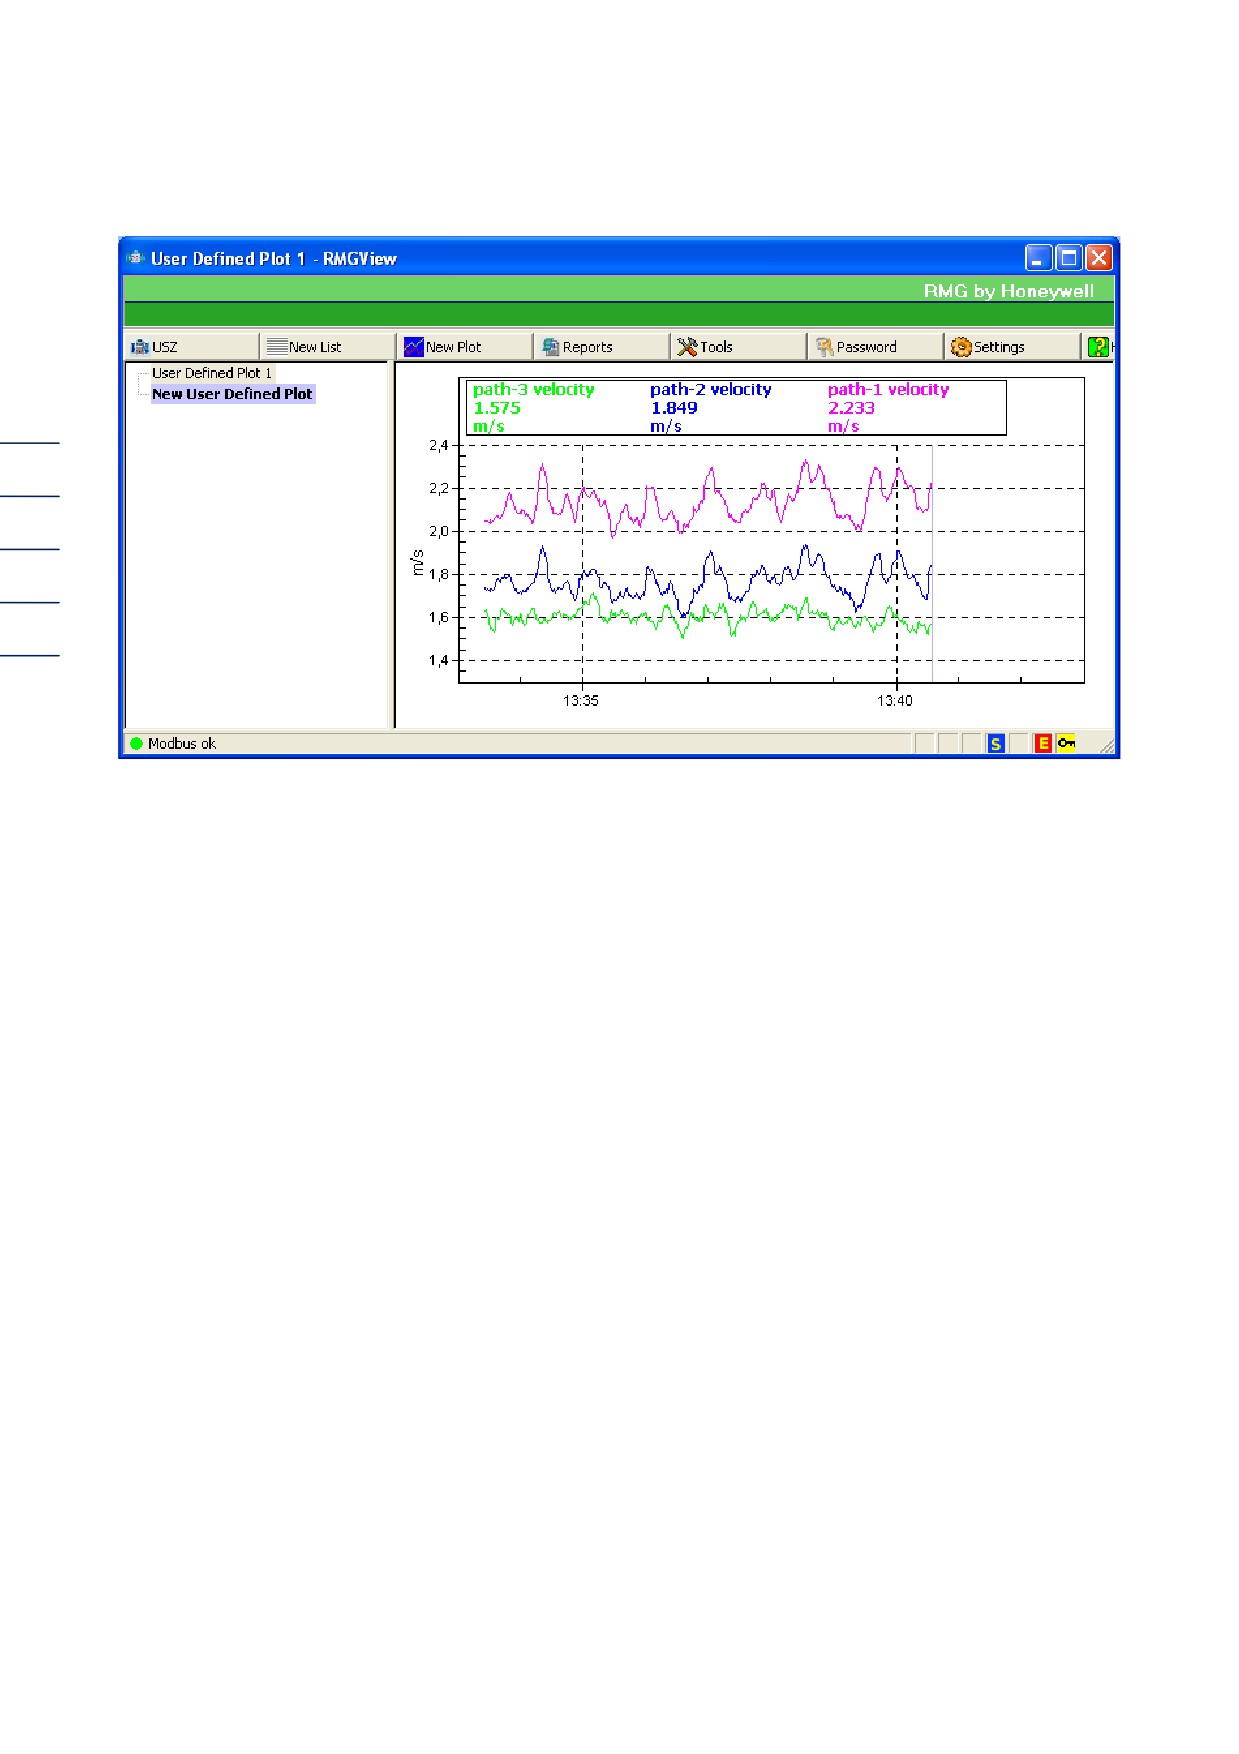
Figure 26: Example of user-defined plot
In the upper line the selected parameters depicted in the low range are specified in different colors
whereby the color of the graph corresponds to the color of the parameter (color and line width
changes, see above). The measurement values correspond to those of the cursor position. If the
mouse is in the plot range, the cursor tracks the mouse movements, otherwise it follows the last
depicted value. Historical values can also be displayed by the cursor.
3 "RMGVIEW LIST" WINDOW
3.6 Zoom
A zoom range can be selected by dragging the mouse while holding down the left mouse button.
Zooming can be cancelled in the context menu (right-mouse button) by inputting "z."
3.7 Exporting of plot files
25
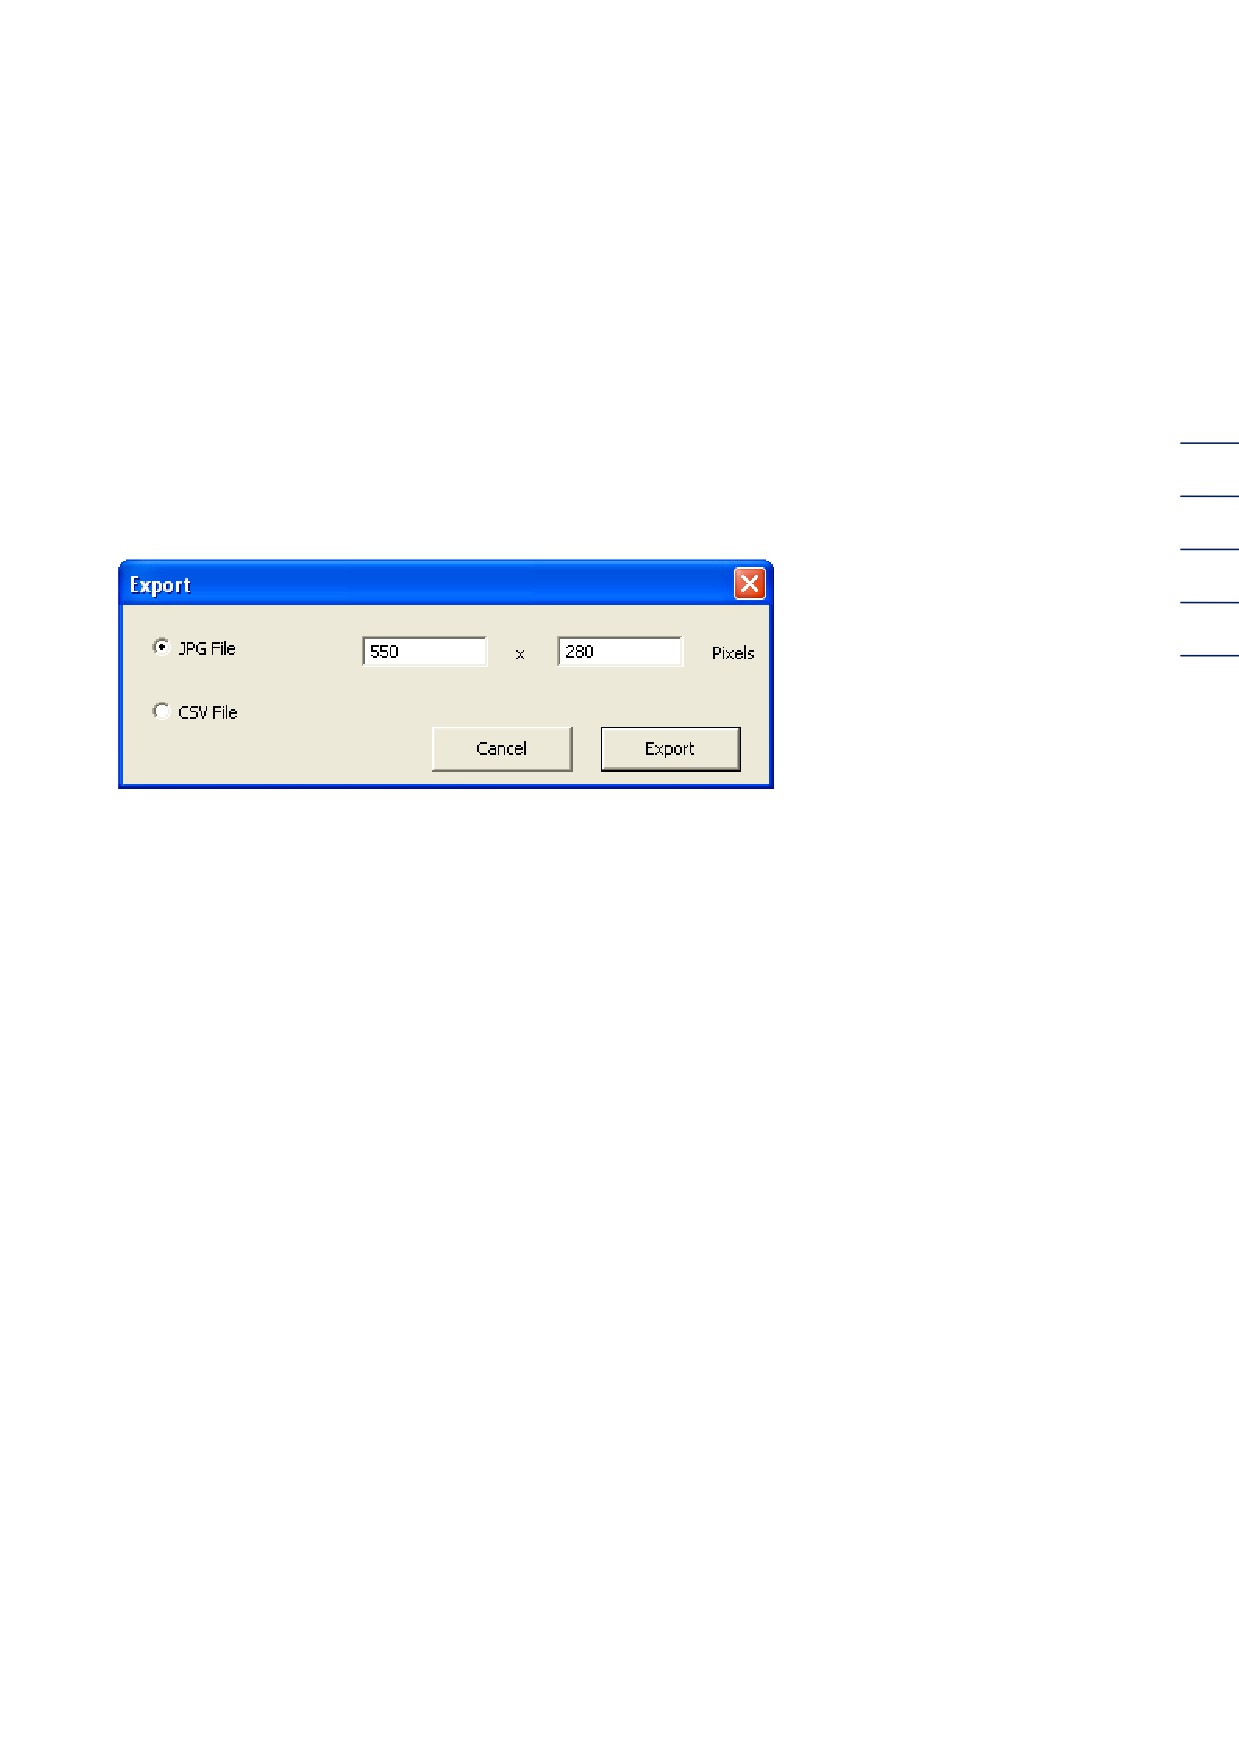
The plot files can be edited, exported and printed by pressing the right mouse button (context
menu).
Figure 27: Exporting of a plot
3 "RMGVIEW LIST" WINDOW
3.8 Protocols
Parameter protocols / select .rpr file
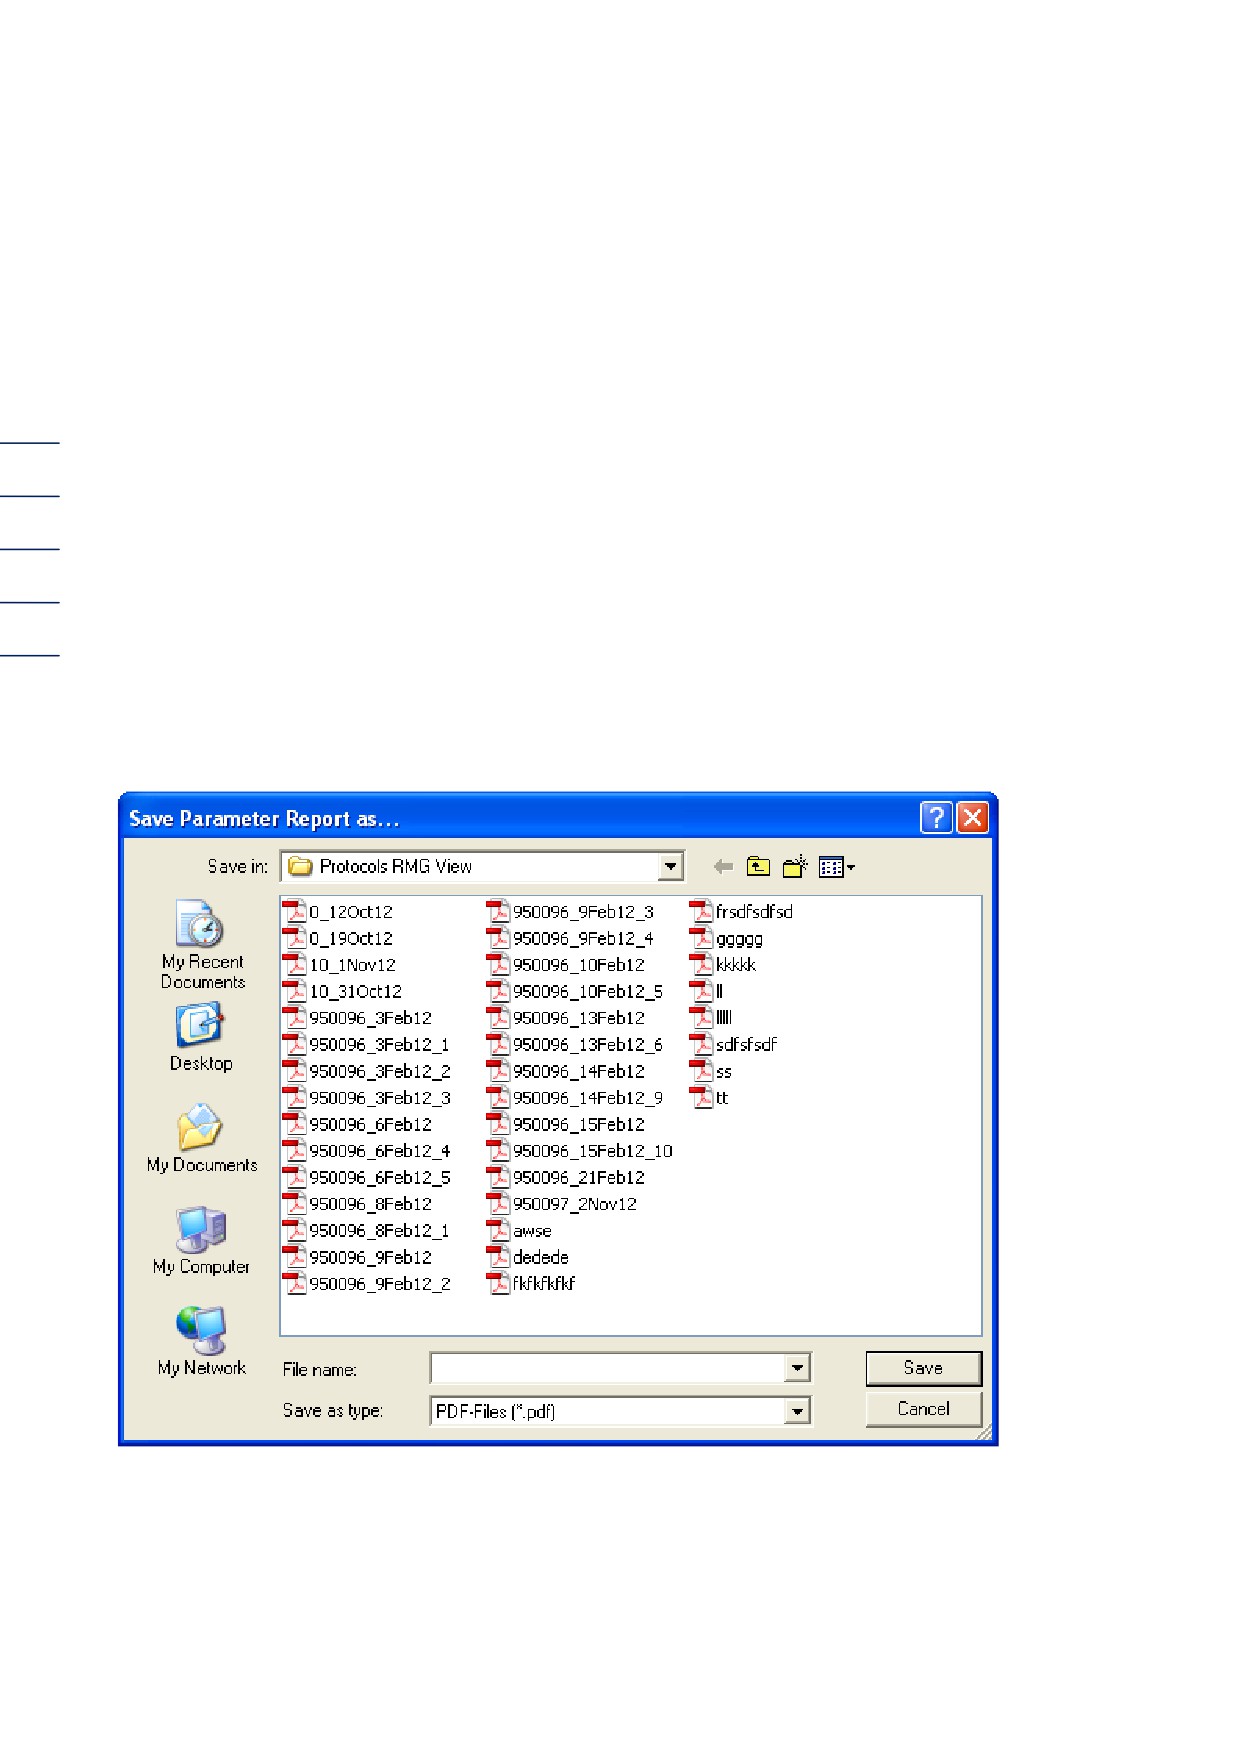
You can generate a standard protocol here which contains all parameters of the connected
USE09s.
The protocol format can be adjusted in the subsequent file selection dialog.
26
Selectable formats:
o PDF
Adobe Acrobat Reader or a comparable program must be installed to display this.
o HTML
Only suitable for printing to a very limited extent (page break).
o CSV
Suitable for importation in data programs.
The CSV separator can be set under "Settings, user interface." This format is also used by
the RMGView function "Configure USE".
Figure 28: Storing a parameter protocol
3 "RMGVIEW LIST" WINDOW
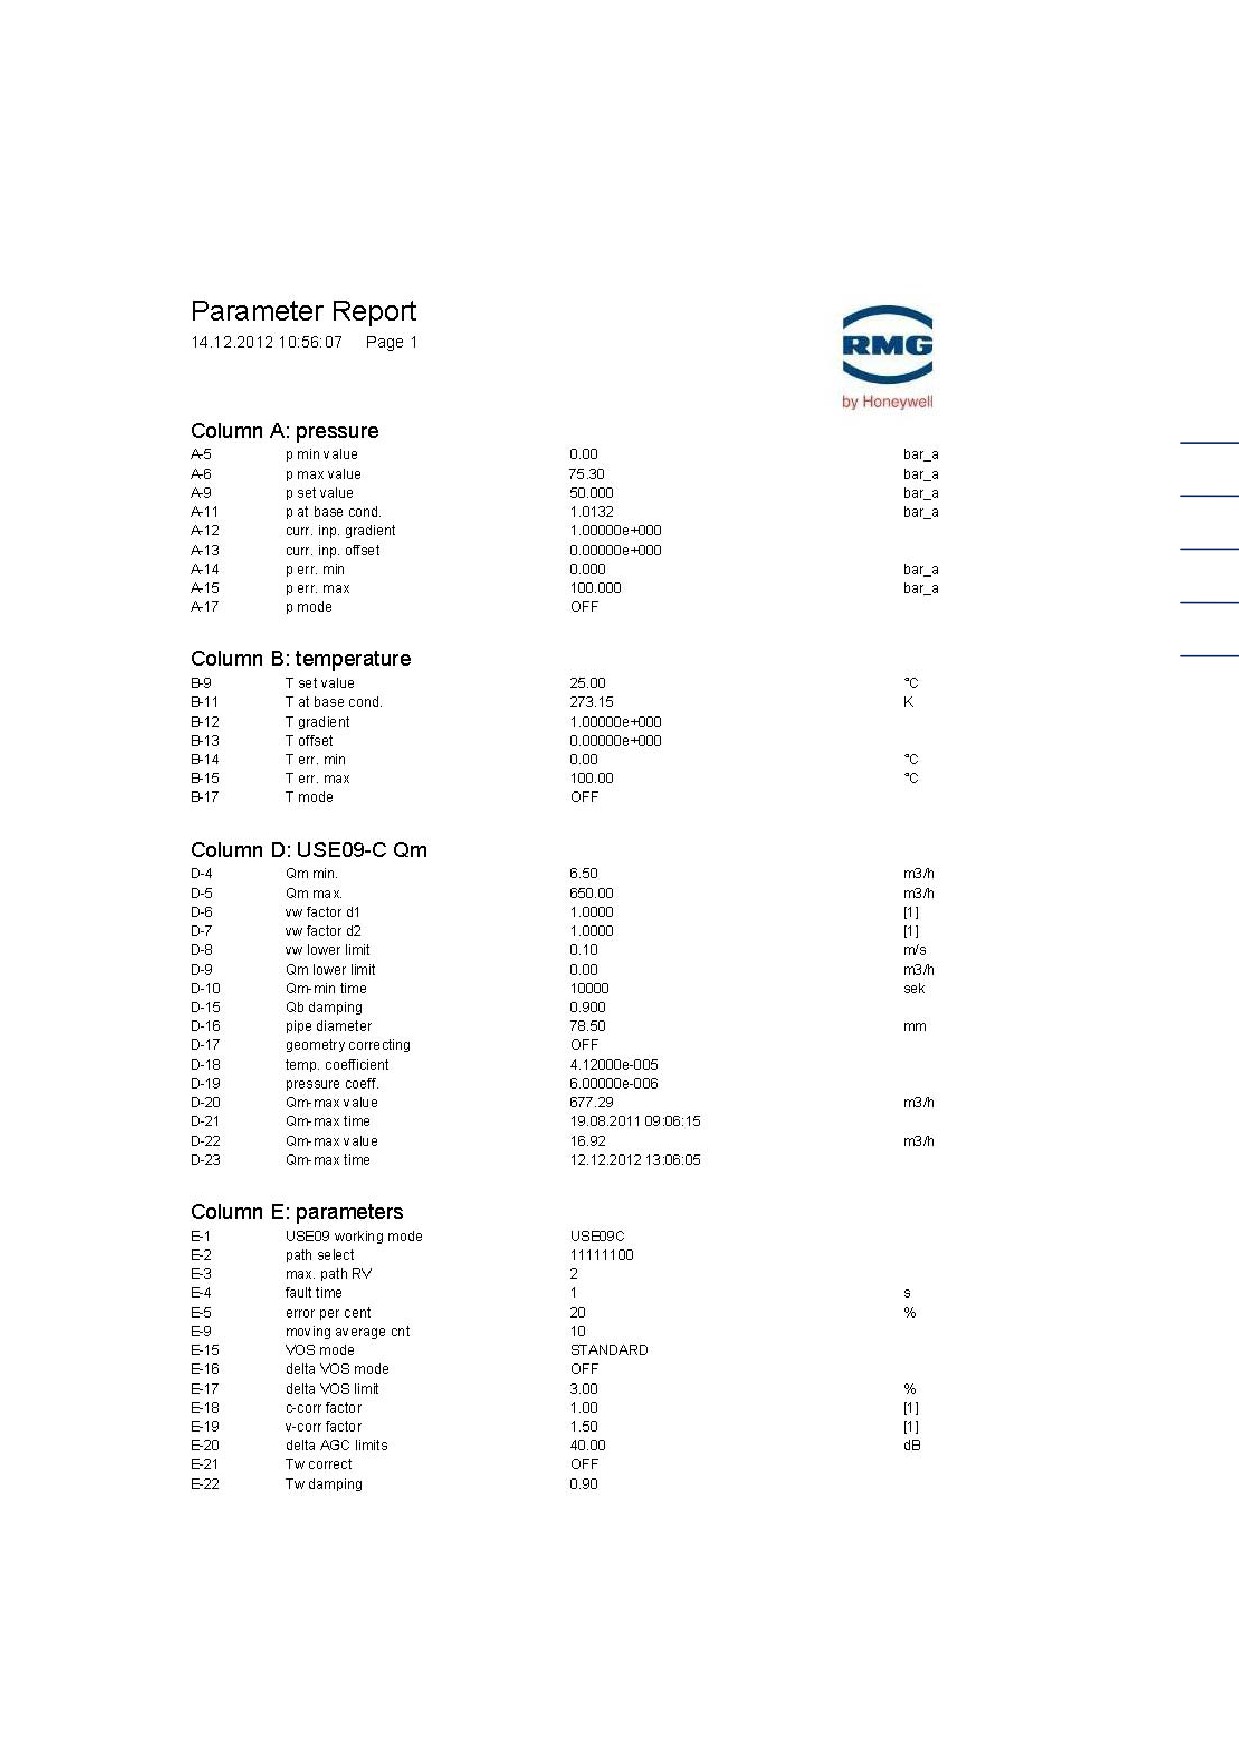
A parameter protocol looks like this (Page 1 of xx):
27
Figure 29: Parameter protocol
3 "RMGVIEW LIST" WINDOW
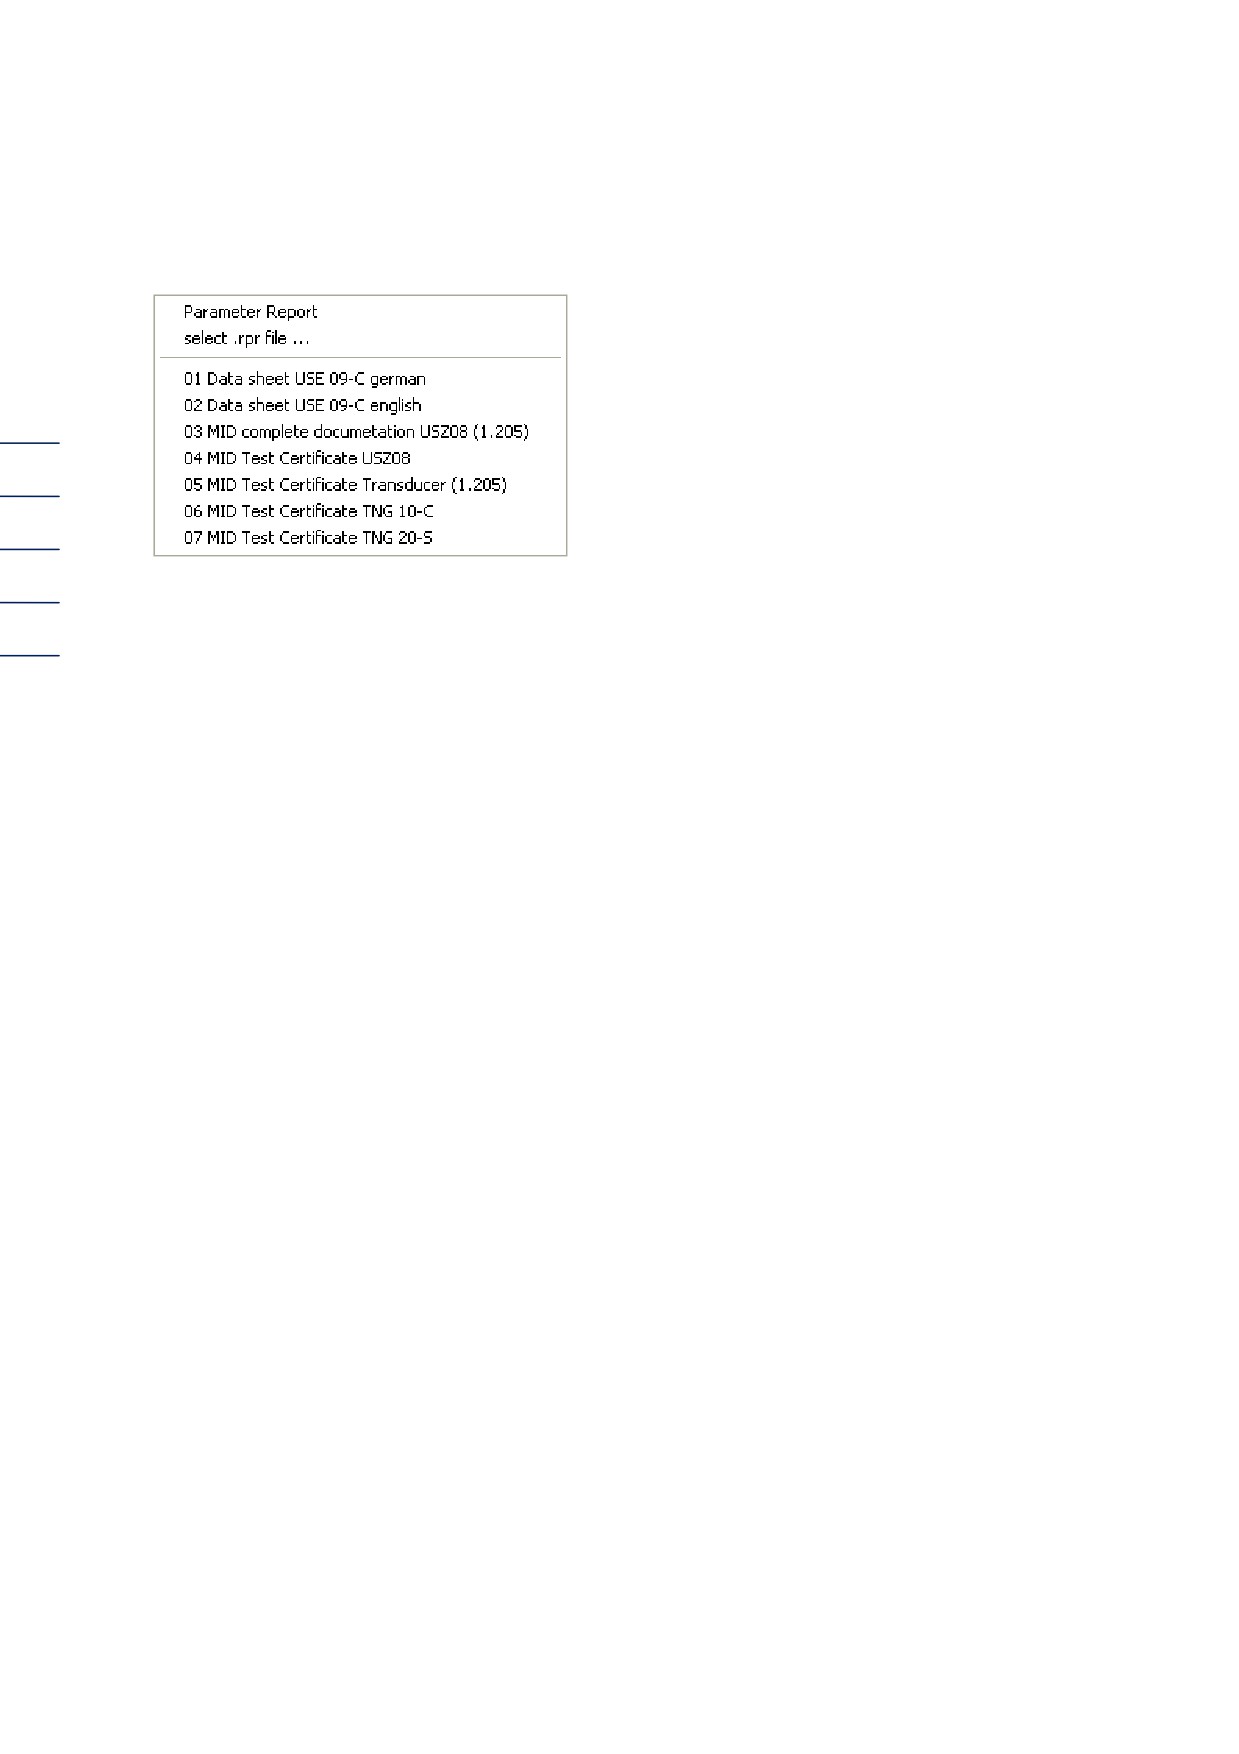
The following list appears when "Protocols" is clicked:
28
Figure 30: Protocol selection list
01
USE 09-C German data sheet
02
USE 09-C English data sheet
03
MID-complete documentation USM08 (from 1.205)
04
MID Test Certificate USM08
05
MID Test Certificate Sensor (from 1,205)
06
MID Test Certificate TNG_10-C
07
MID Test Certificate TNG_20-S
08
Complete doc. USM08 basis (from 1,205)
09
Complete doc. USM08+USE09-C (from 1,205)
10
USM08 basis test certificate
11
USM08+USE09-C test certificate (from 1,205)
12
Sensor test slip (from 1,205)
13
TNG 10-C test slip
14
TNG 20-S test slip
The protocols 8 to 14 are only available if the language is set to German!
These protocols are stored. It involves test protocols which require authorization for meters with
domestic type approval or MID approval dependent on the TNG 10-C (120 kHz) or TNG 20-S (200
kHz) sensor type used and the meter firmware used. Data is stored in the matrix from version
1.205 which needed to be inputted manually when creating protocols when using the previous
version. Data sheets 01 and 02 are attached as an appendix to the standardization or calibration
slip of the high pressure test. The "Protocol selection" list can be added to with the help of the
protocol editor (see "Tools" below) at any time.
3 "RMGVIEW LIST" WINDOW
Example 1:
A "Data sheet USE 09-C English" should be created.
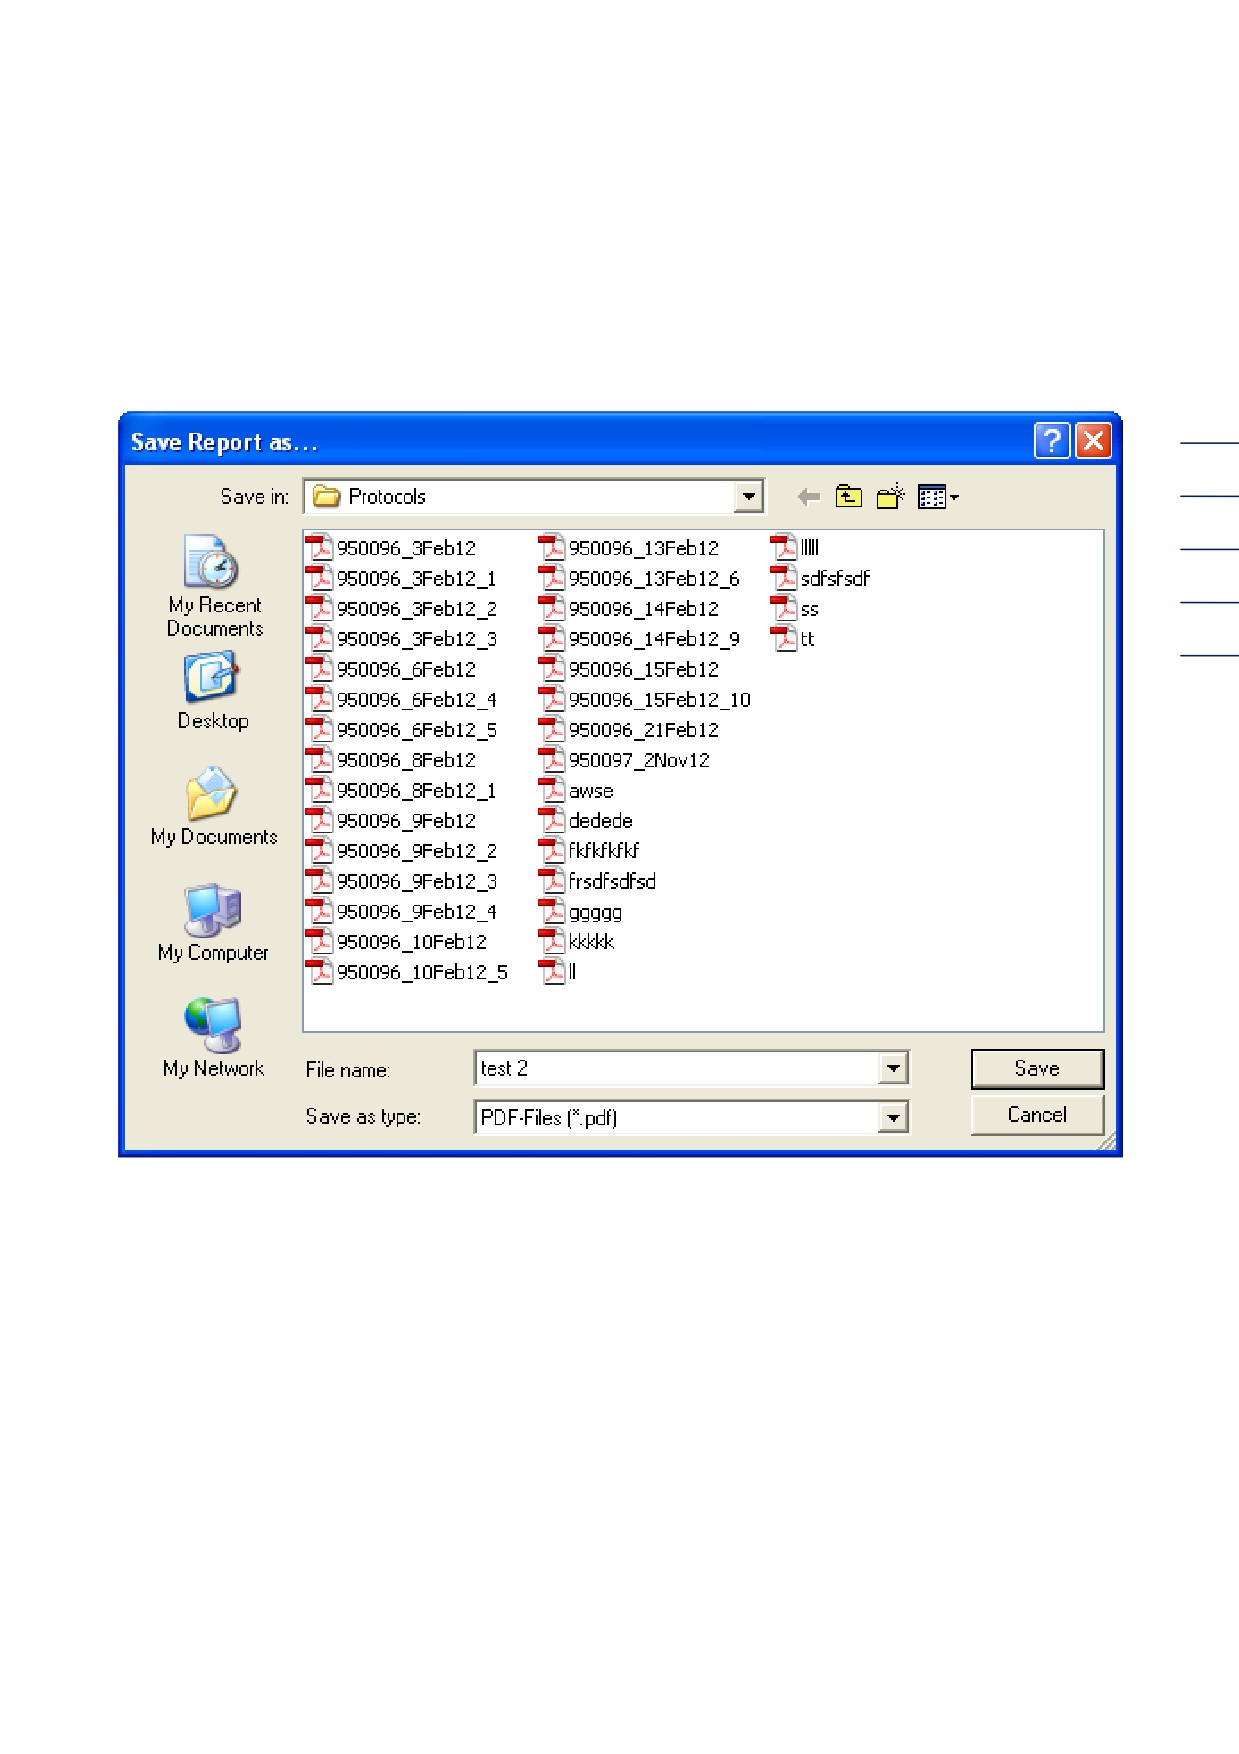
Clicking on the "Data sheet USE 09-C English" opens the "Save protocol as…" window. Give the
protocol a name ("test 2" here) and click save.
29
Figure 31: "Save protocol as..." window
3 "RMGVIEW LIST" WINDOW
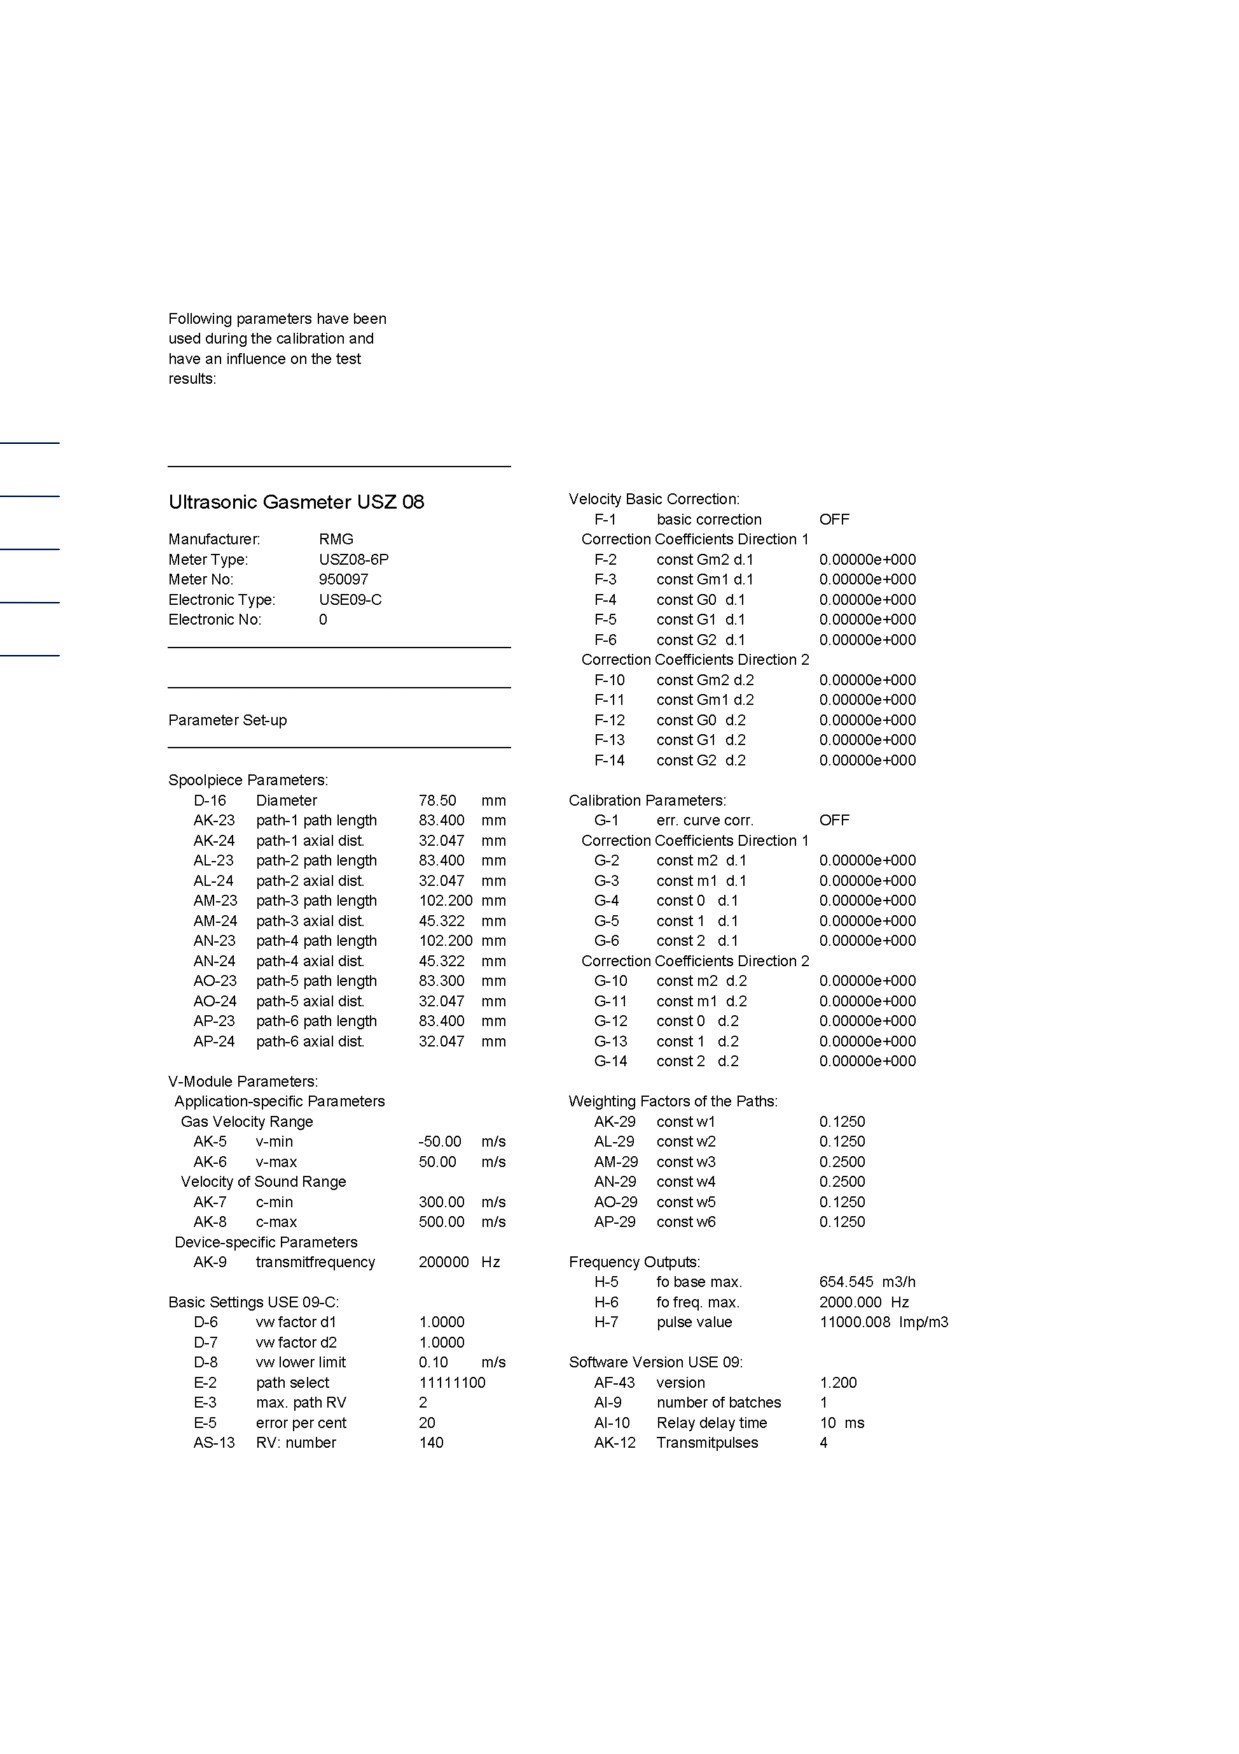
A PDF protocol appears:
30
Figure 32: Example of pdf protocol "Data sheet USE 09-C English
3 "RMGVIEW LIST" WINDOW
Example 2:
A MID test slip USM 08 should be created.
Clicking on the "MID Test Certificate USM 08" opens the "Save protocol as…" window. Give the
protocol a name ("test 6" here) and click on save.
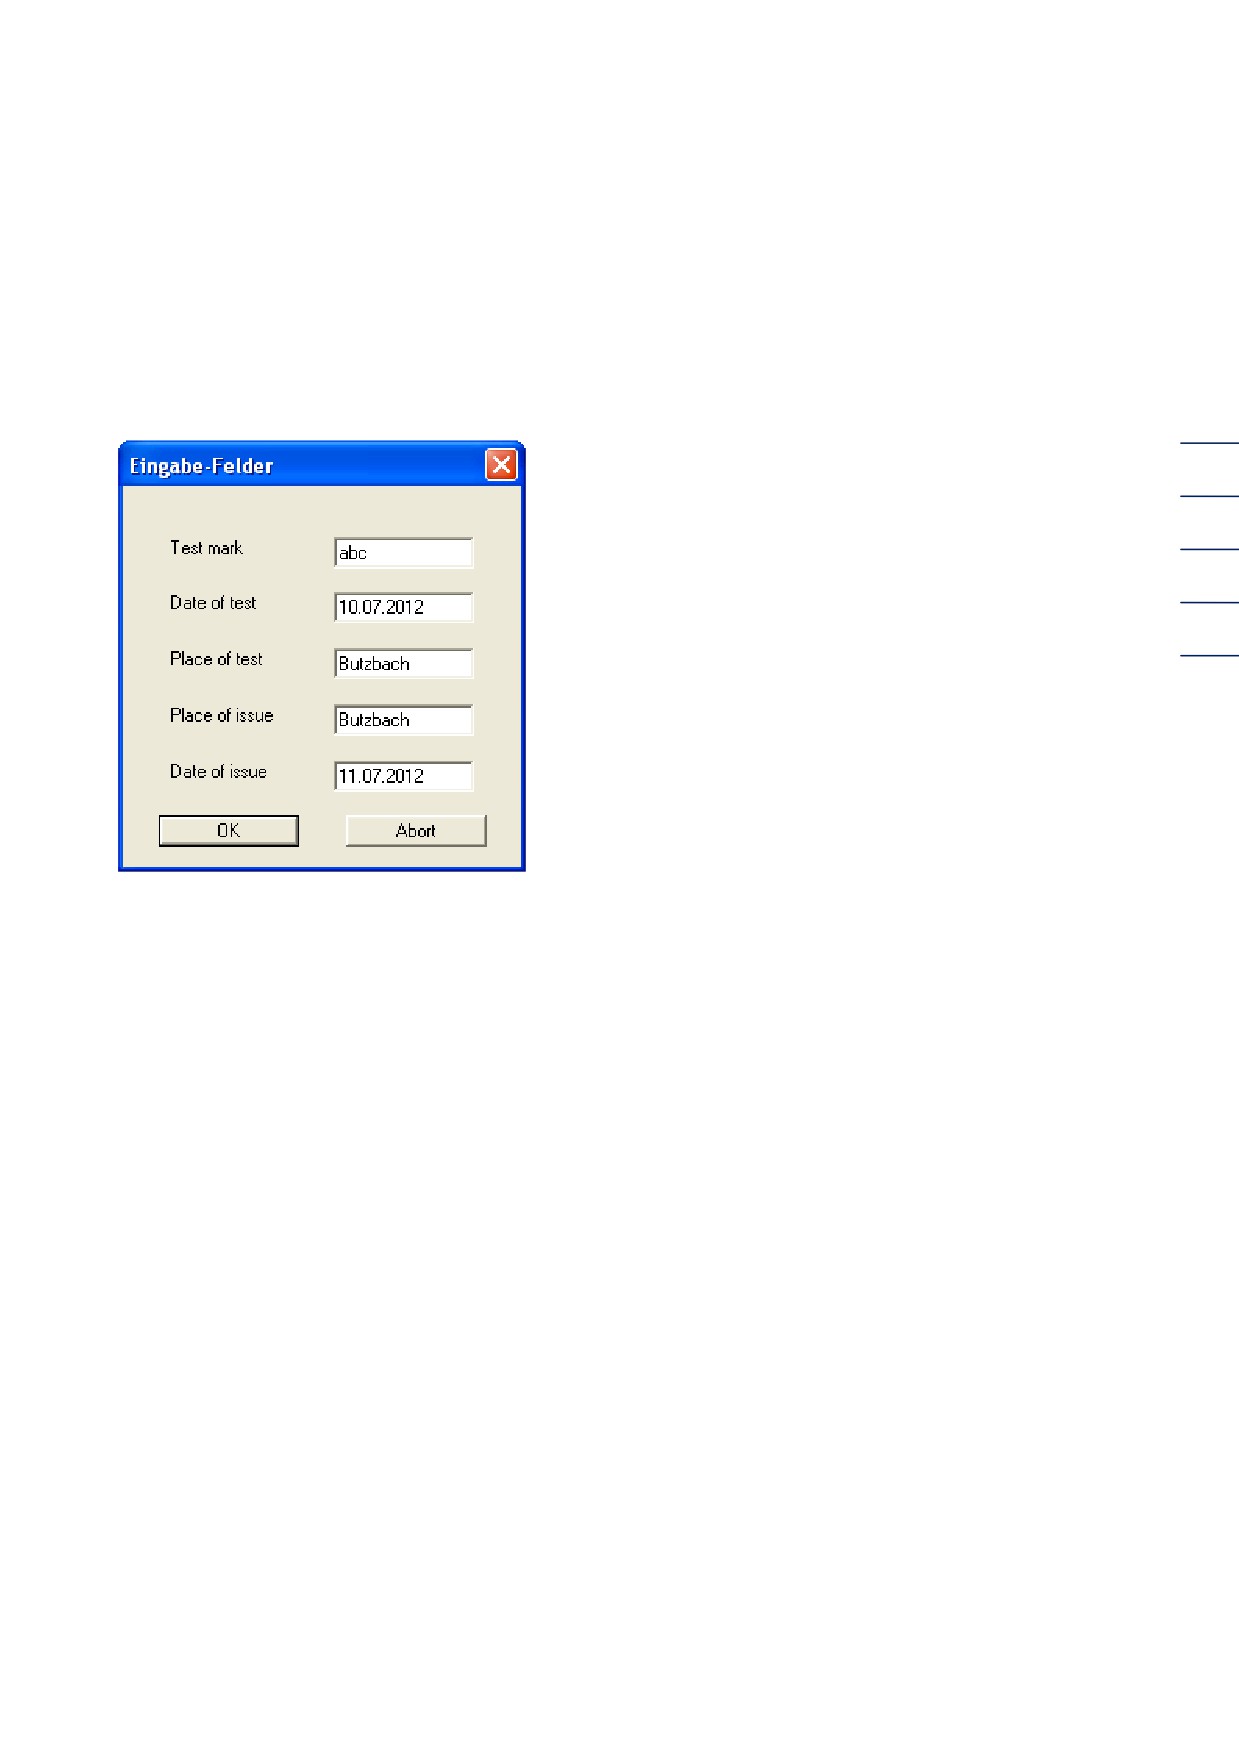
Another input field opens which you need to complete, then click Ok.
31
Figure 33: Input field window
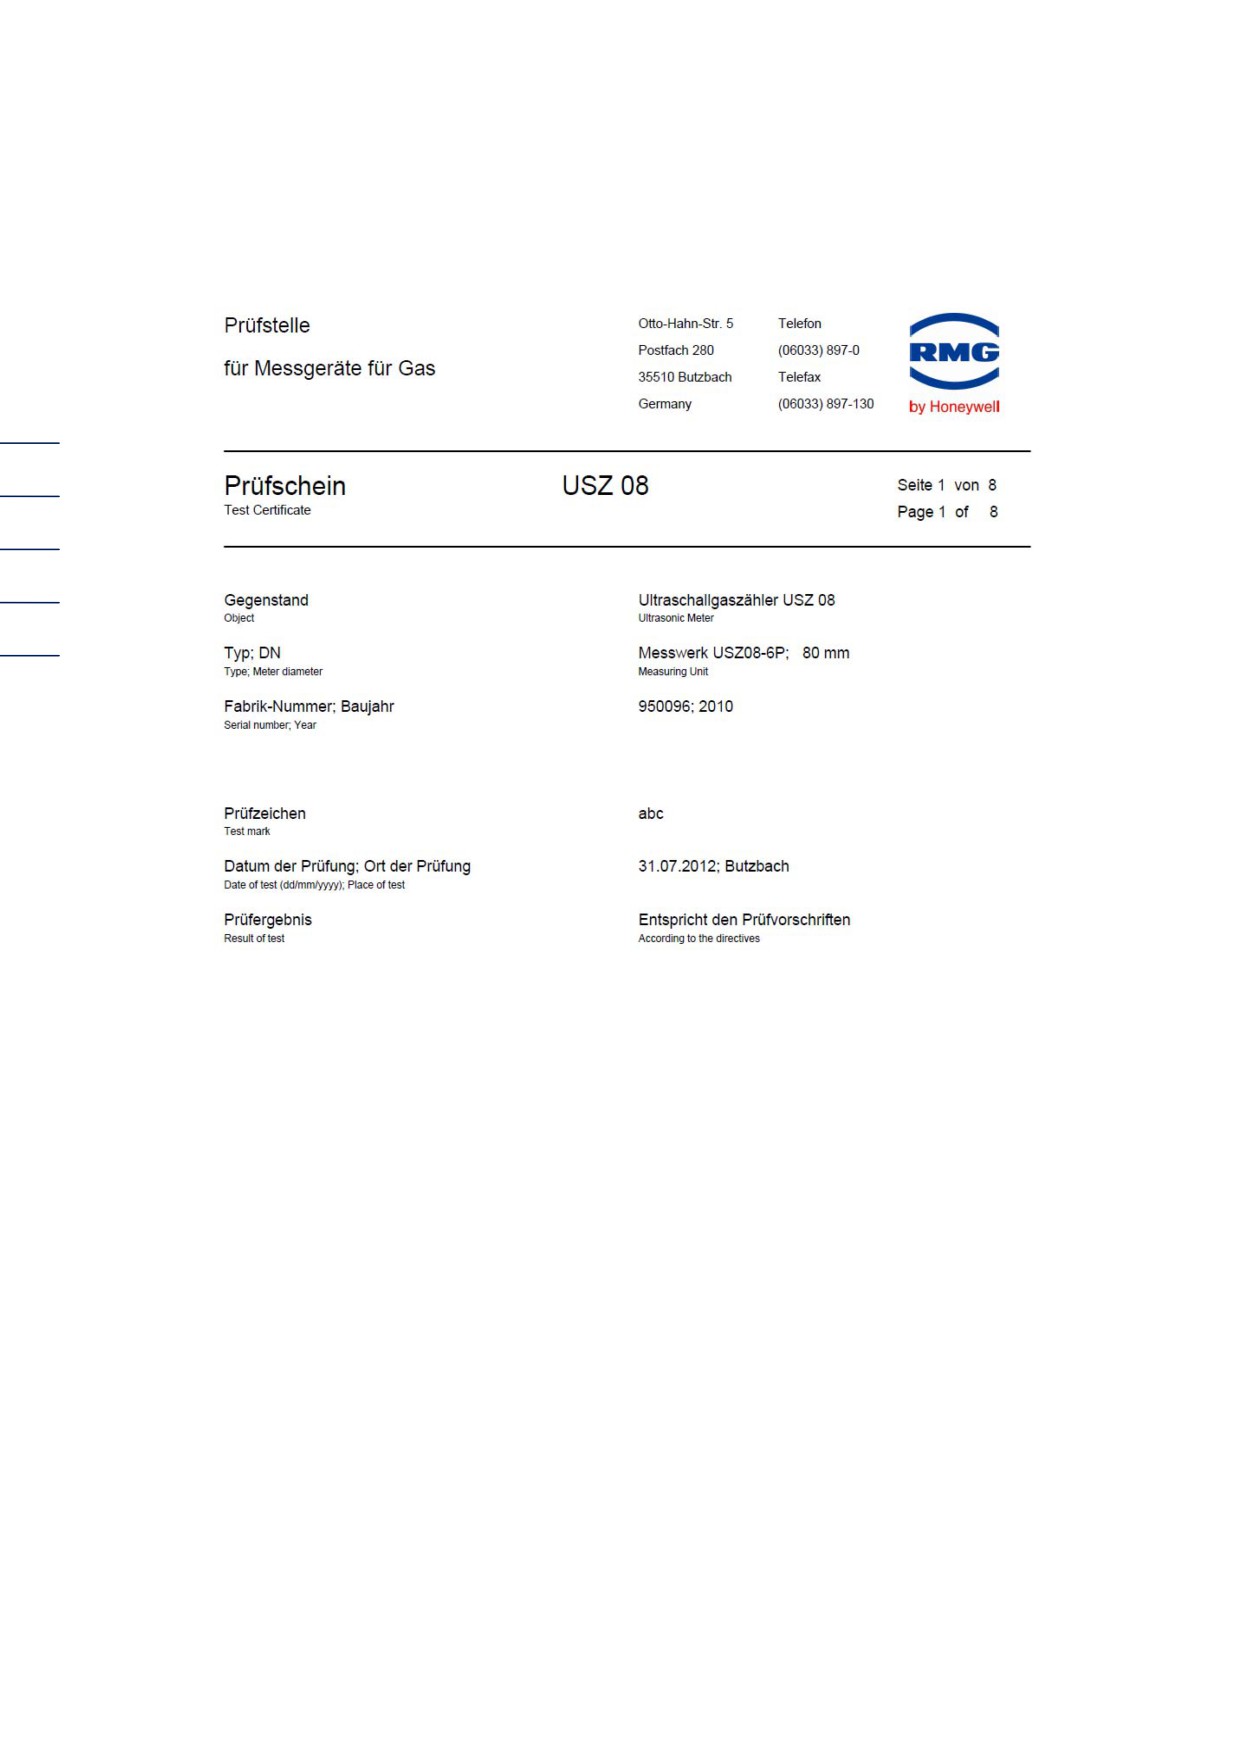
The test certificate appears as a pdf file.
3 "RMGVIEW LIST" WINDOW
32
Figure 34: Test certificate USM 09 (extract); page 1 of 8
3 "RMGVIEW LIST" WINDOW
3.9 Tools
A list with the following options opens when "Tools" is selected:
o Protocol editor
o Configure USE (can only be selected after entering a password)
o USE error/warnings
o Parameter log
o Event log
33
o Save window configuration
o Recreate window configuration
o Close all RMGView windows
o Open RMGView APPDATA folder
3.10 Protocol editor
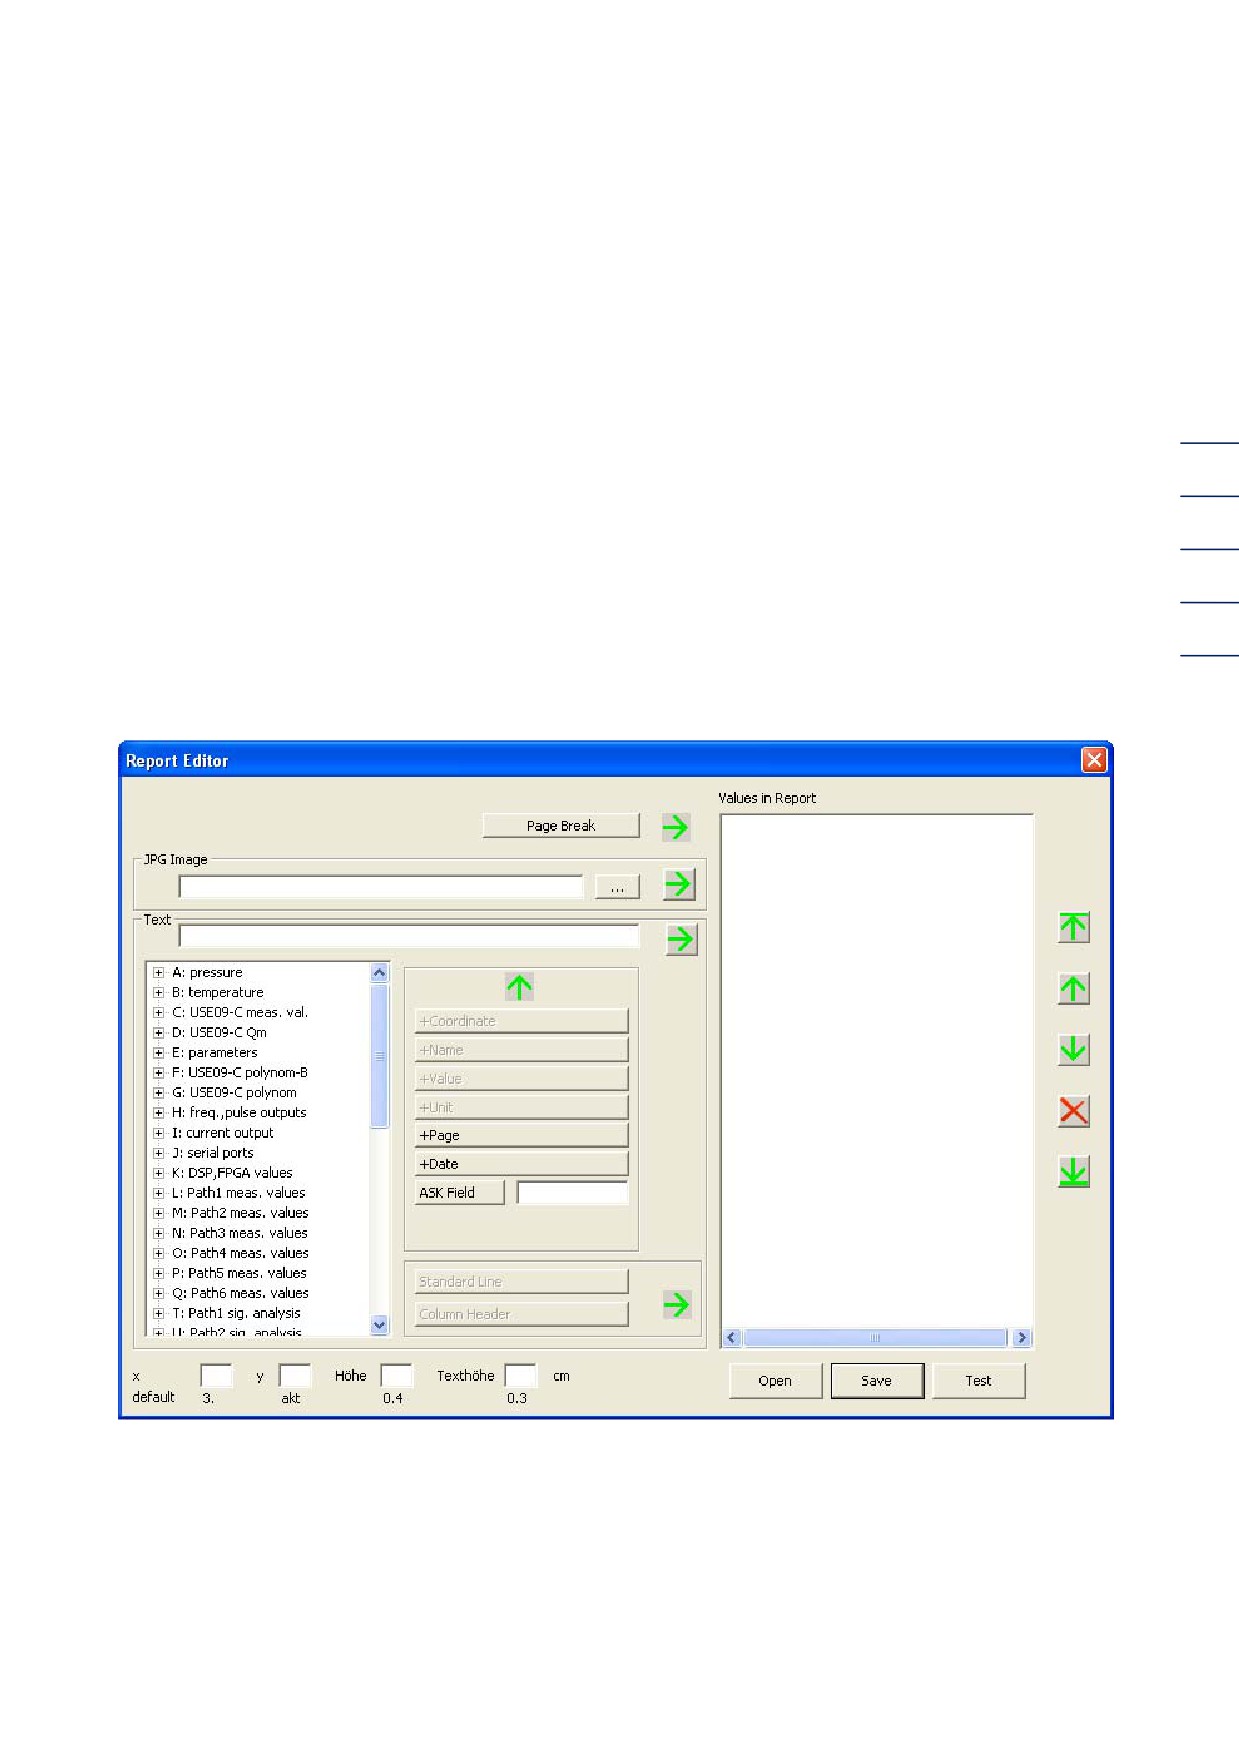
Figure 35: Protocol editor mask
Protocol layouts can be created and amended which can then be called up under the "Protocols"
menu point. A password must be entered for call-up.
3 "RMGVIEW LIST" WINDOW
A protocol is created by text or JPG image elements being written into the PDF document in
sequence. The elements are depicted in the right box.
The elements depicted in the right box can be transferred to this box by clicking on the arrows.
Text elements can be compiled in the Edit field text. Text can be inputted freely. The text elements
can (but do not need to) contain USE09 values which are selected in the left section. Free text can
be combined with the USE elements by clicking on the buttons configured under the upward-
pointing green arrow.
34
Text which can only be retrieved when the protocol is created, e.g. place of acceptance, can be
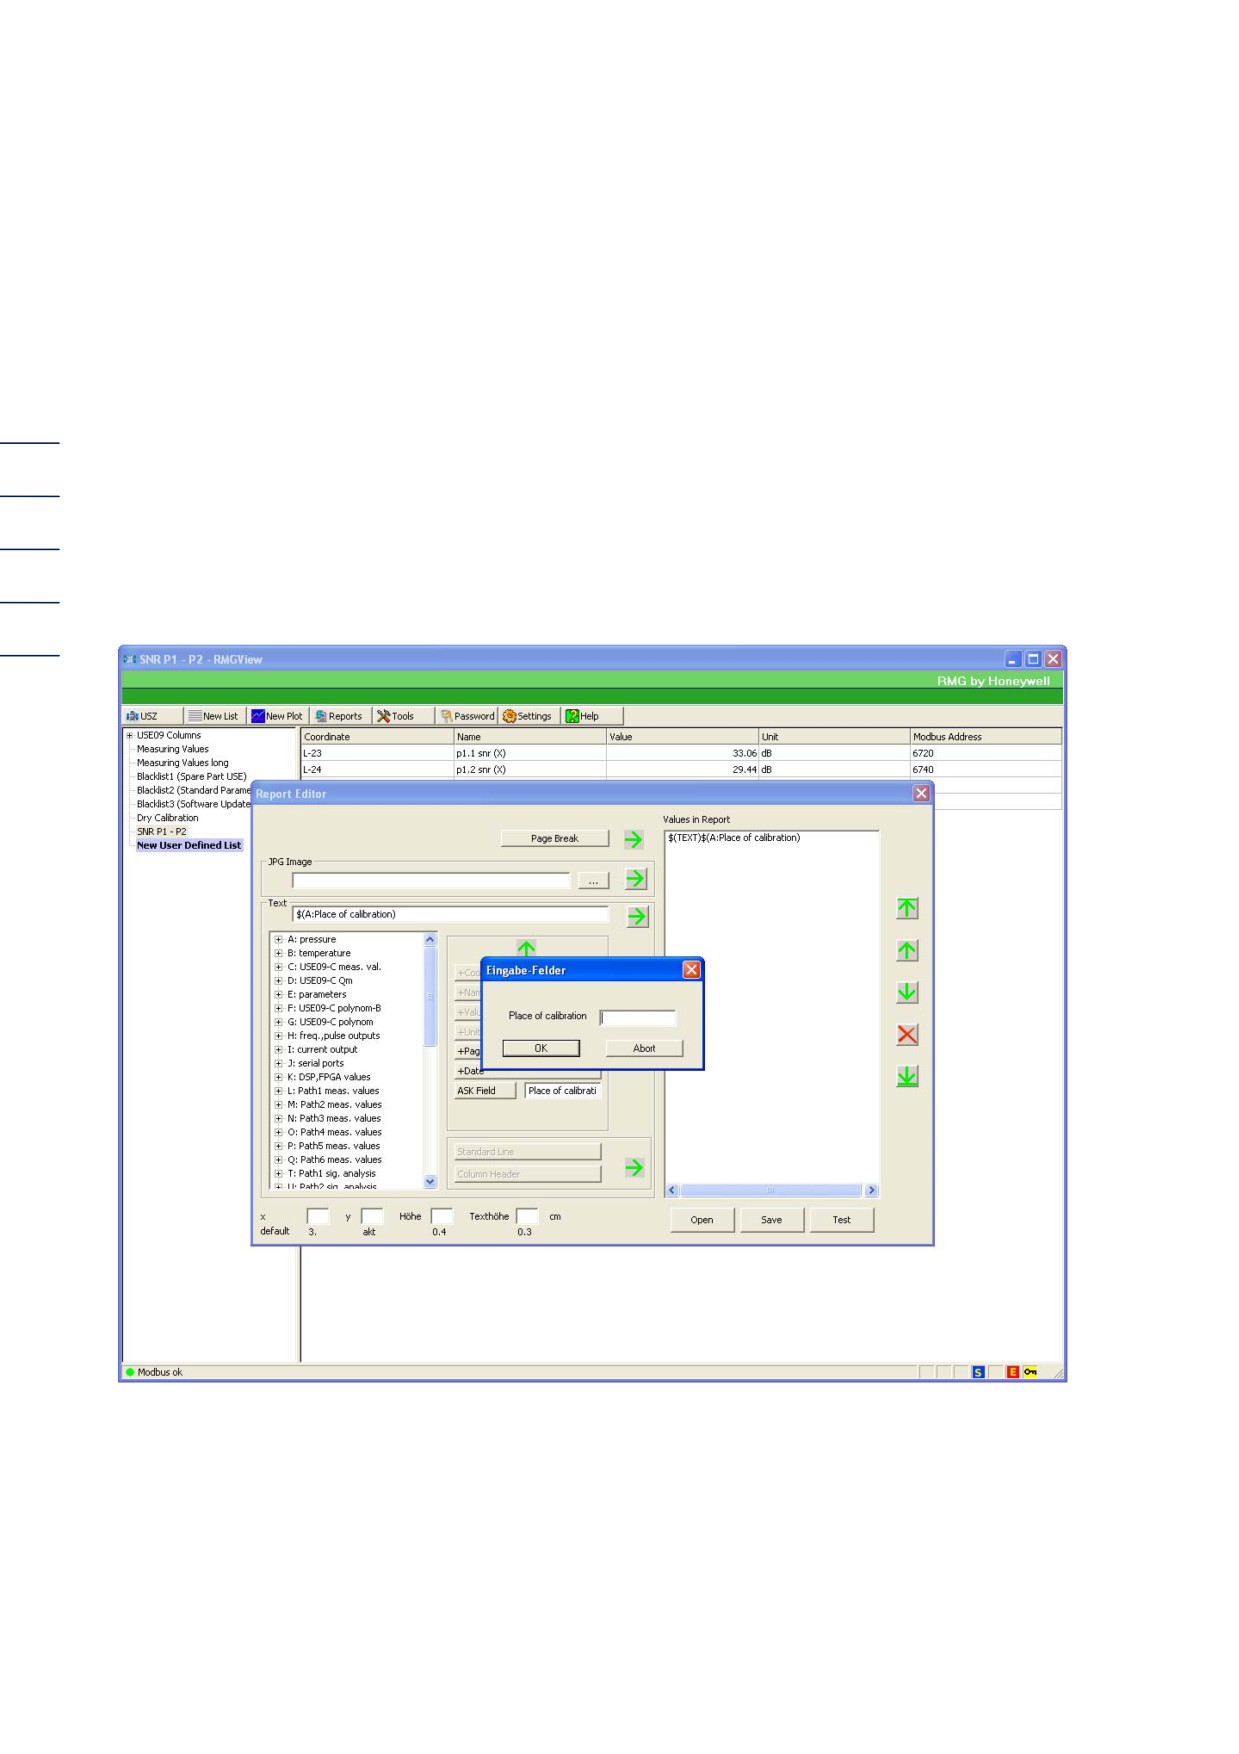
inputted in the ASK field. The text in the relevant edit field is used for retrieval.
The result can be viewed by clicking on the test button. The "Input fields" window appears where
the relevant information can then be inputted.
Figure 36: Example of input field
Standard line and column headings are depicted as in the standard protocol. There are special text
fields, a composition and connection with attributes (except y) does not make sense.
The elements are written onto an x,y coordinate.
The x-coordinate goes from left to right, the y-coordinate from bottom to top.
3 "RMGVIEW LIST" WINDOW
When a new page is commenced, the y-coordinate is initialized to 26.7 (DIN-A4 above - 1 cm) and
decremented by the amount of this element after issue of an element.
The x-coordinate is re-initialized for each element with 3.0 to the "left."
If an element has x, y, height, or text height information (edit fields below), this is included.
The .rpr files in which the protocol layouts are stored can also be directly edited with a text editor of
your choice. It is recommended that syntax is taken from the sample files which you created with
the protocol editor.
35
3.11 Configure USE
A password must be active to select this function. This enables parameters to be transferred from
a CSV protocol into a USE09.
In order to prevent the transfer of unwanted values, e.g. time, meter states, meter state setting, a
list created with the "Editor for user-defined lists" can be specified as a blacklist. Parameters
contained in this list are disregarded.
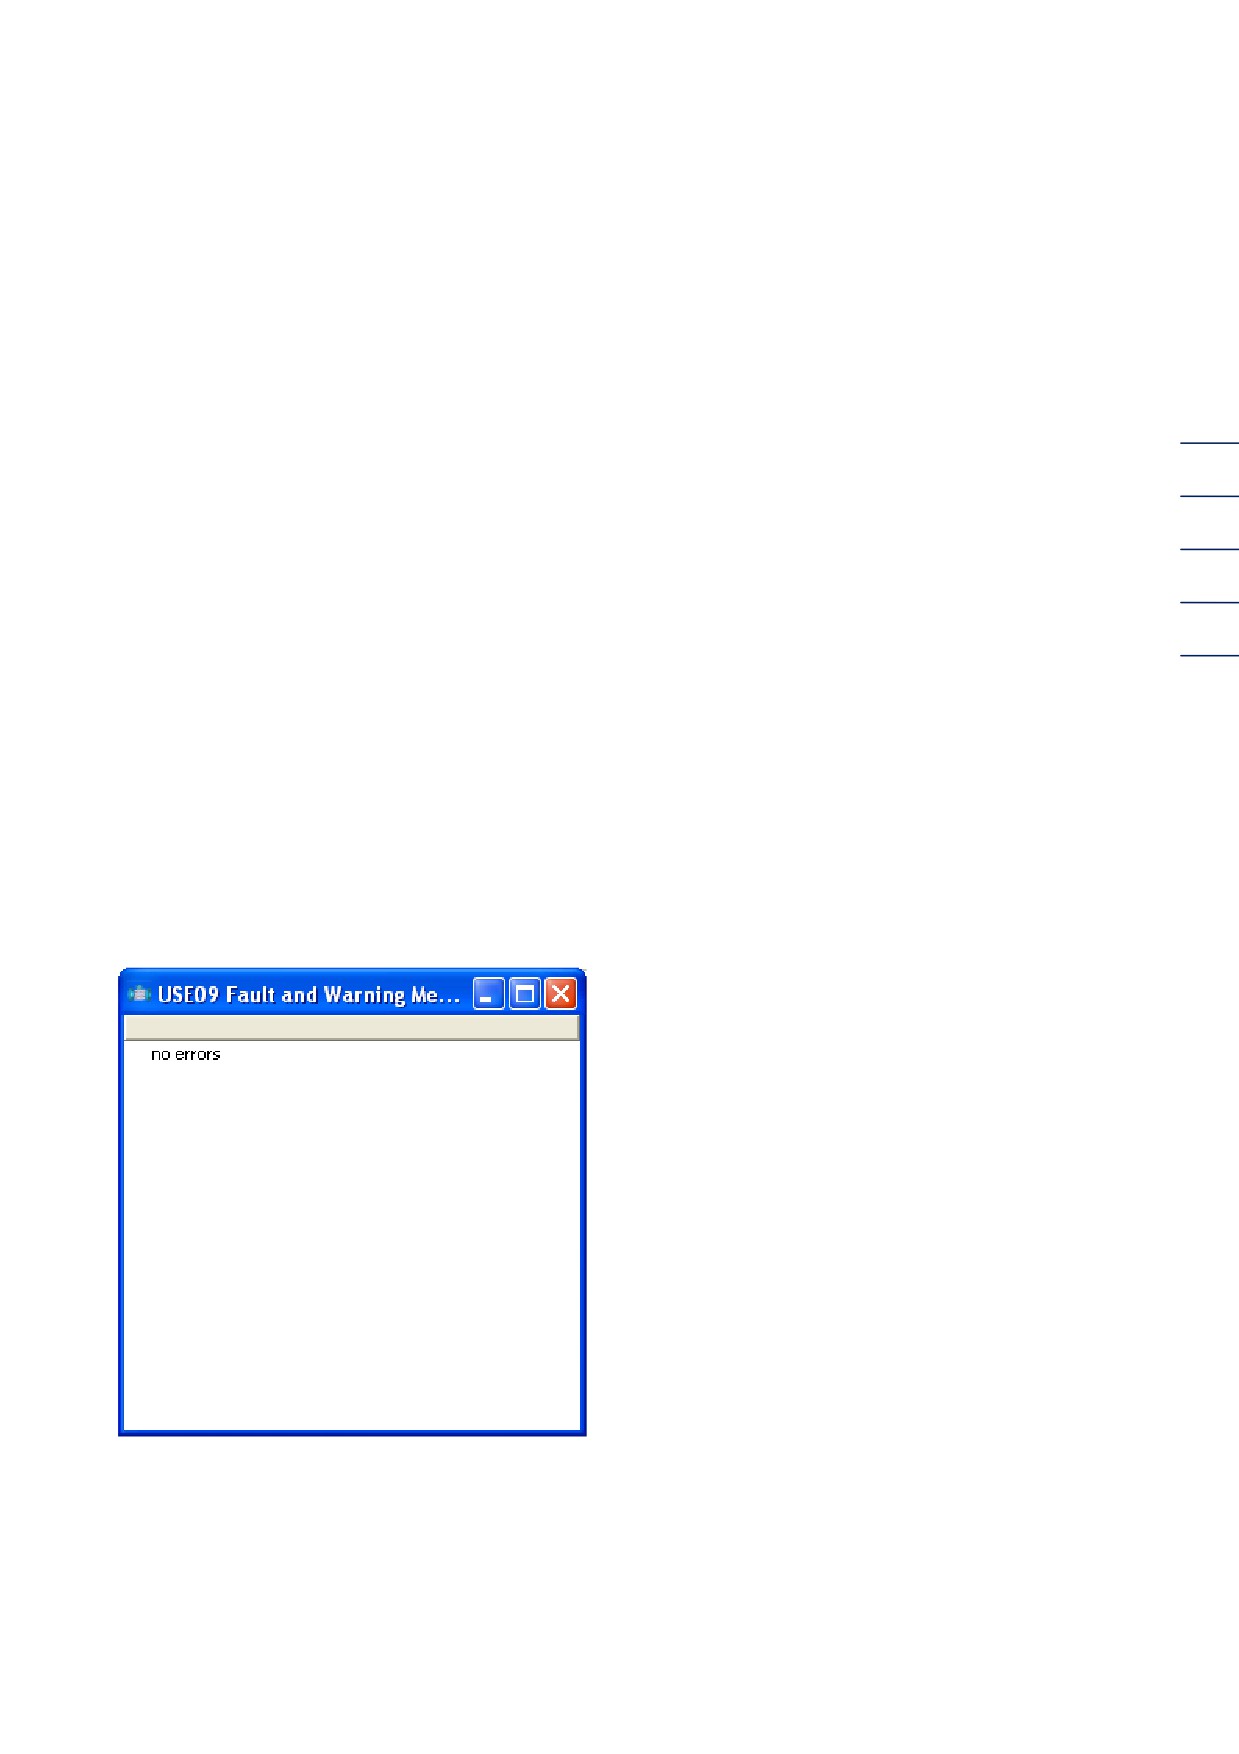
3.12 USE09 error/warnings
This window can be opened by selecting the Tools->Error notifications menu item or by clicking the
error and warning symbol in the status bar. The current USE09 error and warning notifications are
displayed.
Figure 37: USE error warnings
3 "RMGVIEW LIST" WINDOW
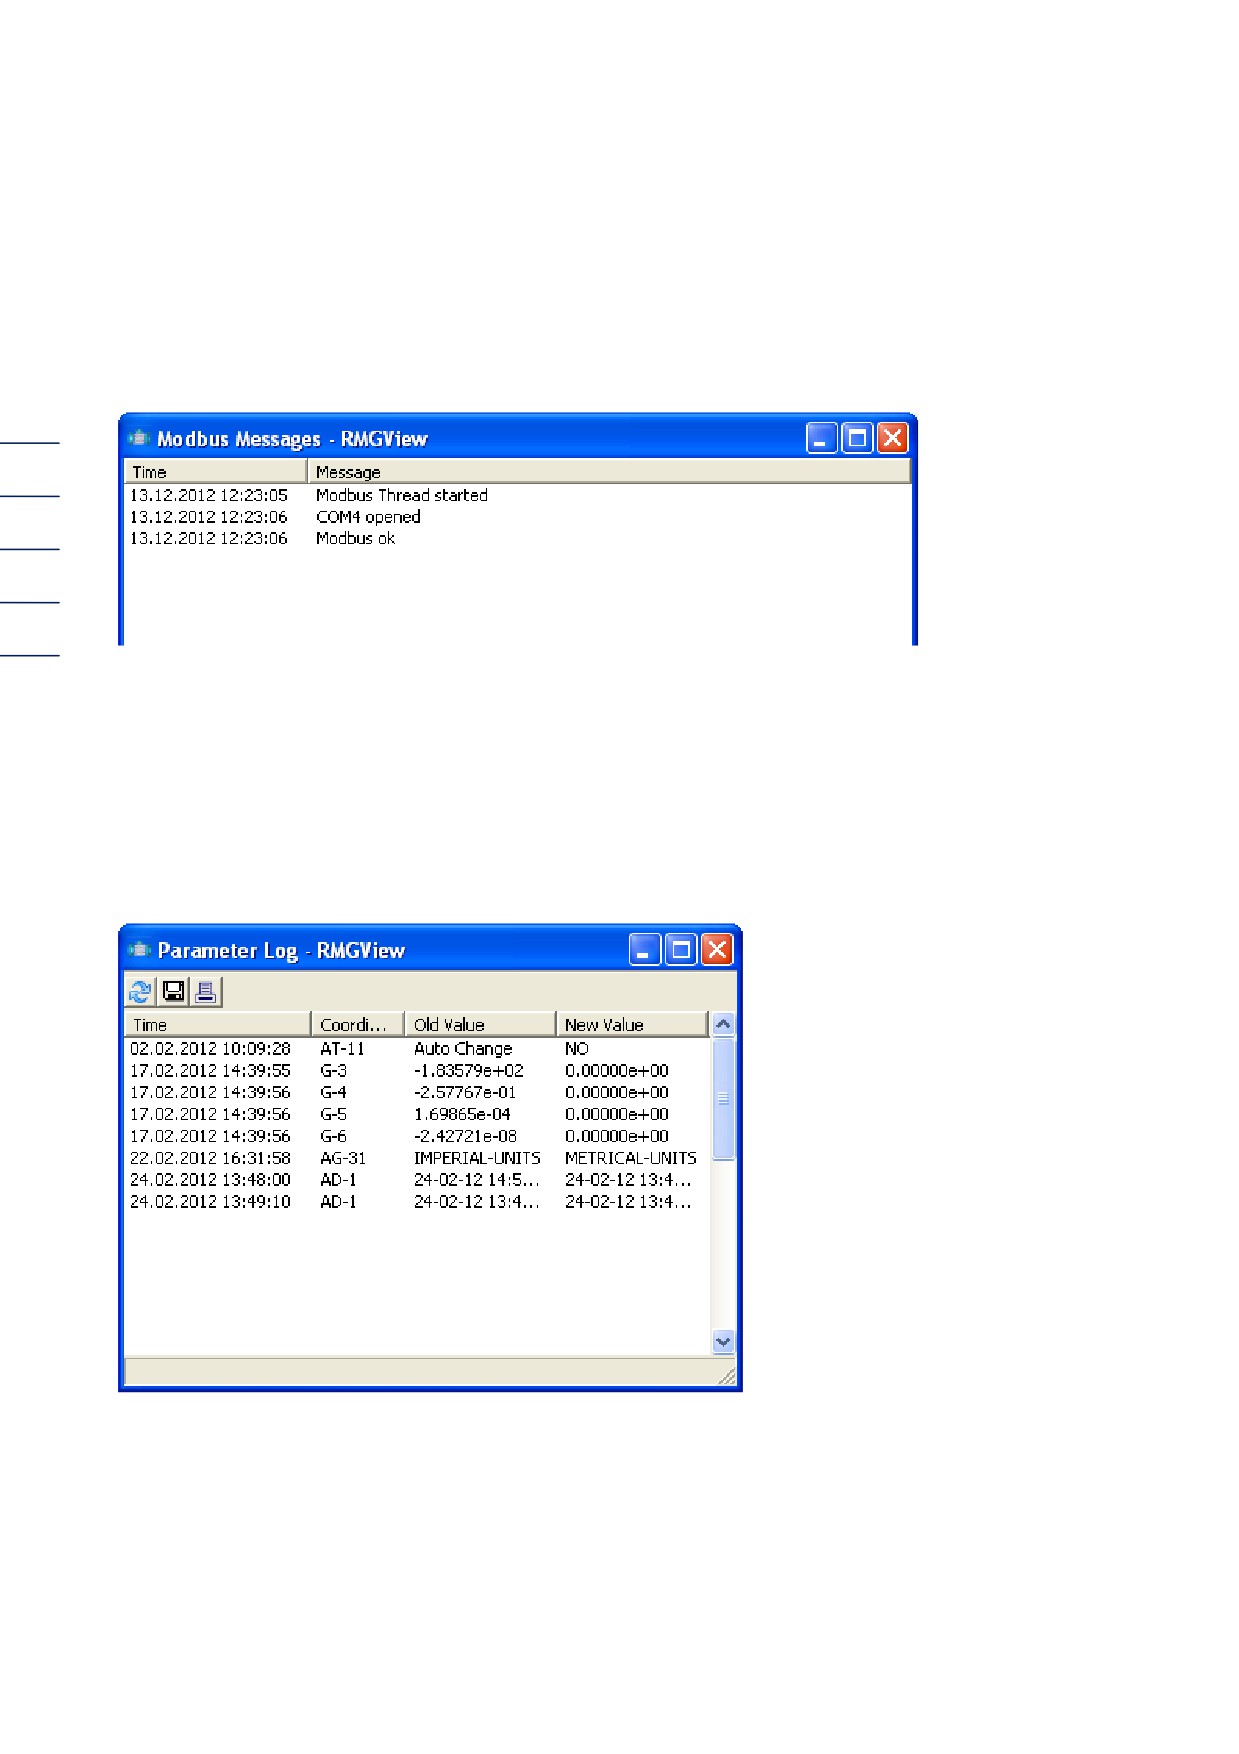
3.13 Modbus notifications
This window can be opened by selecting the Tools->Modbus notifications menu item or by double-
clicking the modbus error symbol (see p. 5, Fig. 4) in the status bar. Its purpose is to diagnose
Modbus communication problems.
36
Figure 38: Modbus notifications
3.14 Parameter log
This window depicts the parameter log file read out from USE09. The parameter log can be read
out again by clicking on the update symbol. The values can be exported as text and CSV files by
clicking on the save symbol.
Figure 39: Parameter log
3 "RMGVIEW LIST" WINDOW
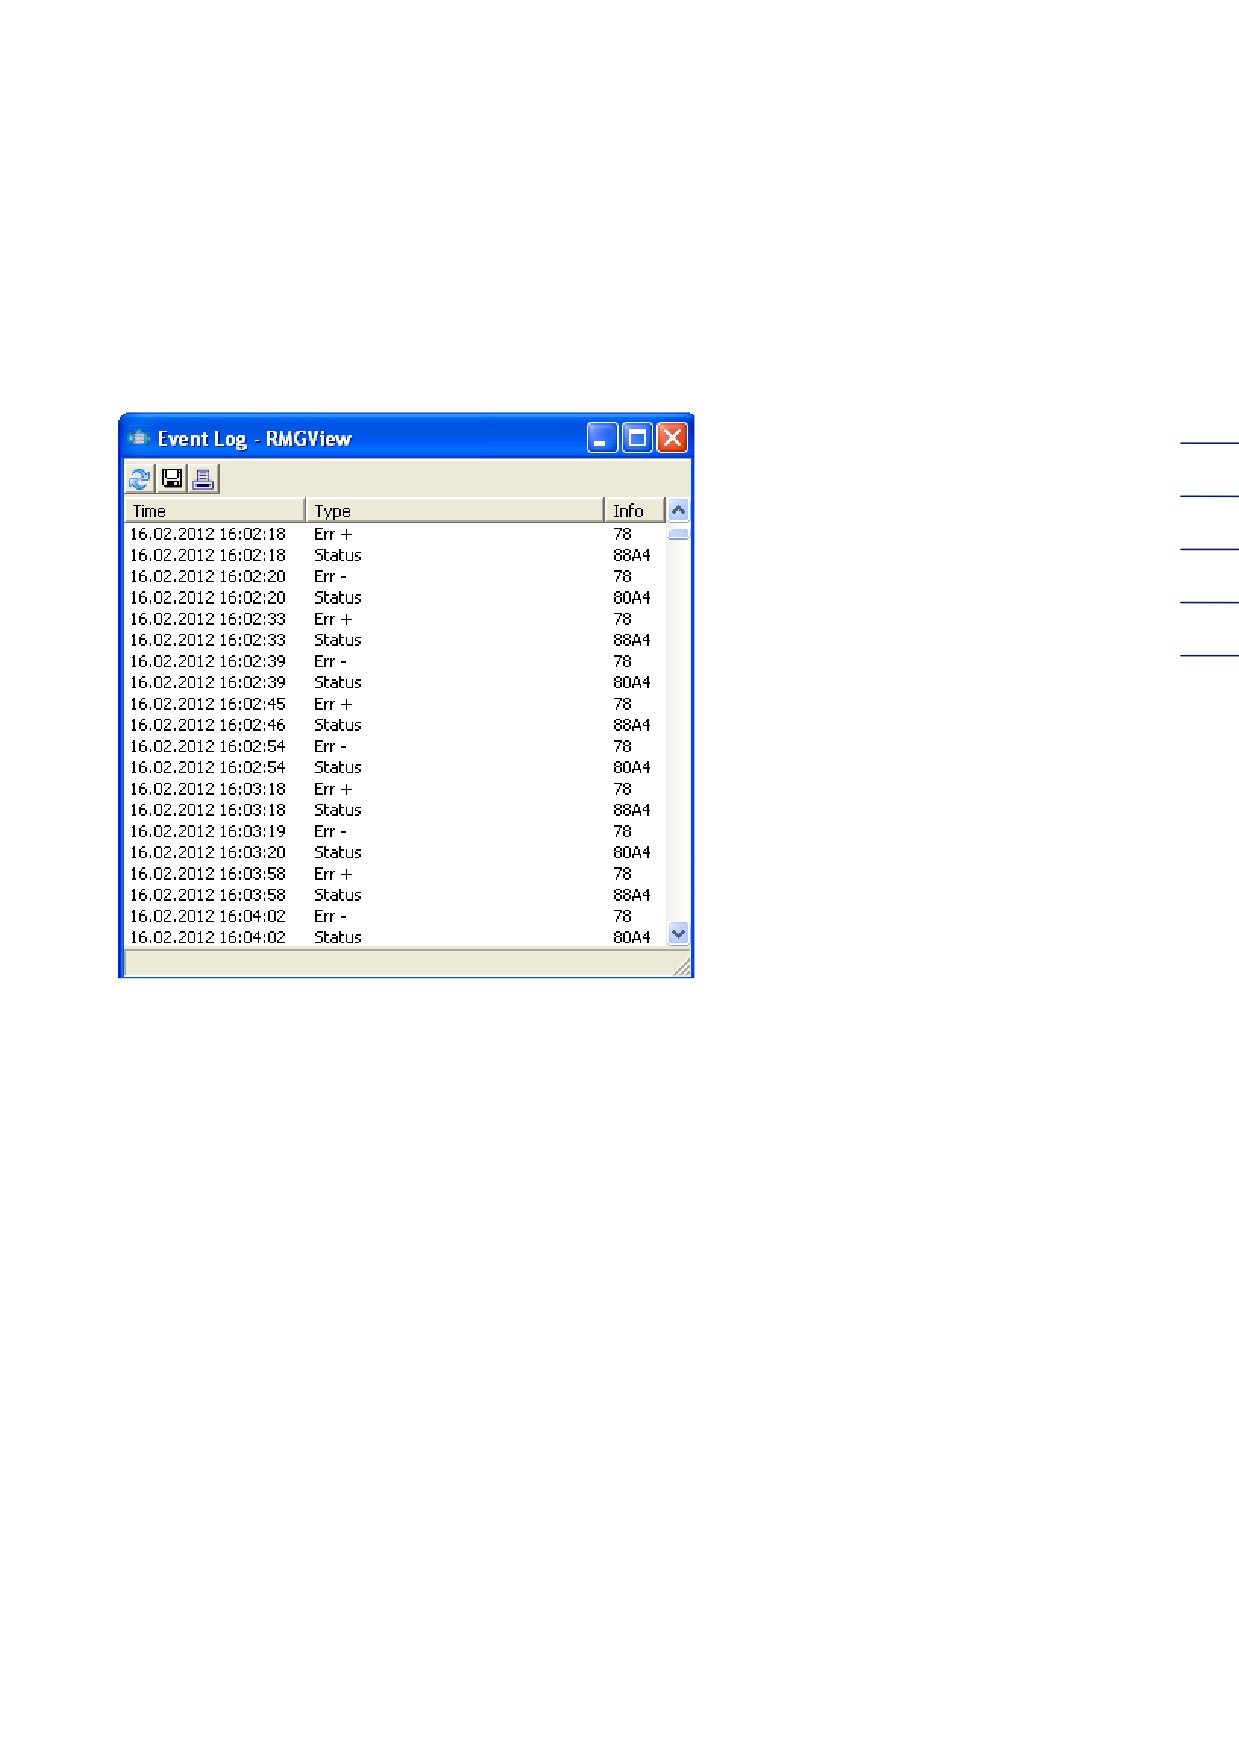
3.15 Event log
This window depicts the event log file read out from USE09. The event log can be read out again
by clicking on the update symbol. The values can be exported as text and CSV files by clicking on
the save symbol.
37
Figure 40: Event log
3.16 Save window configuration
Clicking on this line opens a window to select a folder in which this window configuration should be
saved.
3.17 Recreate window configuration
Here a window opens enabling a file to be selected where the desired configuration is saved. If you
click on it, the saved window configuration is displayed again.
3.18 Closing all RMGView windows
... exits the program
3.19 Opening RMGView APPDATA folder ...
… opens the folder with the RMGView application data.
4 INSTRUMENT PANEL
4 Instrument panel
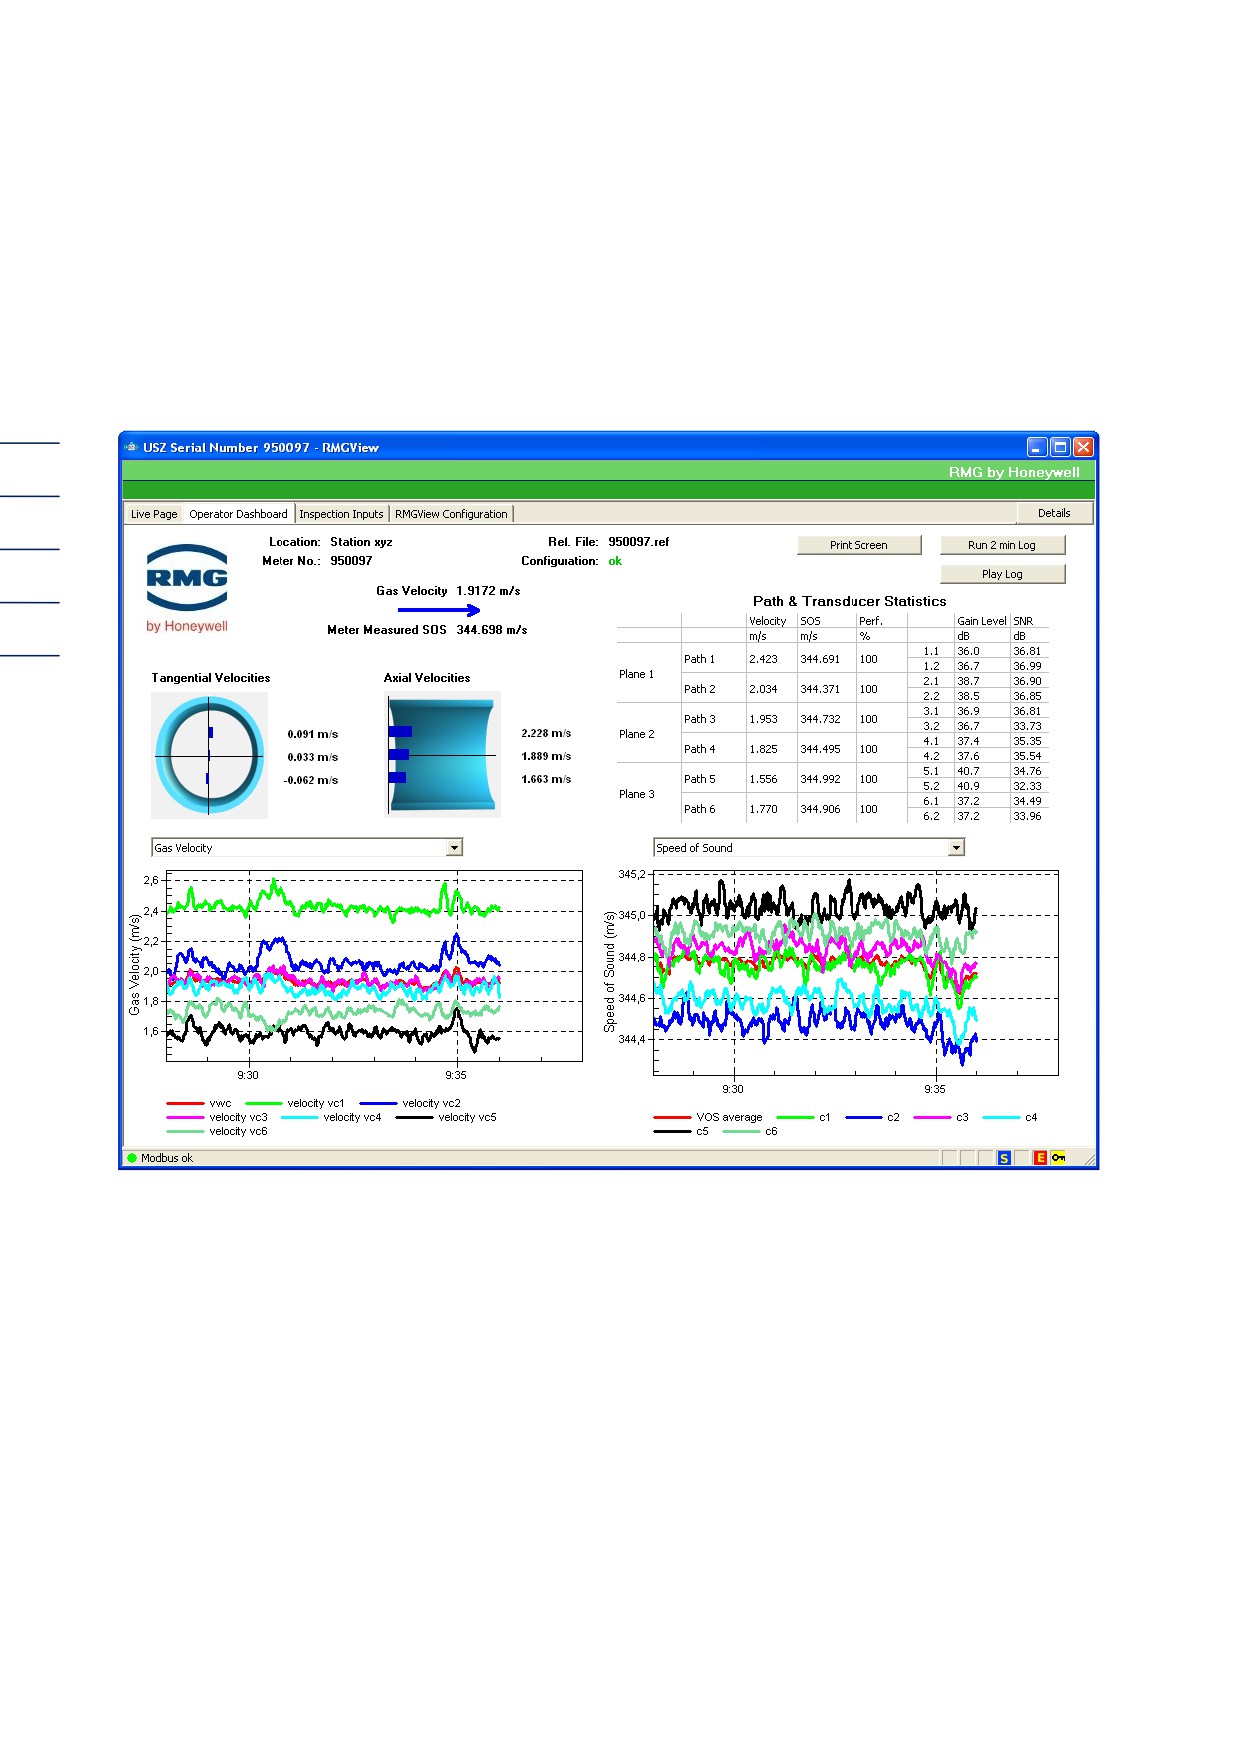
The following windows of the RMGView mask cannot be viewed without a password.
Go to Details-> Password to input the password. The password for the configurator mode is
RMGUSE-P. A yellow key appears in the status line after inputting the configurator password.
38
Figure 41: Instrument panel
4.1 General information:
In the upper section you will find the same information as in the "Live values" screen (location,
measuring element no., ref. file, and configuration).
The "Print Screen," "Record 2 min log," and "Play back log" buttons can be found at the same
location and lead to the same activities.
Information regarding the average gas speed and the current speed of sound are depicted below,
in addition to the direction of flow (blue arrow = forward).
4 INSTRUMENT PANEL
4.2 Flow profiles:
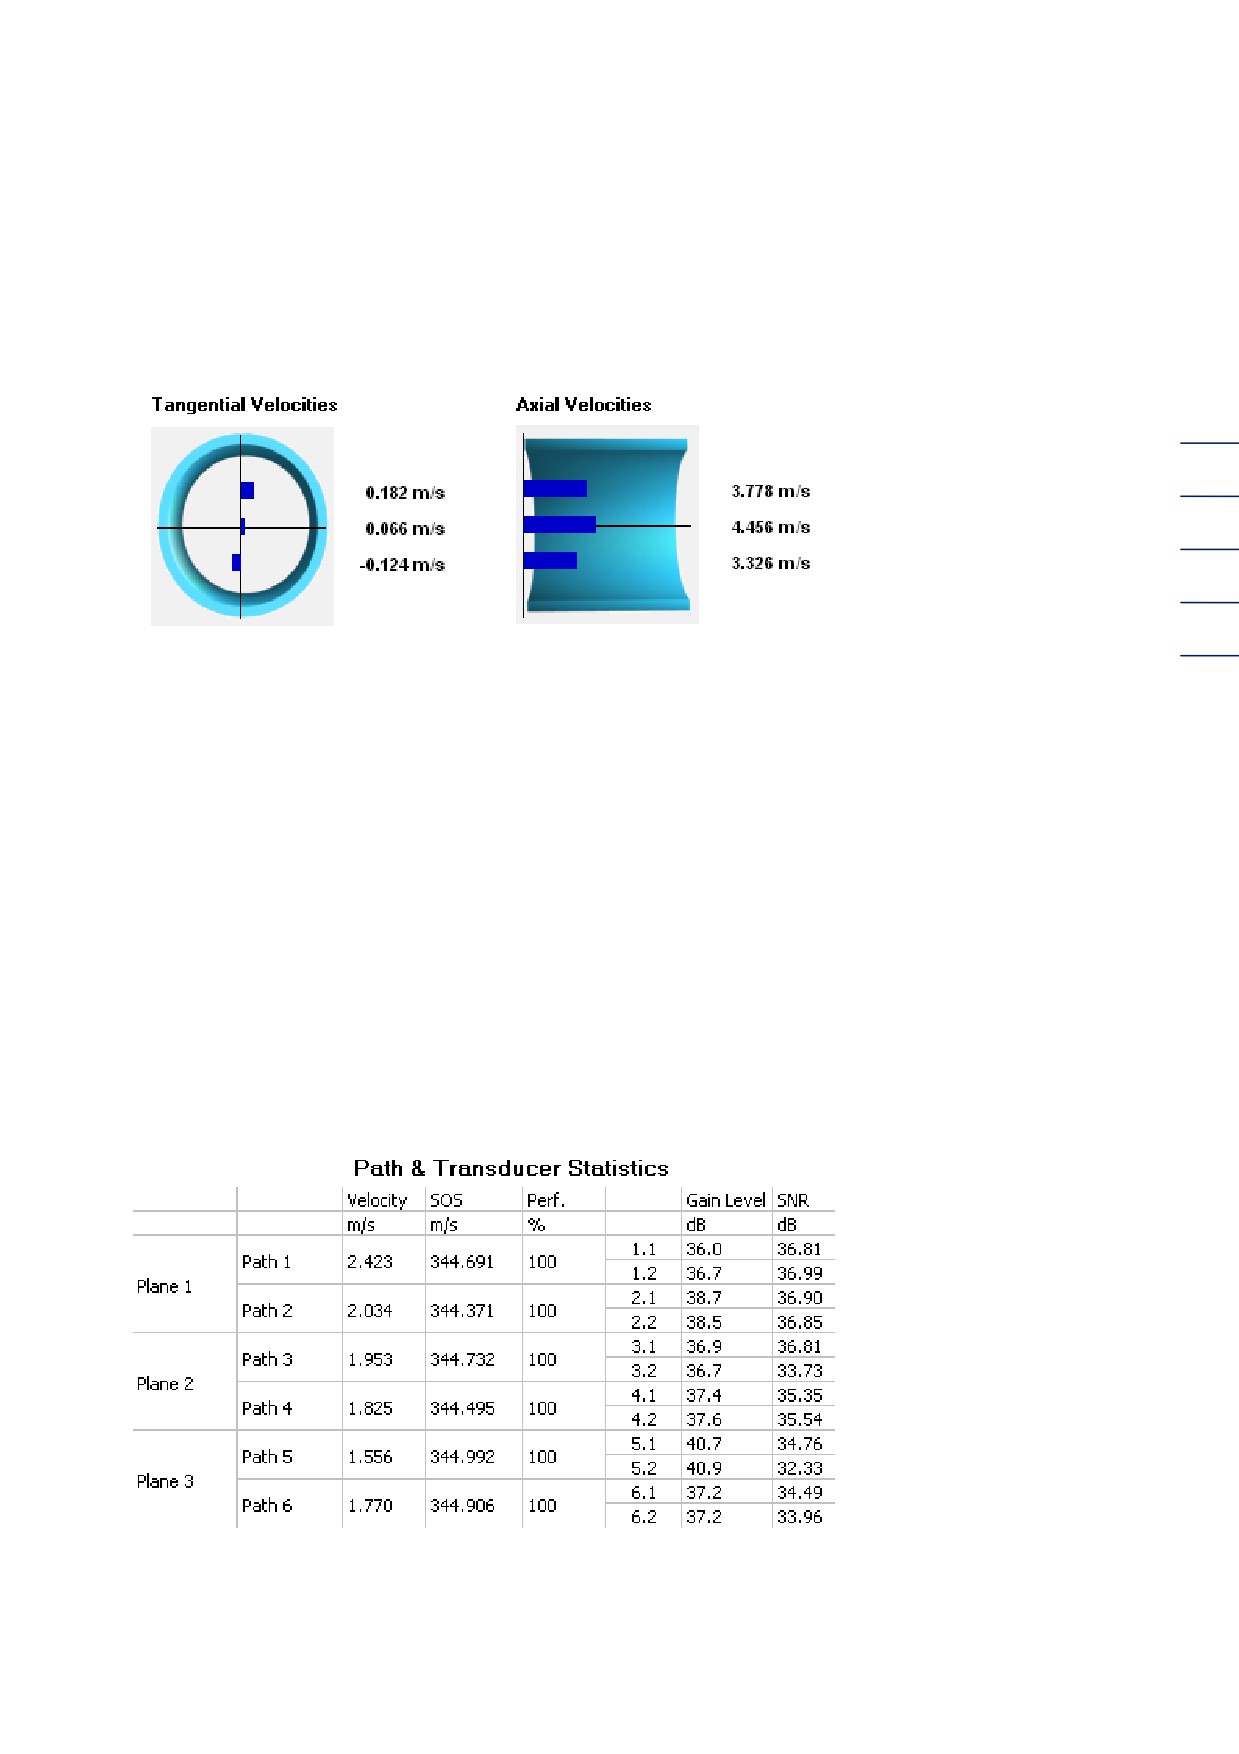
The flow profiles, tangential speed (left), and axial speed (right) are depicted as "Live" in the center
in the x and z directions. The values are updated every second.
39
Figure 42: Flow profiles
4.3 Path & transmitter measurement values:
The state of all sensors is displayed separately adjacently to the right in a table for each path and
level: The compiled values are:
o Gas speed
o SOS (speed of sound)
o
%valid (number of valid measurements)
o
AGC Level (Automatic Gain Control)
o
SNR (Signal Noise Ratio)
Instances of exceeding limit values (red/yellow) are displayed in the %valid and SNR columns.
These values are also updated every second.
Figure 43: Path & transmitter measurement values
4 INSTRUMENT PANEL
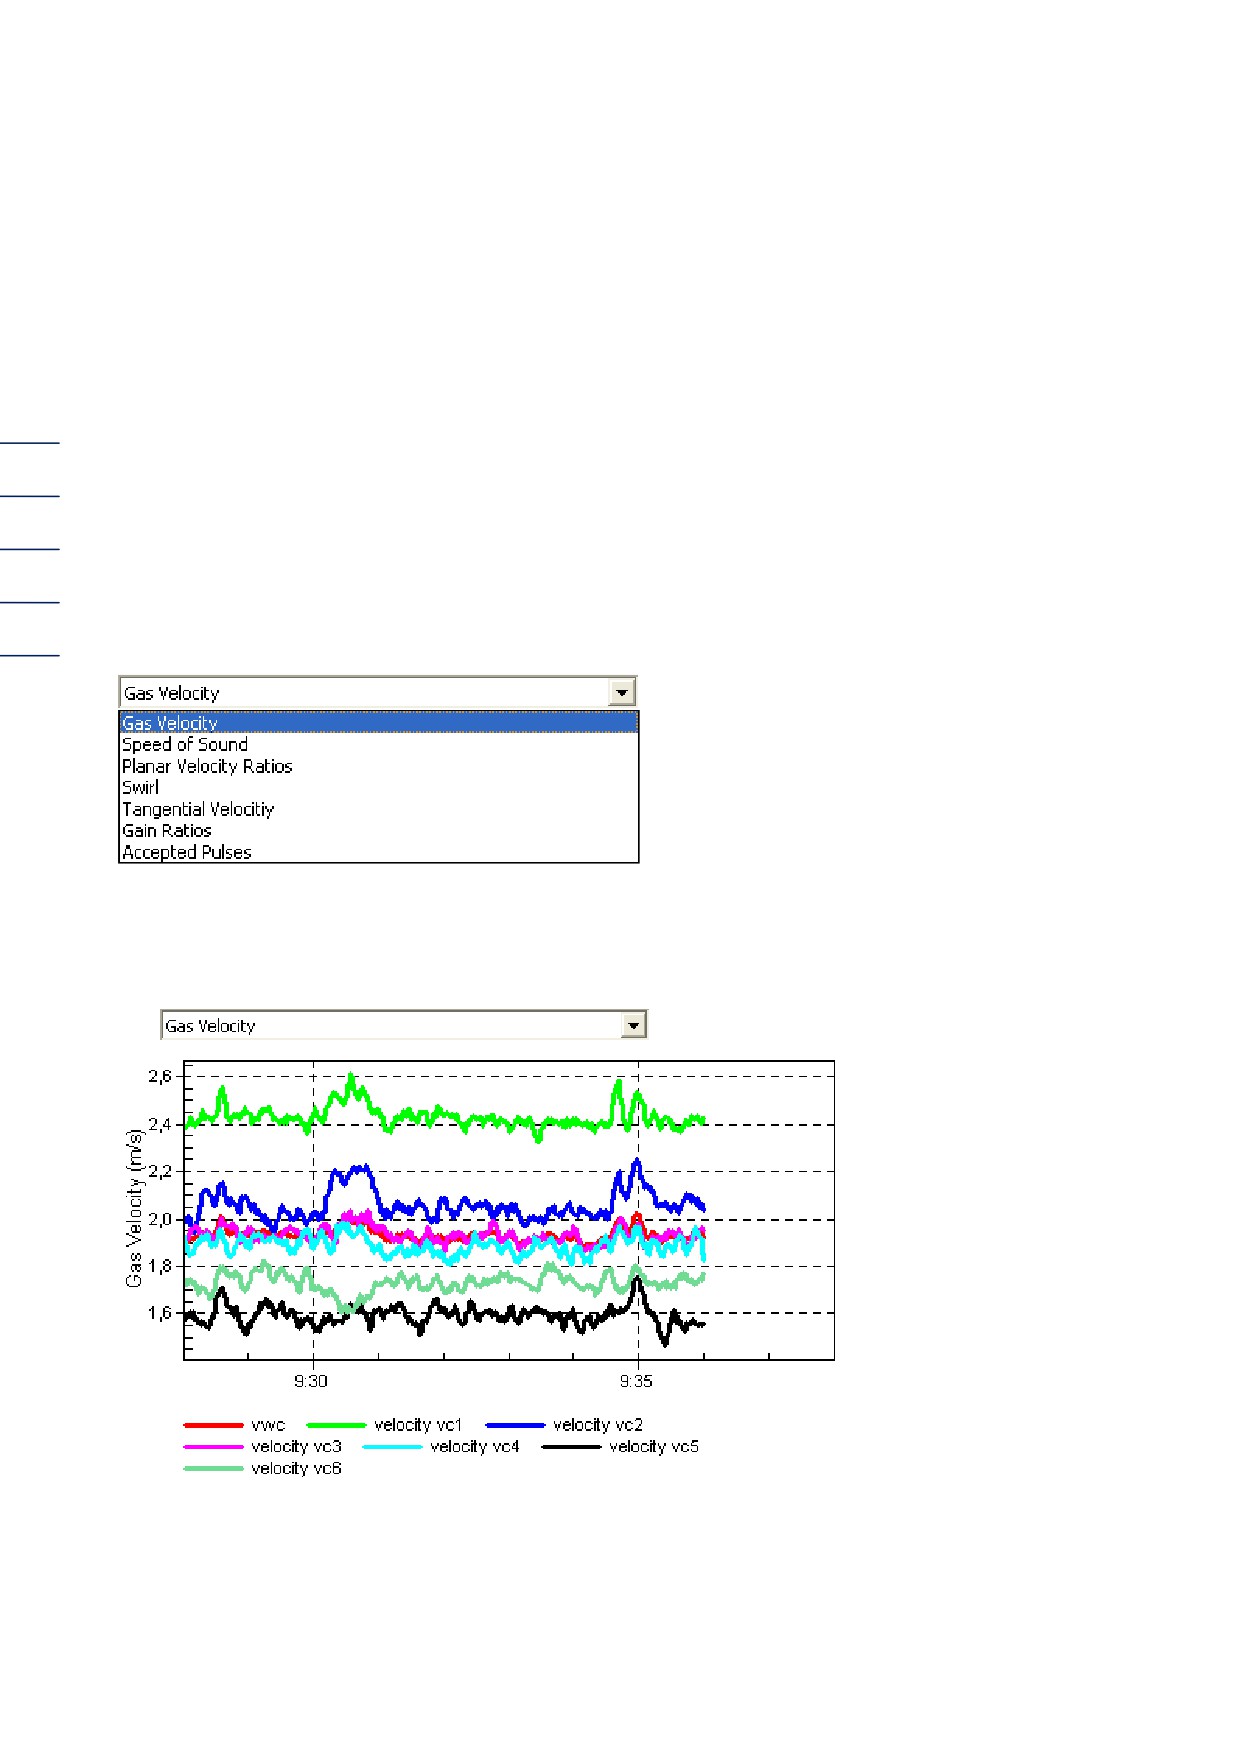
4.4 Live Plots:
There are 2 live plots in the lower section of this screen regarding where and with different colors
different measurement values can be viewed and tracked.
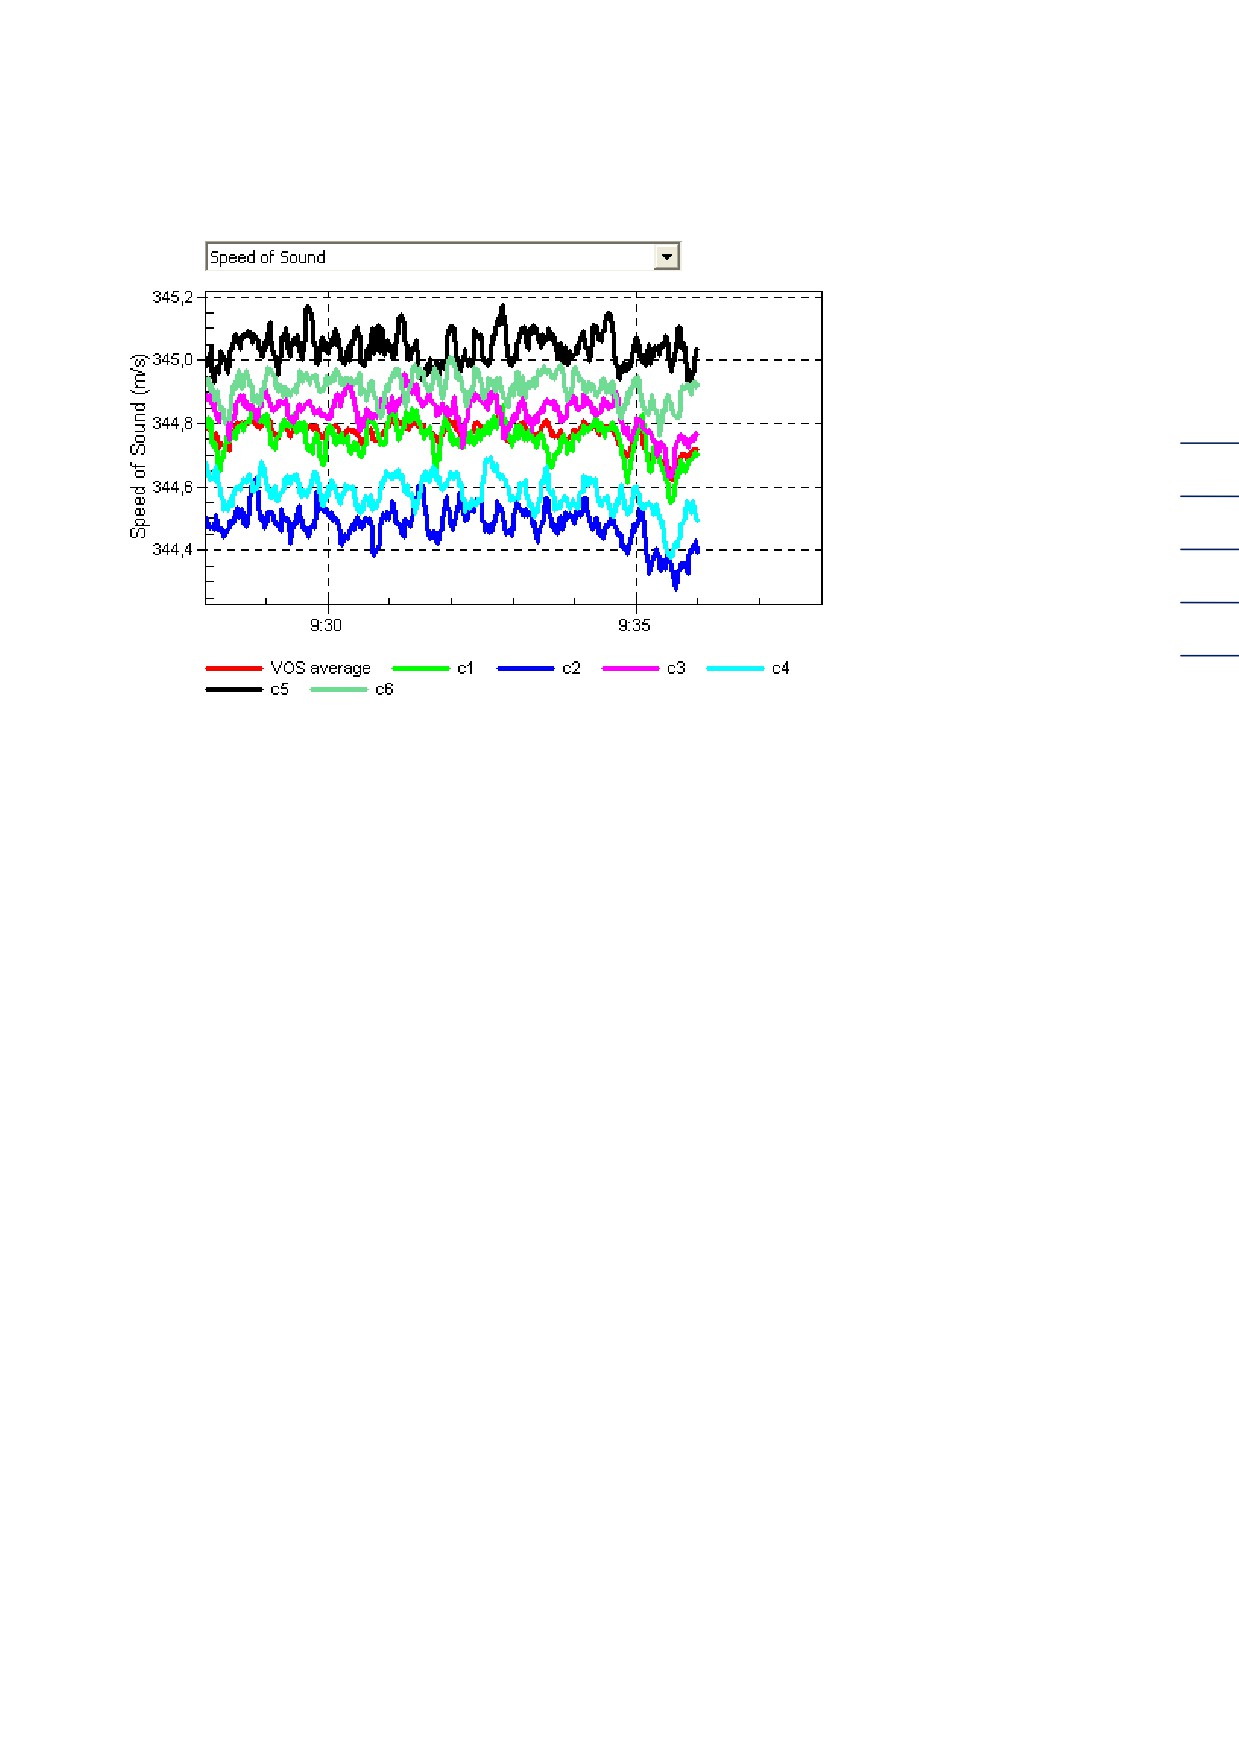
A selection can be made on both plots between
o Gas speed
o Speed of sound
40
o Speed ratio level
o Swirl
o Tangential speed
o AGC ratios
o
%valid
Figure 44: Selection fields for plot displays
Figure 45: Left plot, gas speed is selected
4 INSTRUMENT PANEL
41
Figure 46: Right plot, speed of sound is selected
If you hold the cursor in any position in one of the plots and drag it right, you zoom into the relevant
range. The zoom is canceled by pressing the z key on the keyboard.
A selection window "Export"/"Print"/"Cancel zoom" appears by right-clicking in one of the plots. If
you click on Export, you are asked for the file format (pdf or jpg), select this (pdf is offered). If you
click on Export again, the "Protocols" folder appears in which the file can be saved. It is then
displayed and can also be printed out.
If you click on Print, the plot can also be directly printed out.
With Cancel zoom you can also reverse the zoom function.
5 TEST VALUES
5 Test values
42
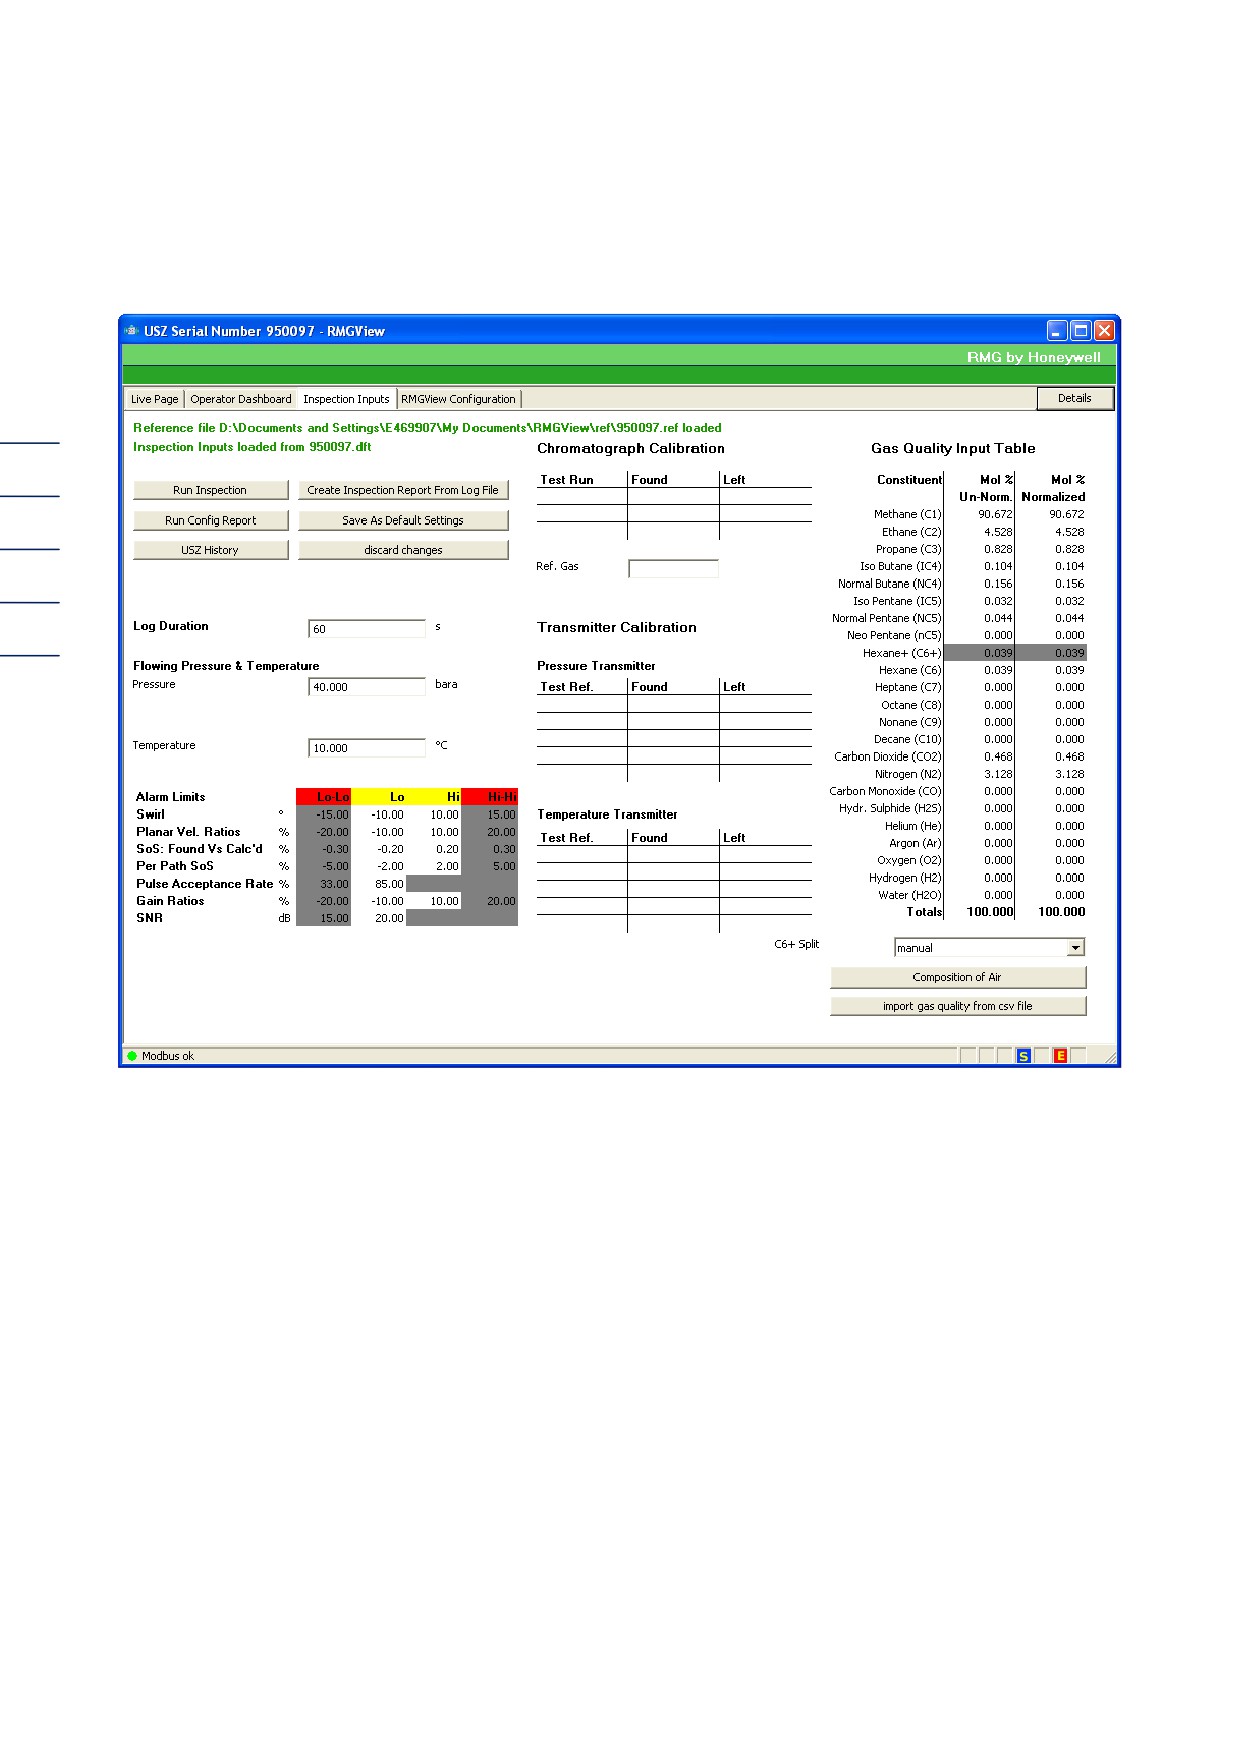
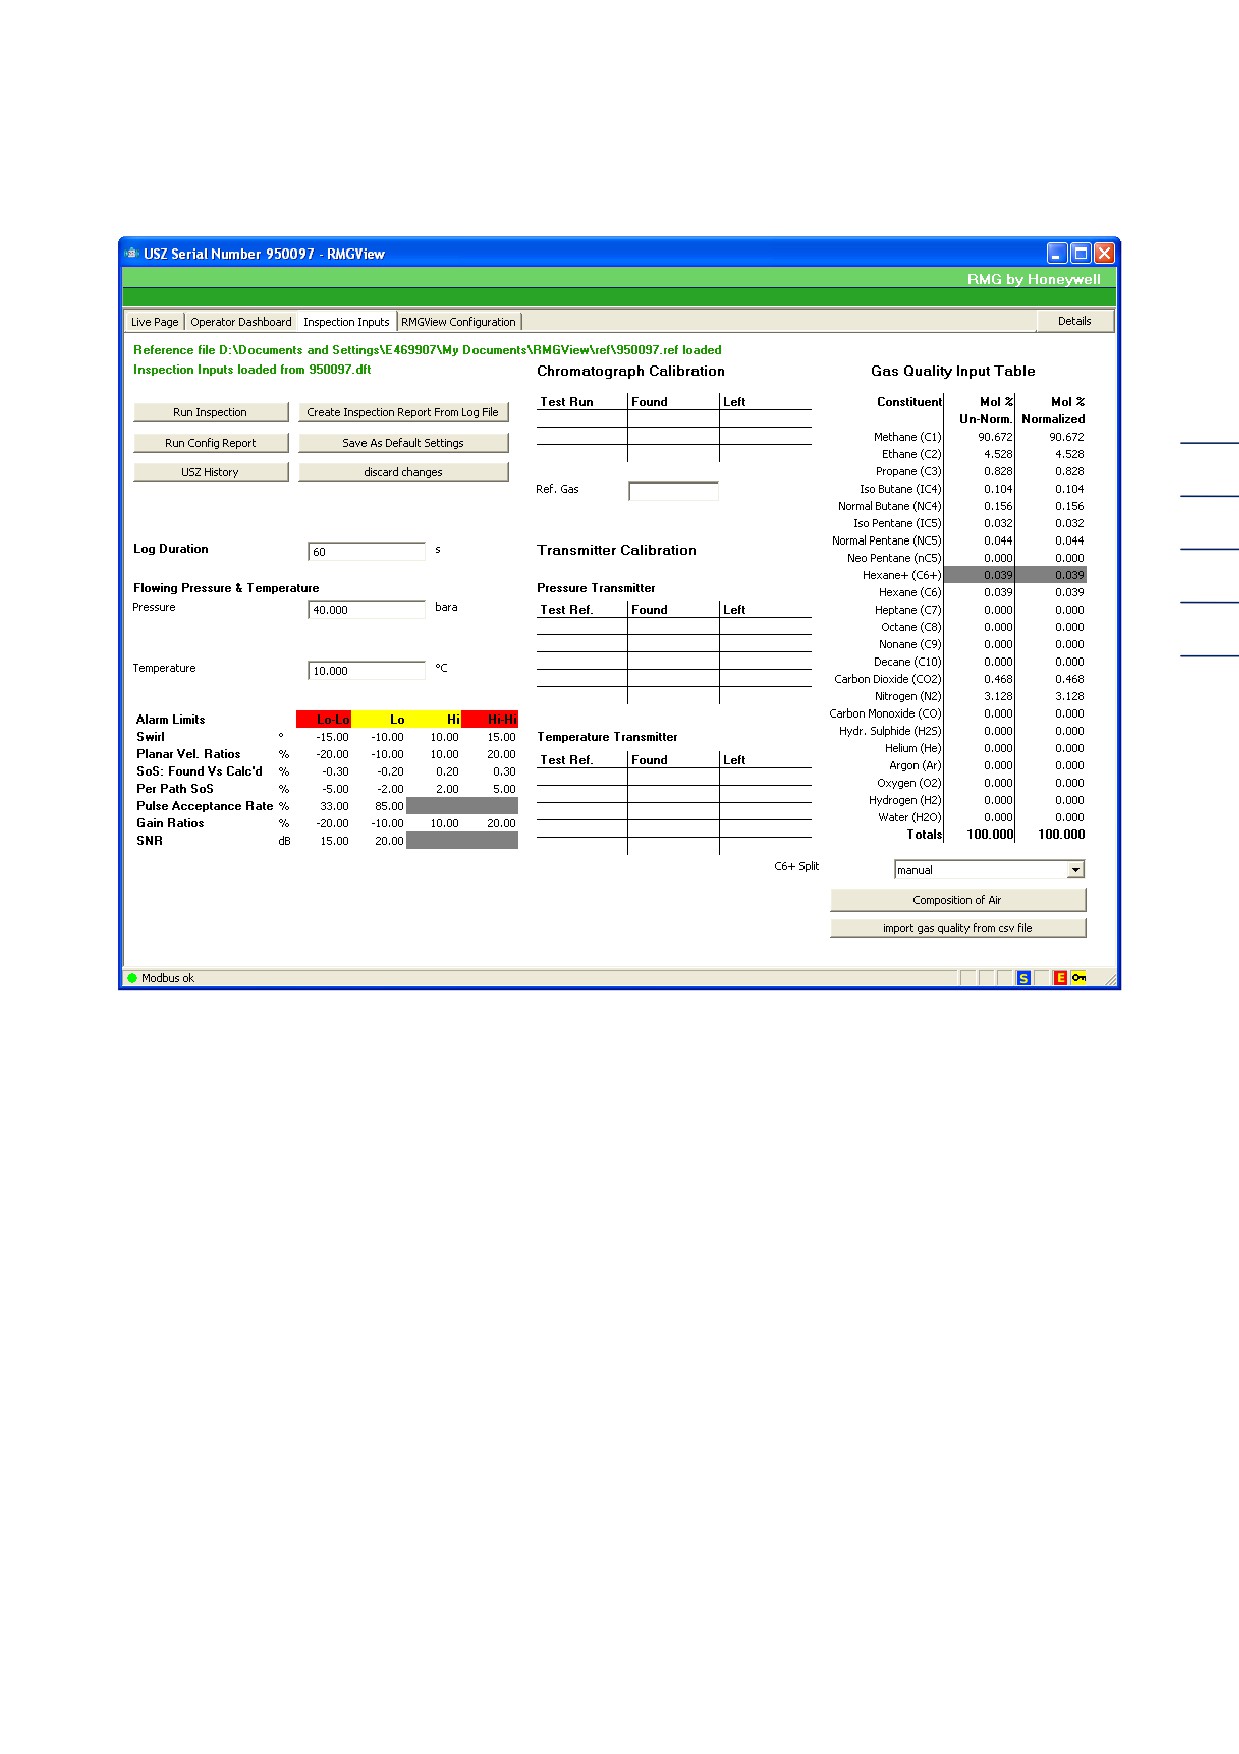
Figure 47: Visible screen in monitor mode, the limit values highlighted in gray cannot be changed
5 TEST VALUES
43
Figure 48: Visible screen in configurator mode, the limit values can be changed
You can input values in this window in order to conduct an automatic meter inspection and create
the results report and the log file.
In the monitor mode (without inputting a password) it is only possible to change the limit values
under the yellow "Lo - Hi." In order also to be able to change limit values highlighted in gray in
monitor mode, you must at least be in configurator mode.
You can input values for device calibration in the central section of the window under
"Chromatograph calibration," "Transmitter calibration," and "Temperature transmitter." under test
no. e.g. the serial numbers of the test gas flask etc.
These values appear in the lower section on the USM test protocol.
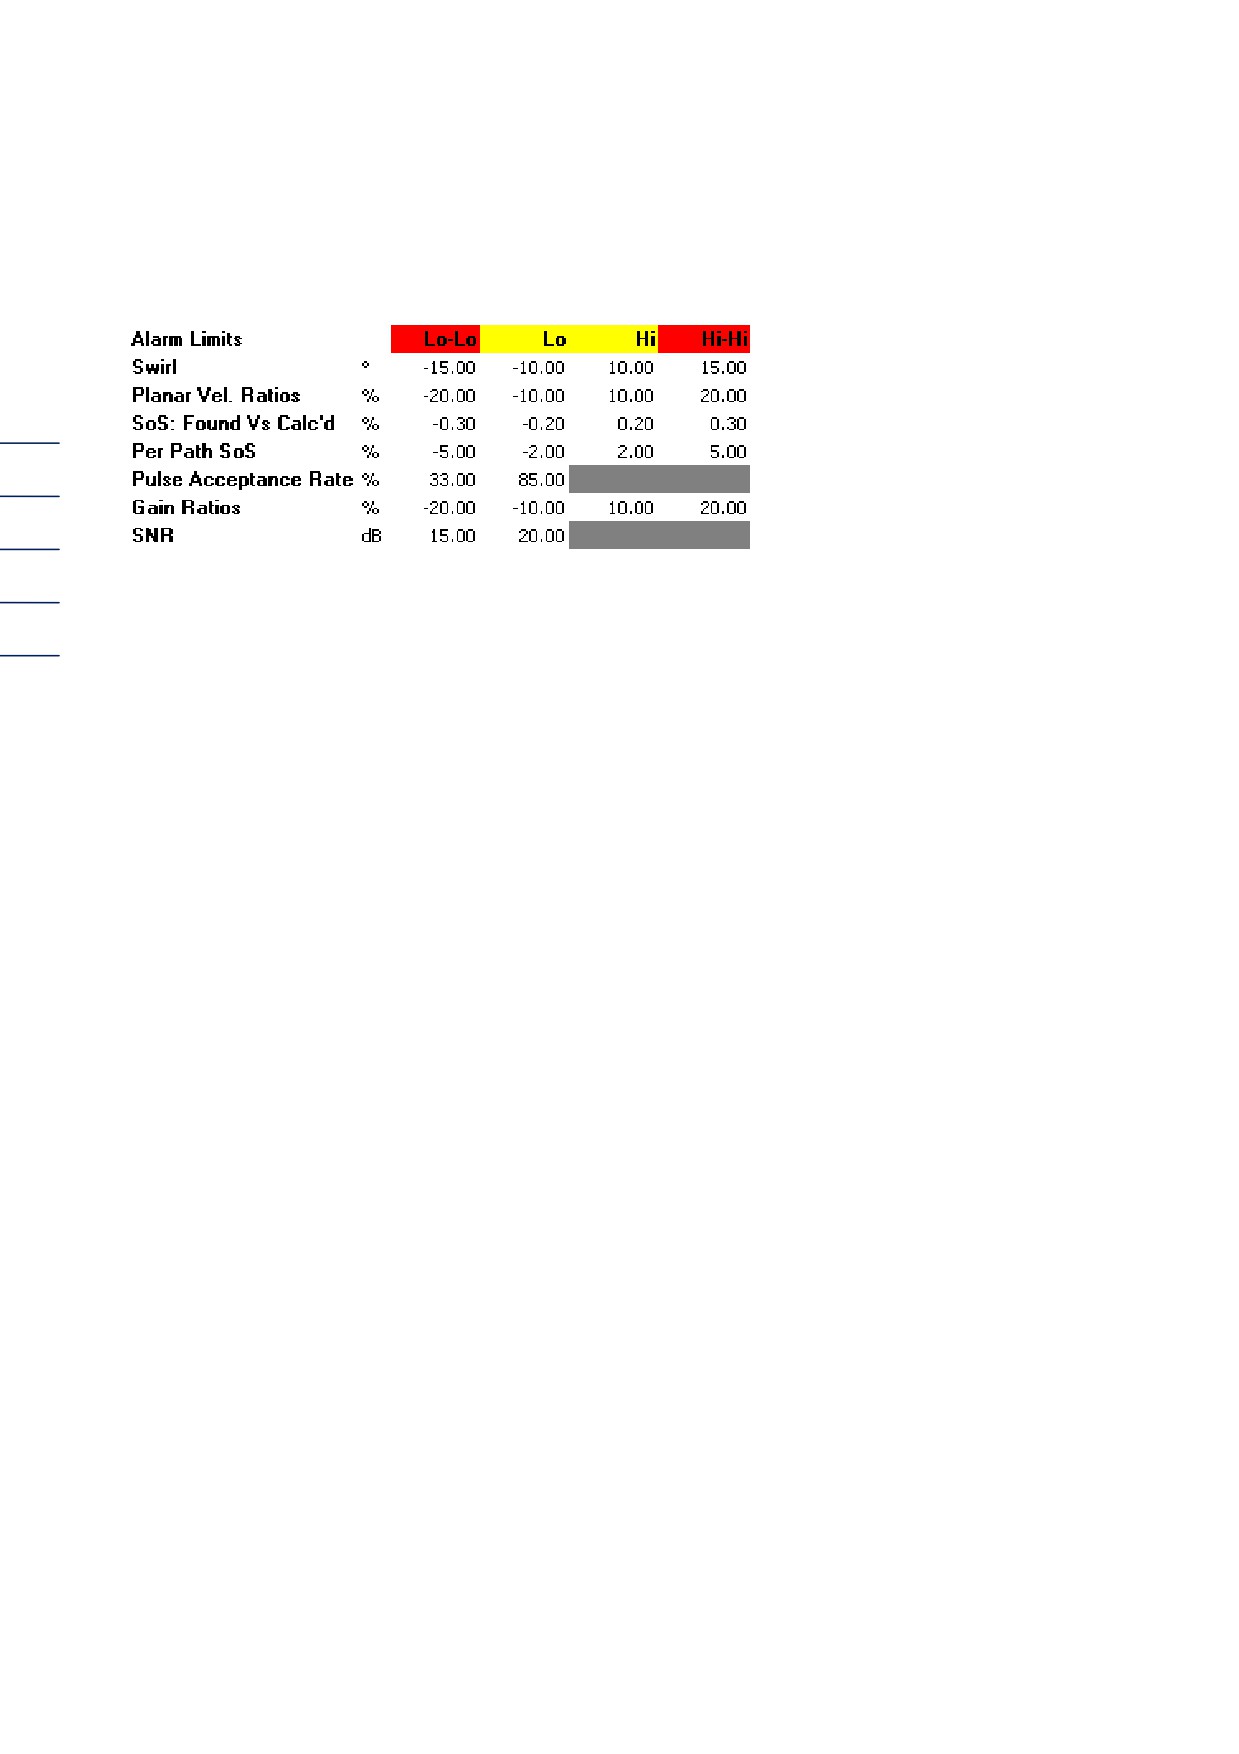
5 TEST VALUES
The following limit values are determined at the factory:
44
Figure 49: Limit values
5.1 "Run Inspection" button
You can also generate a test protocol as a pdf file here.
You determine the log duration and other changeable values.
Then click on "Run Inspection."
A "Log is running…" window opens. You can read off the time remaining for your test here.
The "Determine file name" window opens after the log has ended. Here you can select the folder
for test protocol and log file and then click on ok.
A USM test protocol is generated which you can save or print out.
5 TEST VALUES
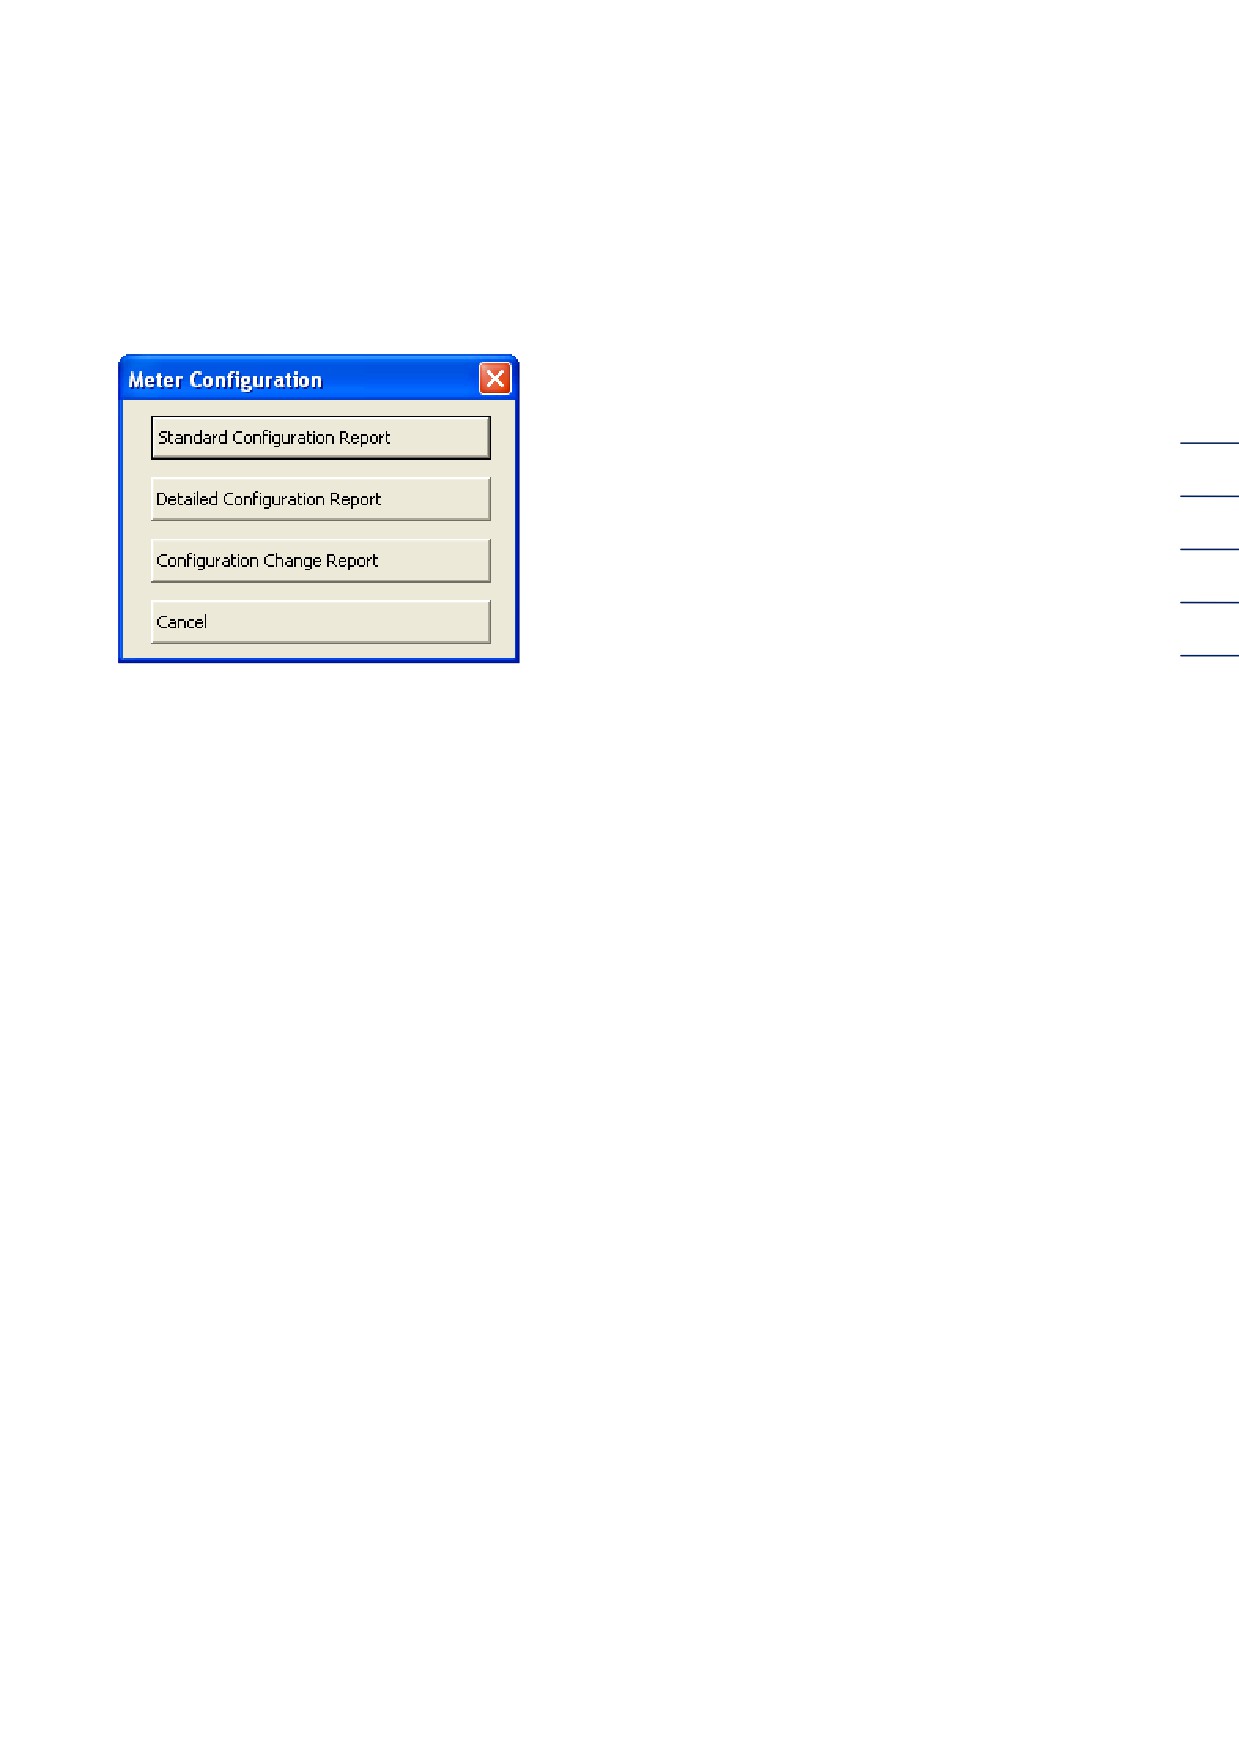
5.2 "Configuration protocol" button
The USM configuration window opens when you click on this button.
45
Figure 50: USM configuration
If you click on one of these protocols, the "Protocol folder" opens where you can store this protocol.
5 TEST VALUES
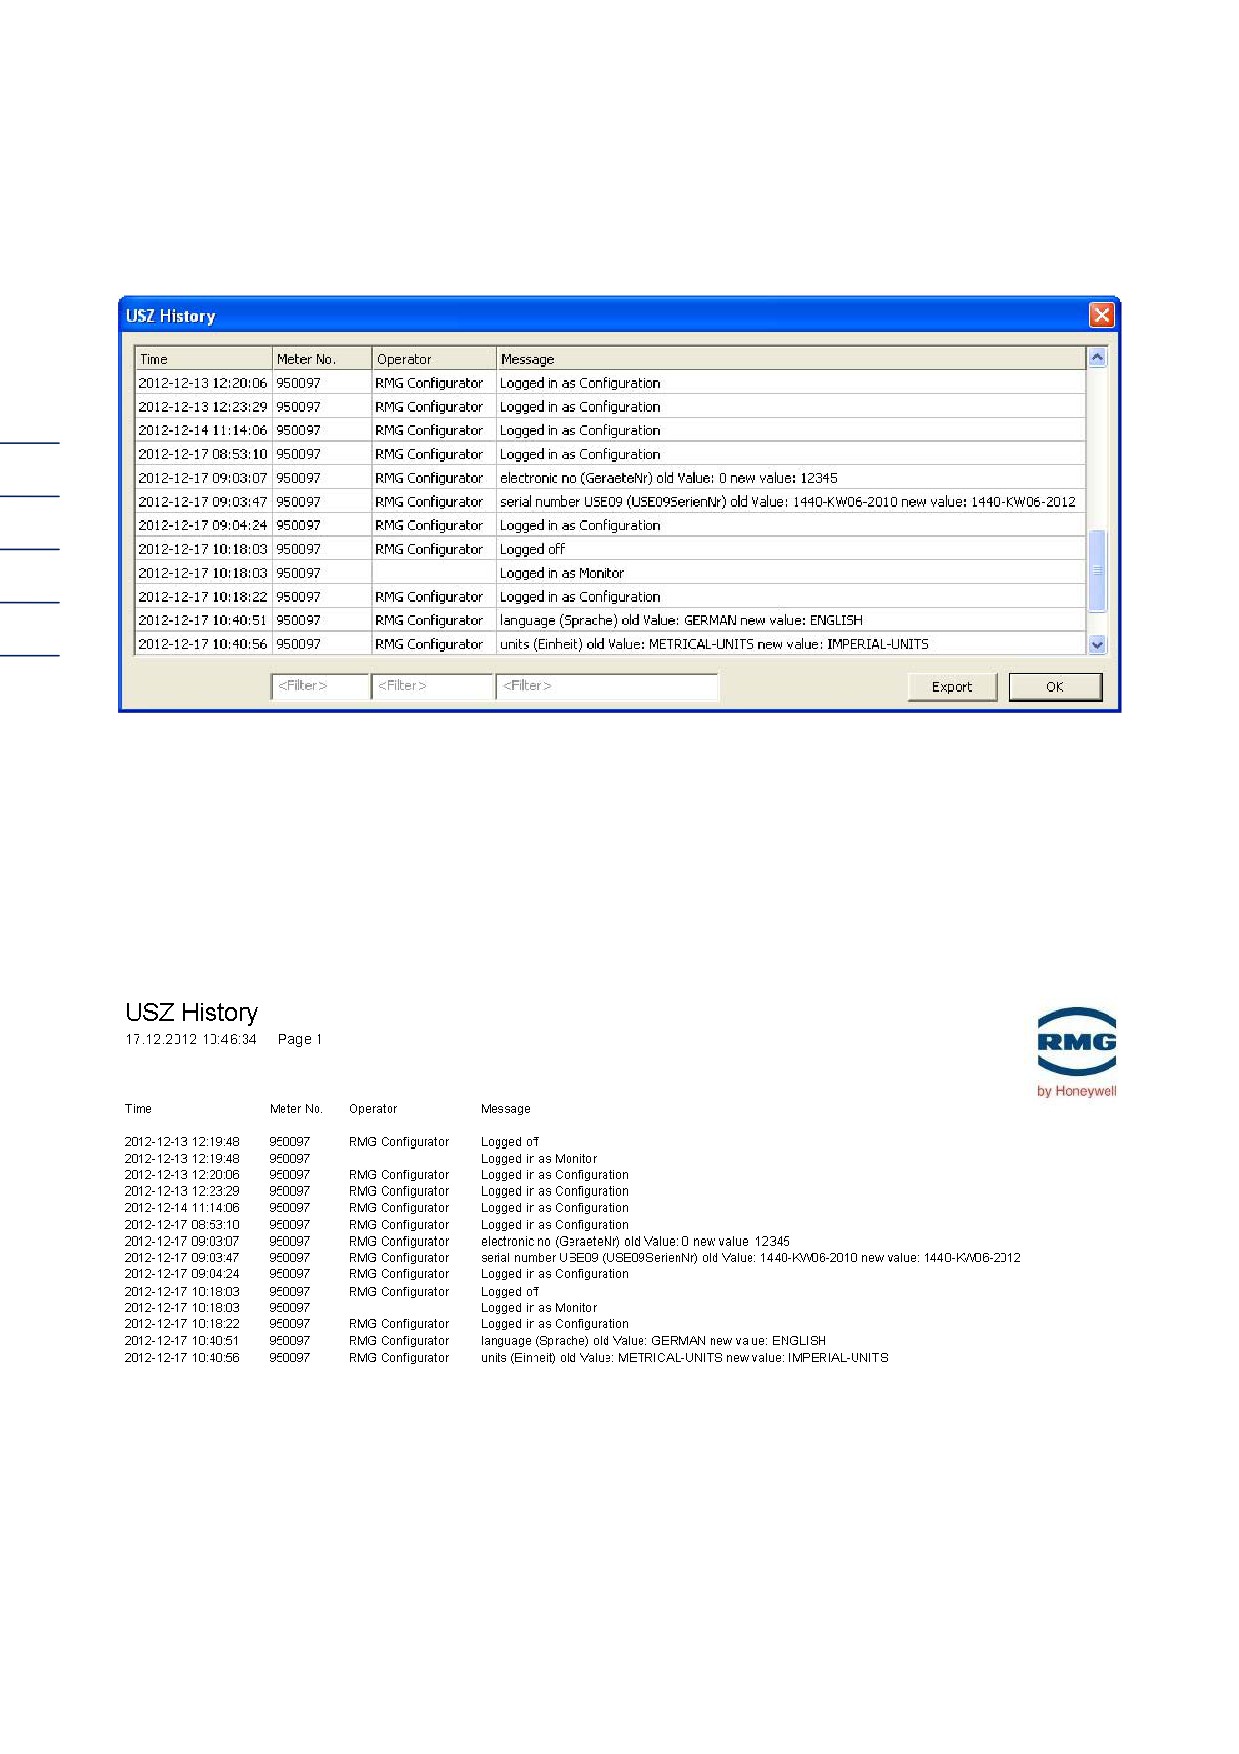
5.3 "USM history" button
46
Figure 51: USM history
This displays a list of who logged in, when and in which mode.
When you click on "Export" you are again requested to save the protocol as a pdf file. You can also
print it out and send it by email.
Figure 52: PDF history
5 TEST VALUES
5.4 "Generate test protocol from log file" button
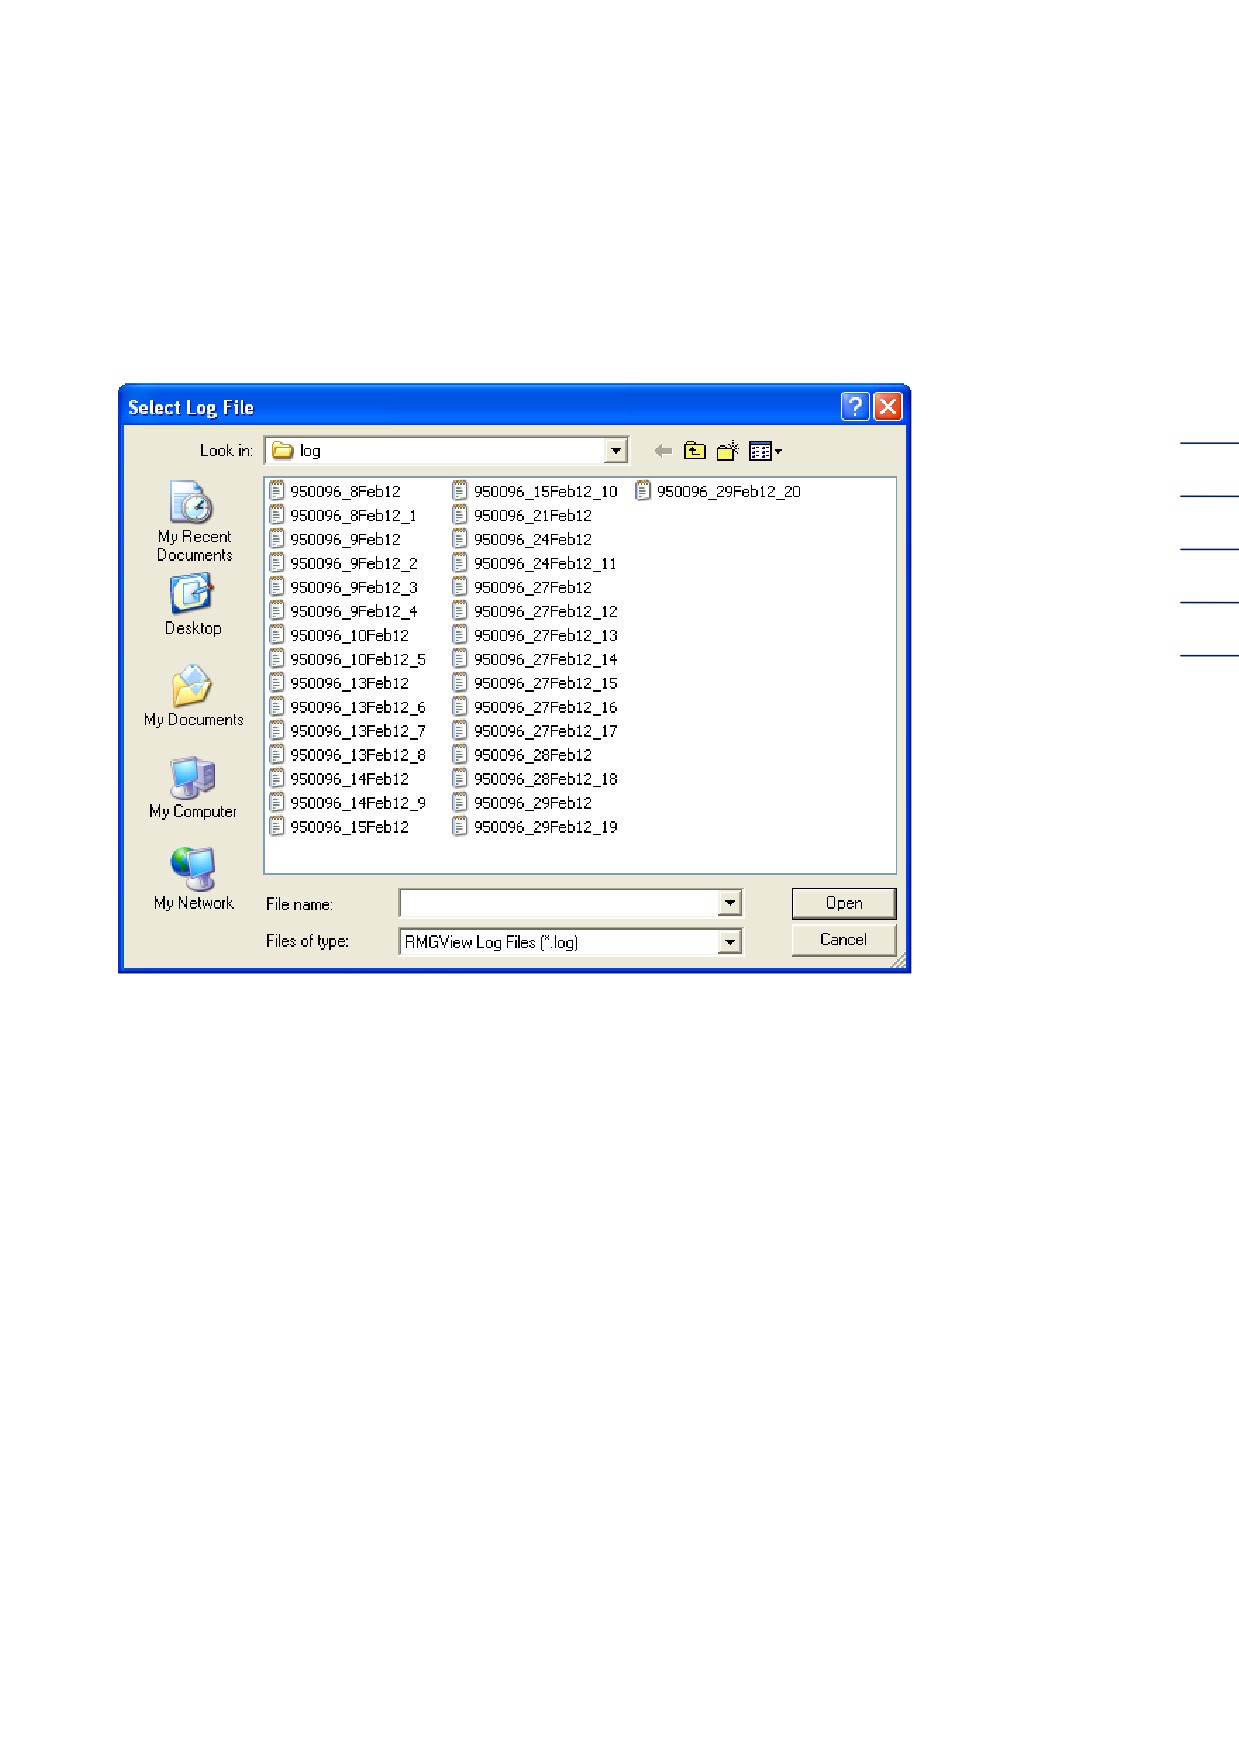
Here you can select an already saved log file of your choice and create a test protocol
retrospectively.
47
Figure 53: Log files
5 TEST VALUES
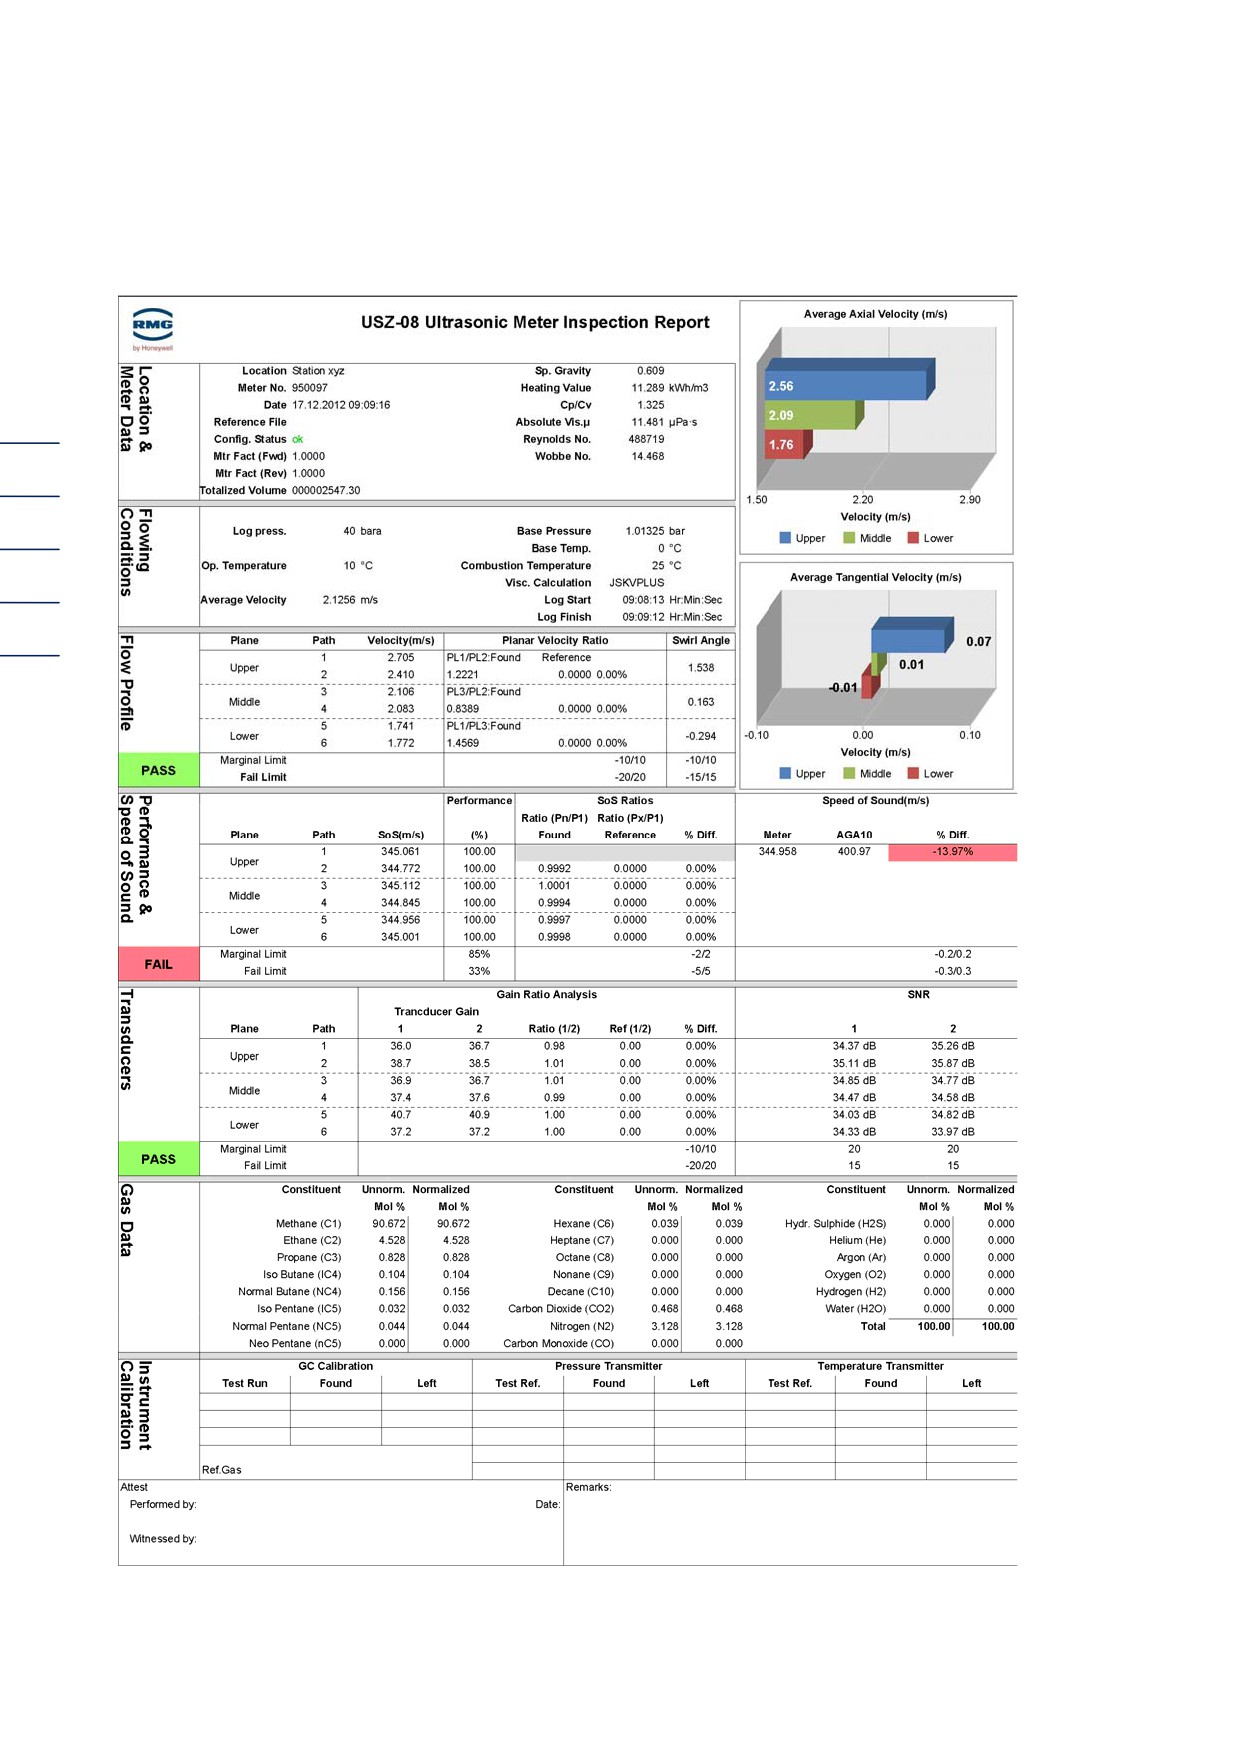
5.5 The USM 08 test protocol
48
Figure 54: USM test protocol
5 TEST VALUES
The test protocol shows all measurement values ascertained, including error notifications and
warnings.
Here are the details:
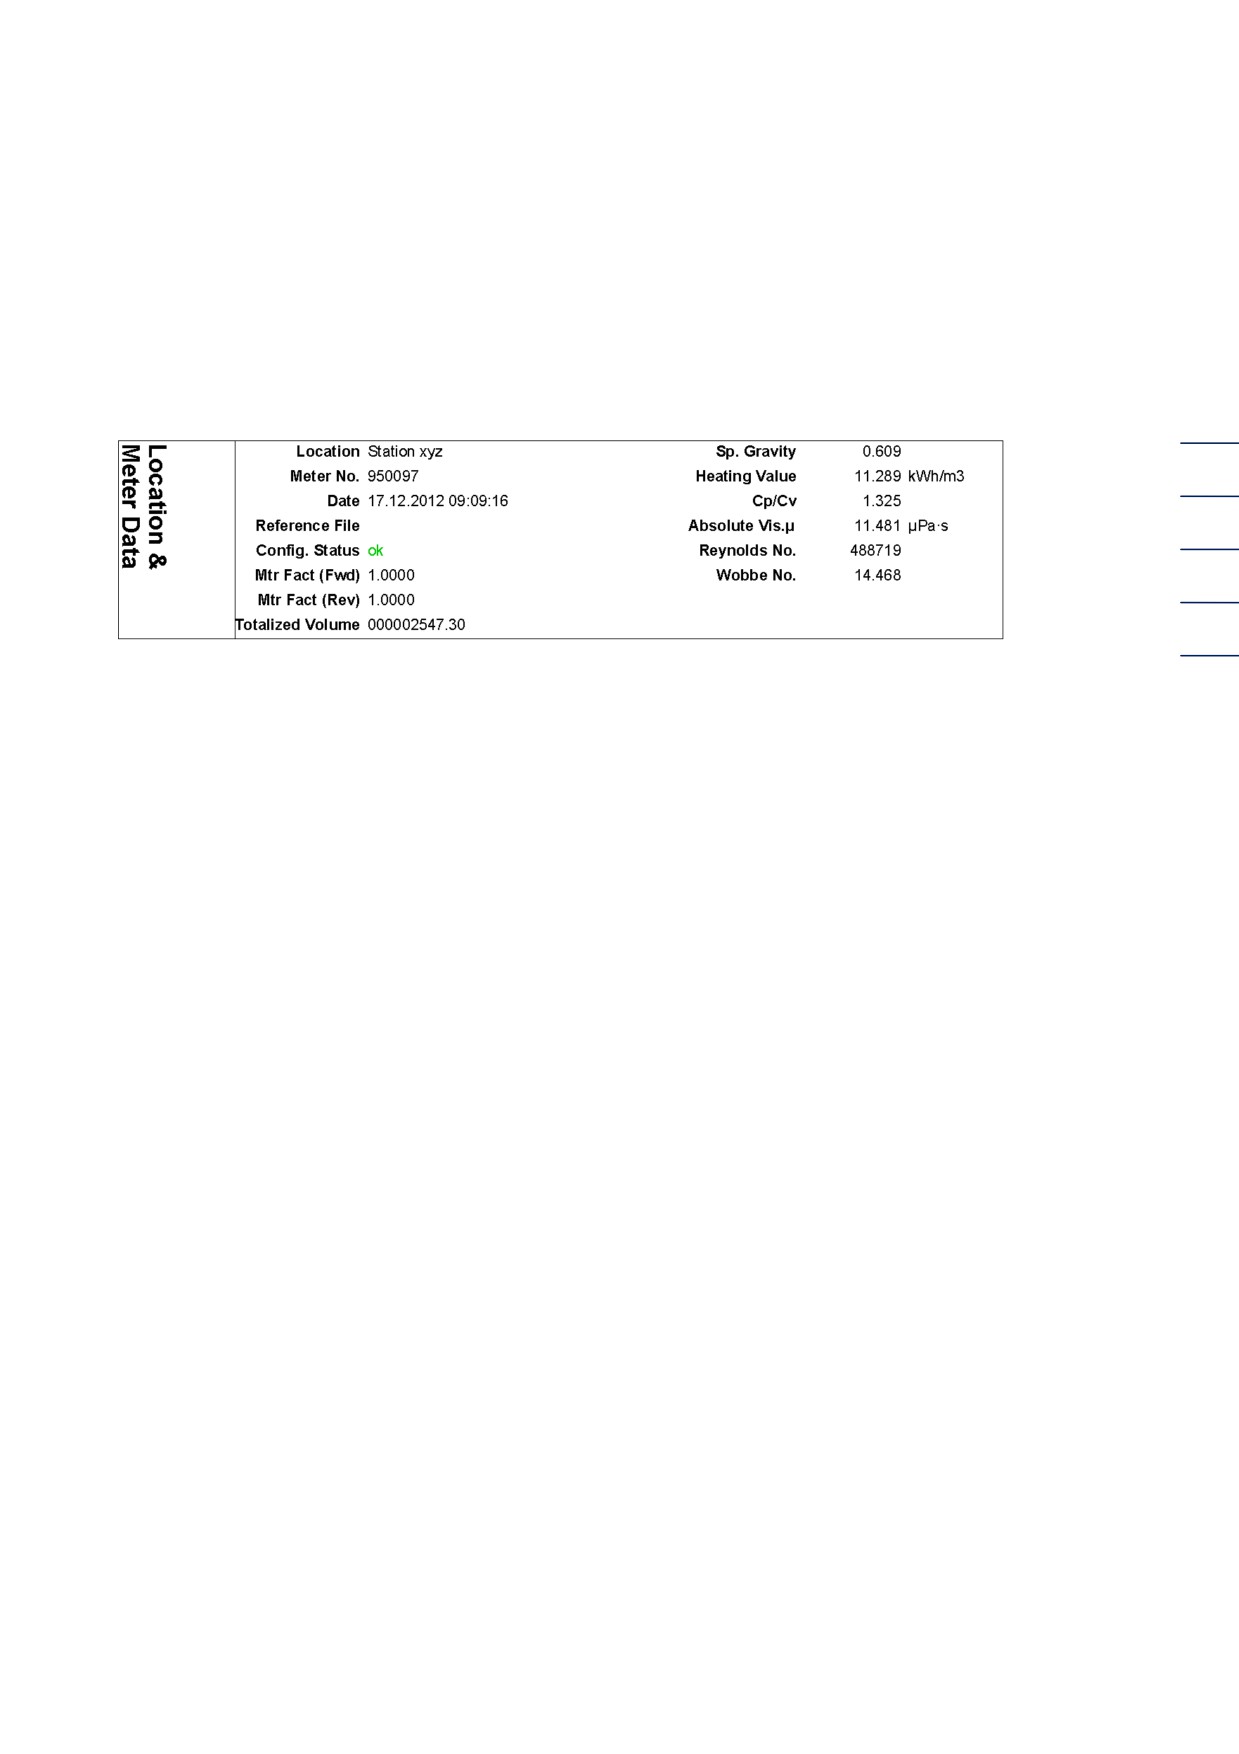
A) Location & measuring element
49
Figure 55: Test protocol, location and measuring element section
The basic information regarding the USM 08 is taken from the USE09 modbus registers here, such
as location, measuring element no., etc. The current date and exact time is also listed. The
configuration status specifies whether the current configuration concurs with the delivery state or
the state after calibration. The comparative data set must be available as a cfg file for this purpose.
Calculations:
o Relative density (density ratio, calorific value, Wobbe):
AGA 8
o Isentropic exponent, speed of sound:
AGA 10
o Viscosity: according to Jaeschke, Schley, Kuechenmeister, Vogel
o Reynolds number from
- Operating density (AGA 10)
- Vwk (average value from log file)
- Viscosity
- Pipe diameter (log file)
5 TEST VALUES
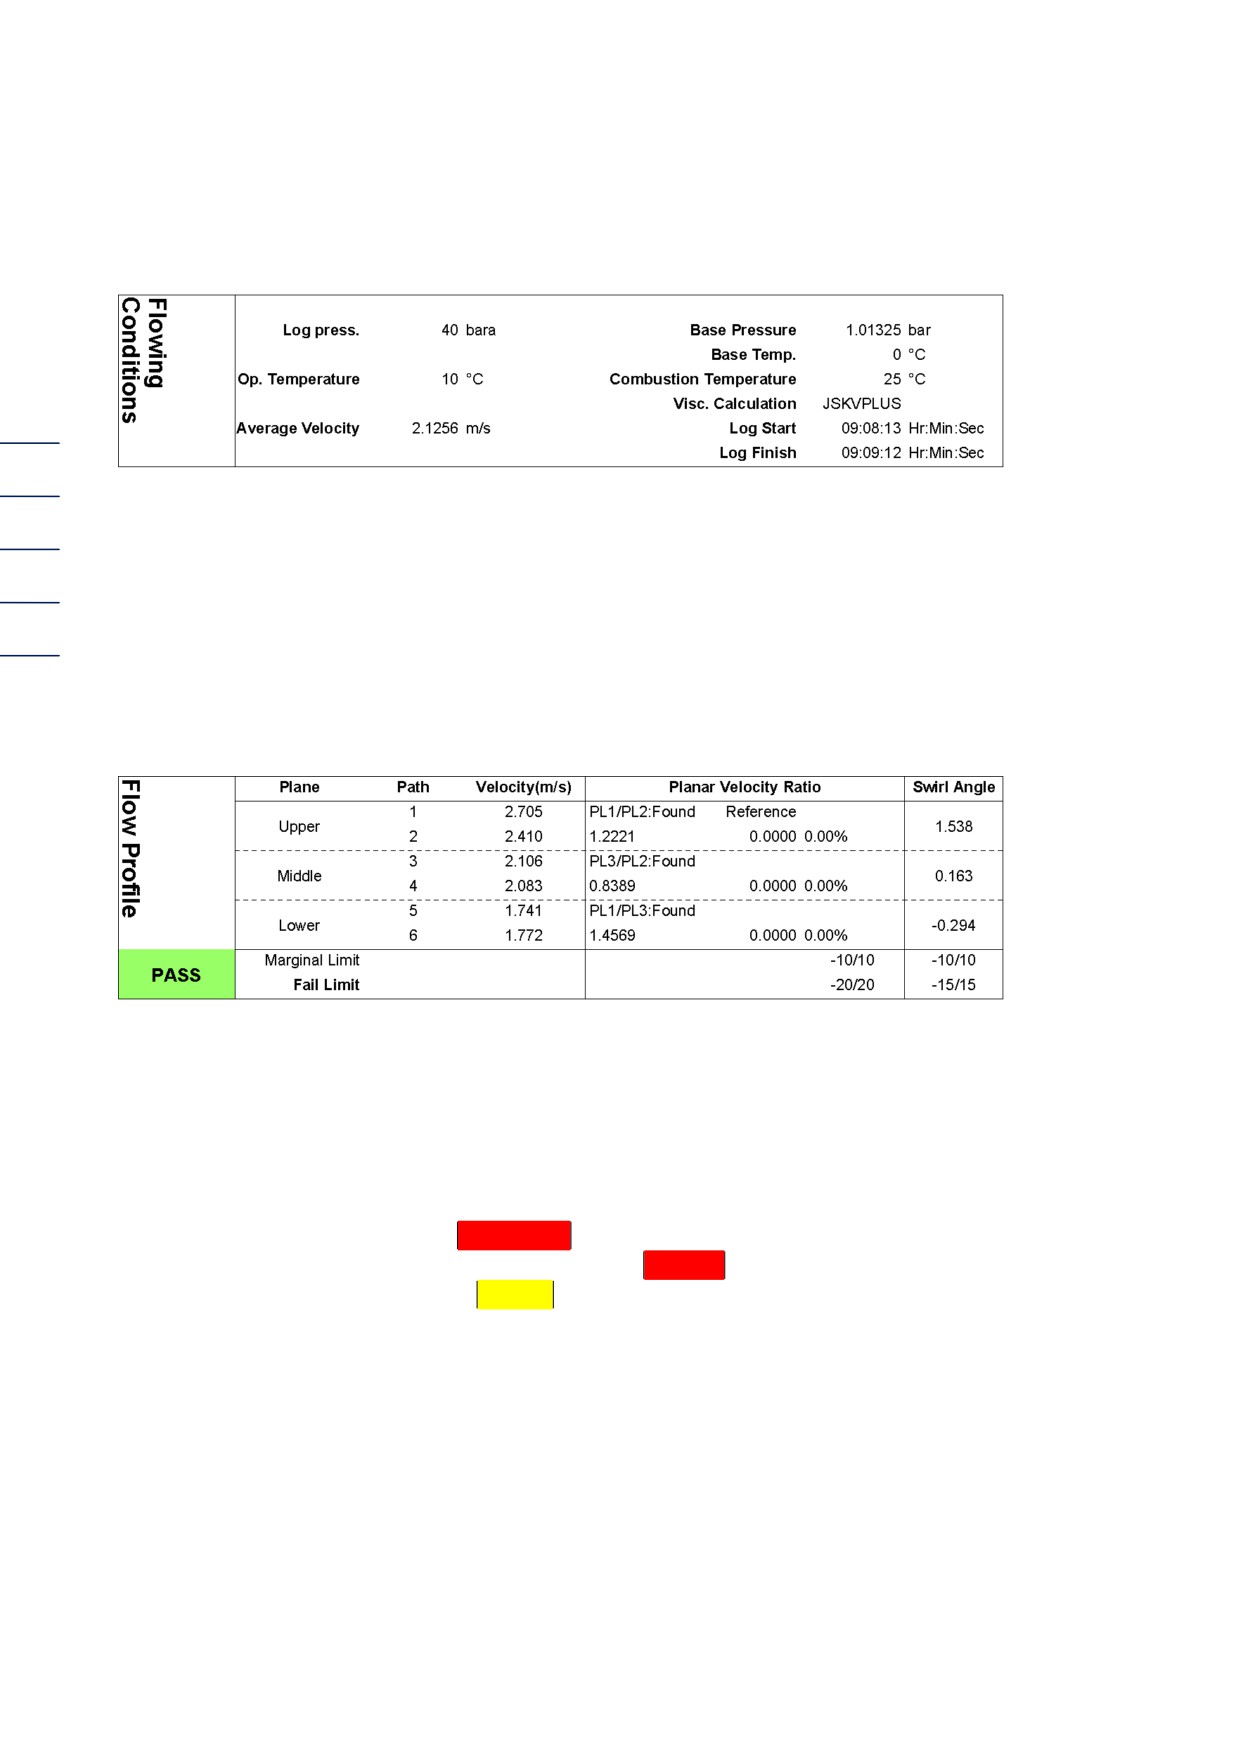
B) Operating conditions
50
Figure 56: Test protocol, operating conditions section
The entered operating conditions from the "Test values" mask are listed here, as are the start and
end point of the log.
C) Profile
Figure 57: Test protocol, profile section
The flow profiles of the three levels are depicted in a table here.
In the left section are the measurement values of the gas speed of the levels above, in the center
and below with the 2 respective paths (= 6 paths). The measurement values of the speed ratios of
the levels can be found on the right. This data is compared with the data from the reference file. In
the example, an error notification
error occurs, as the measured value "4.4015" diverges
considerably from the reference value "1.5059", i.e.
192.30%. If the value does not diverge
considerably, a yellow field labeled
Warning appears at the left edge (not available in this sample
protocol).
The measurement values of the swirl angle are depicted on the very right.
5 TEST VALUES
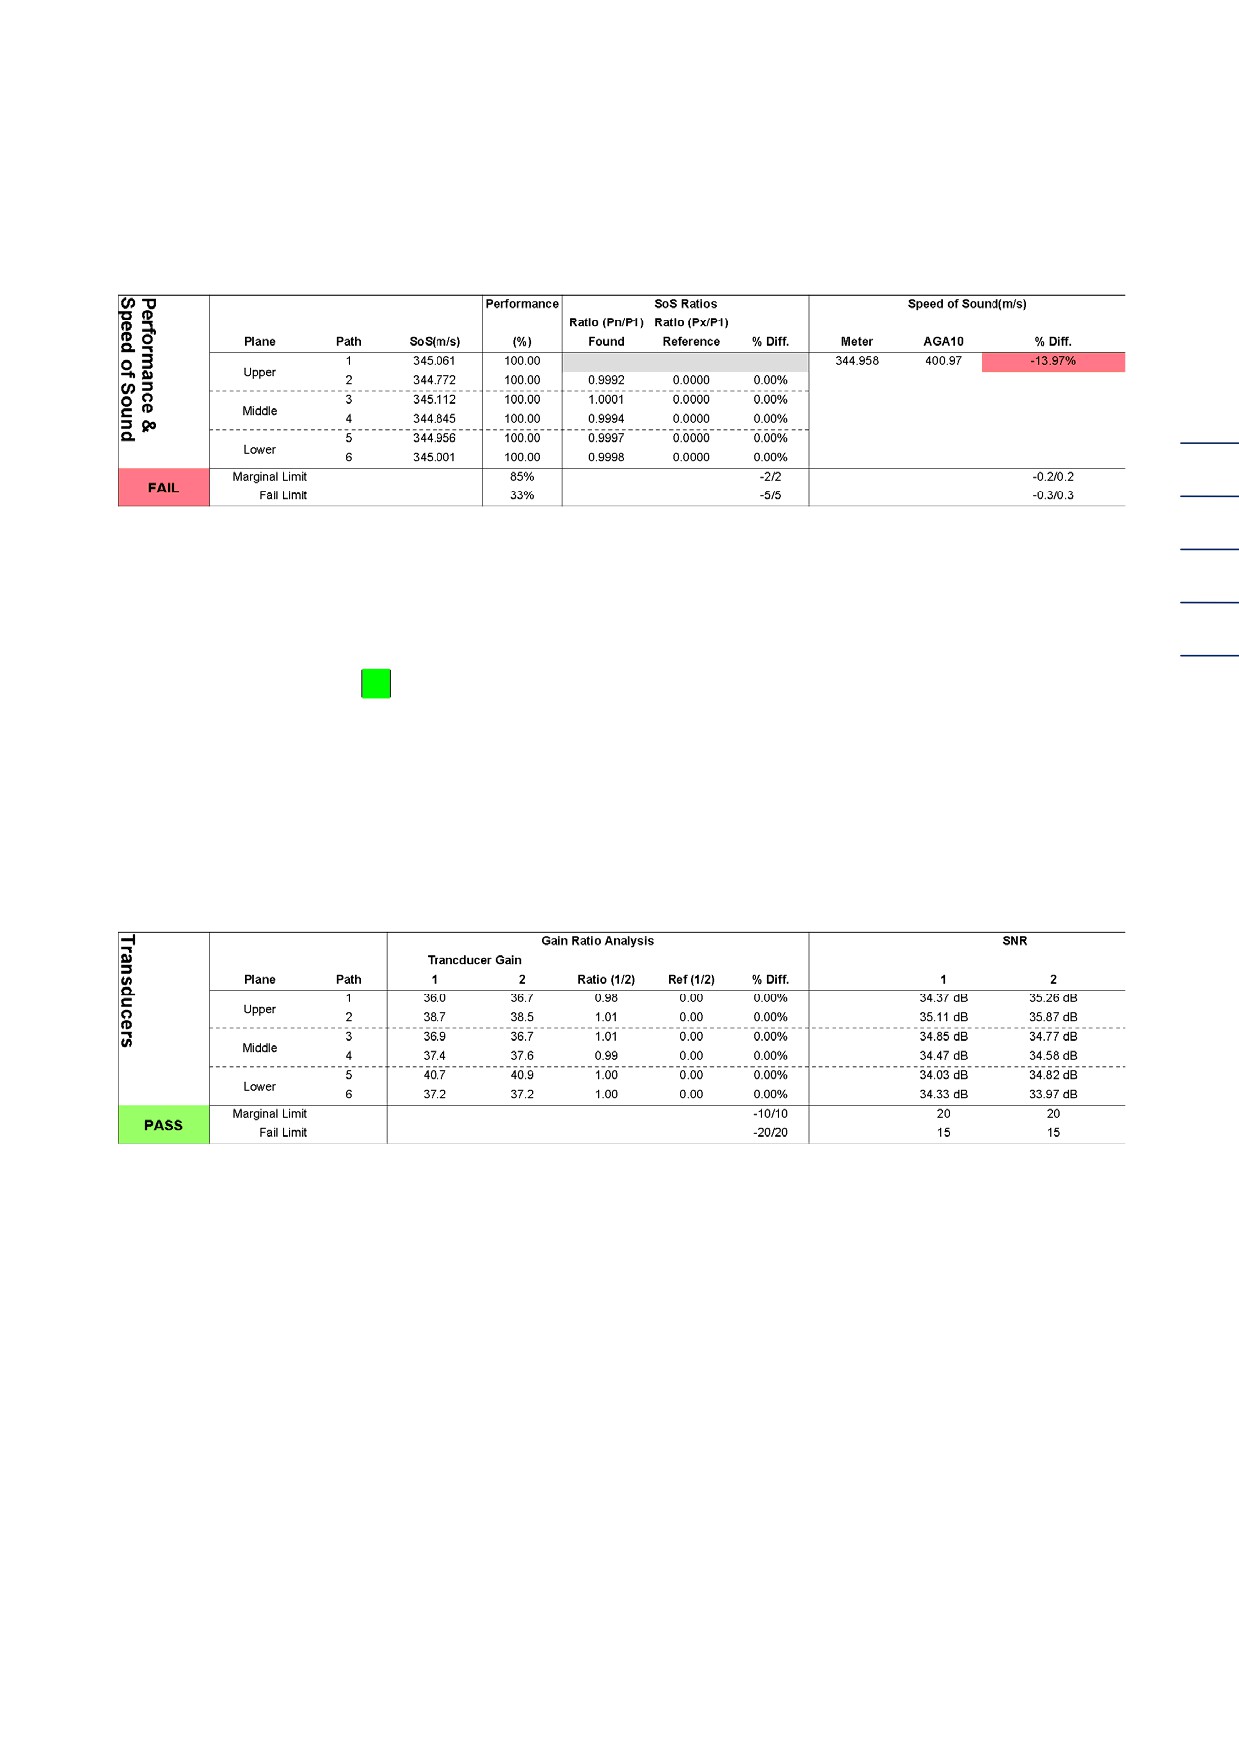
D) Efficiency and speed of sound
51
Figure 58: Test protocol, efficiency and speed of sound section
Here you can see the speed of sound ascertained and the number of valid measurements. The
speed of sound ratio is again compared with the data from the reference file and the percentage
deviation depicted. The
OK field means that the values are all "in the green range."
The speed of sound measured by the USM is compared with the theoretical speed of sound
calculated in accordance with AGA 10 from the gas composition and the operating conditions
(pressure, temperature).
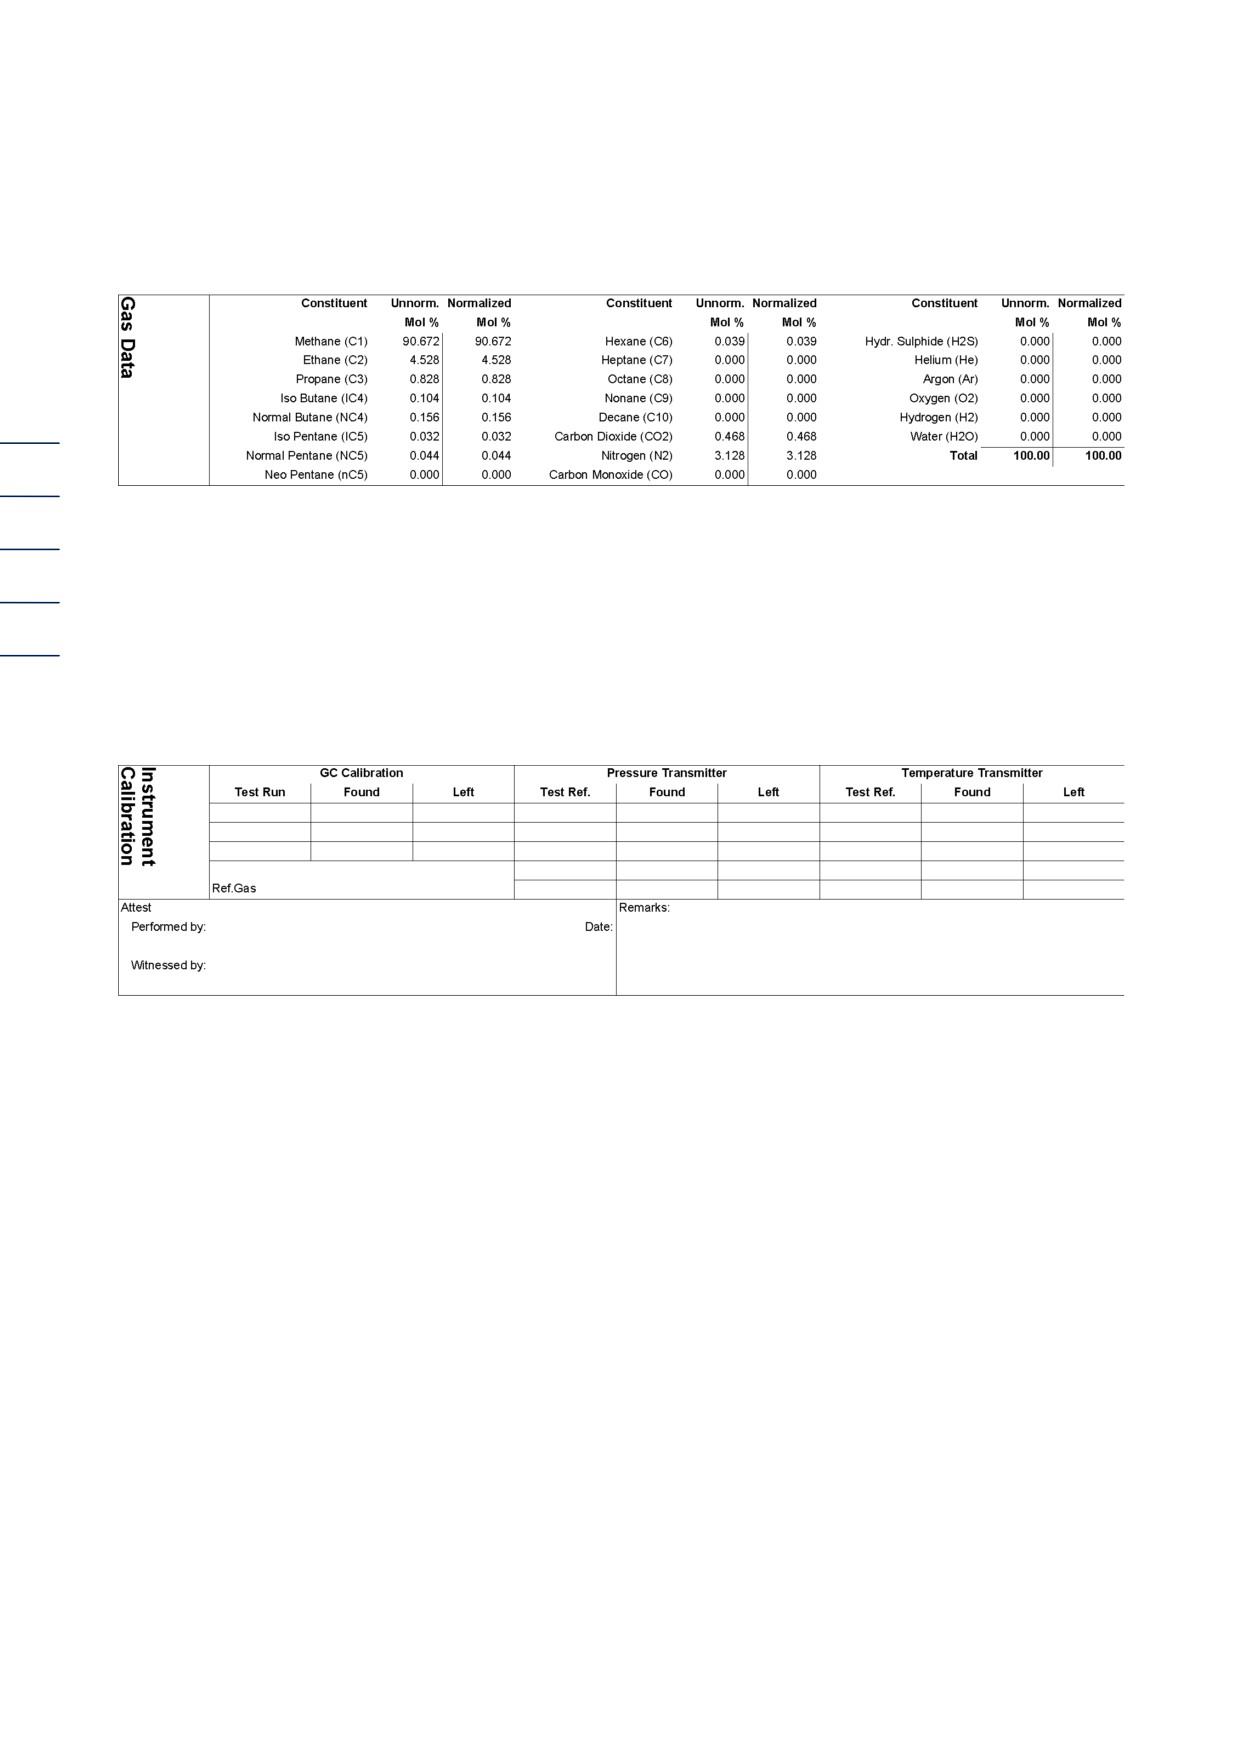
E) Transmitter
Figure 59: Test protocol, transmitter section
The AGC ratios of the individual paths are depicted here compared to the reference file with the
percentage divergence. The signal-noise ratio is depicted on the very right.
5 TEST VALUES
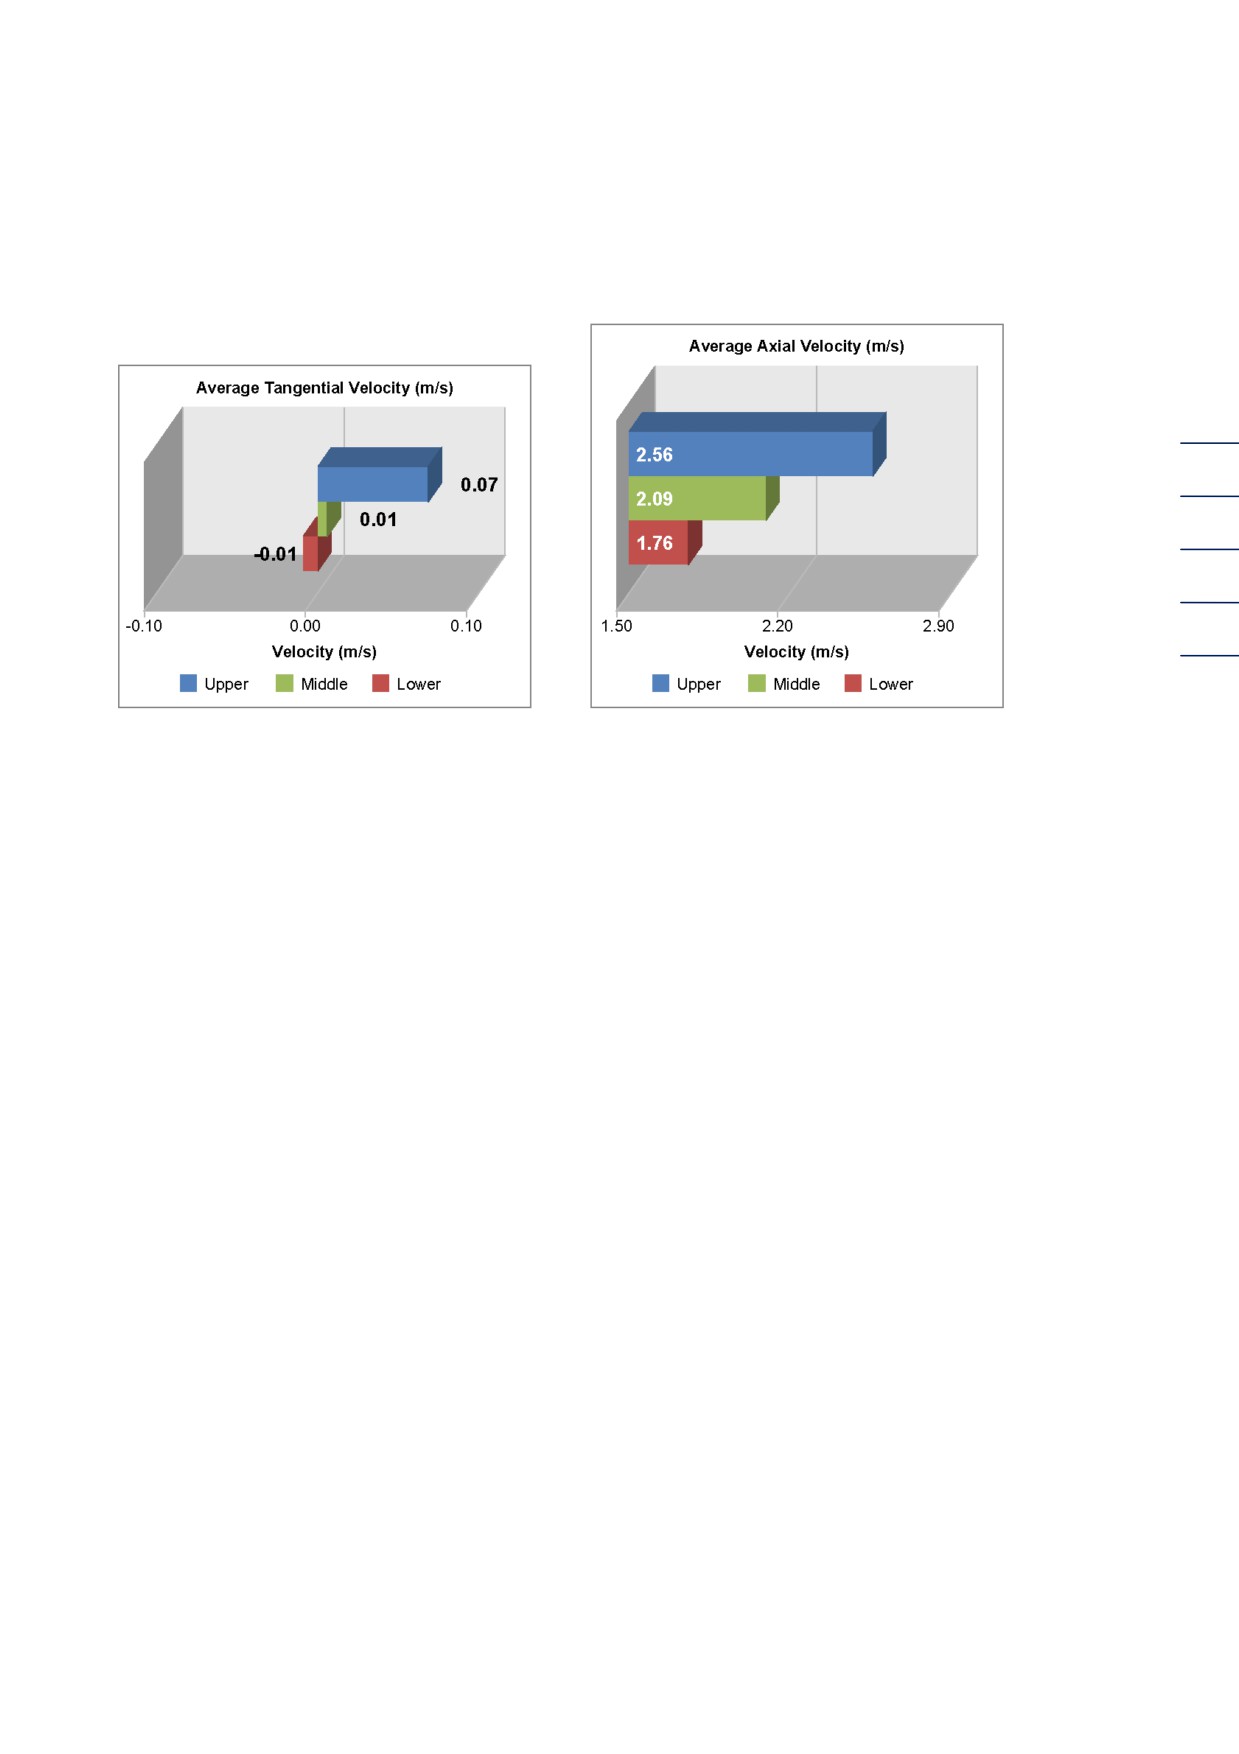
F) Gas composition
52
Figure 60: Test protocol, gas composition section
The gas quality selected in the "Test values" mask which was inputted manually is depicted here.
G) Equipment calibration
Figure 61: Test protocol, equipment calibration section
In this table you can find the values which you inputted in the "Test values" mask under
"Chromatograph calibration."
5 TEST VALUES
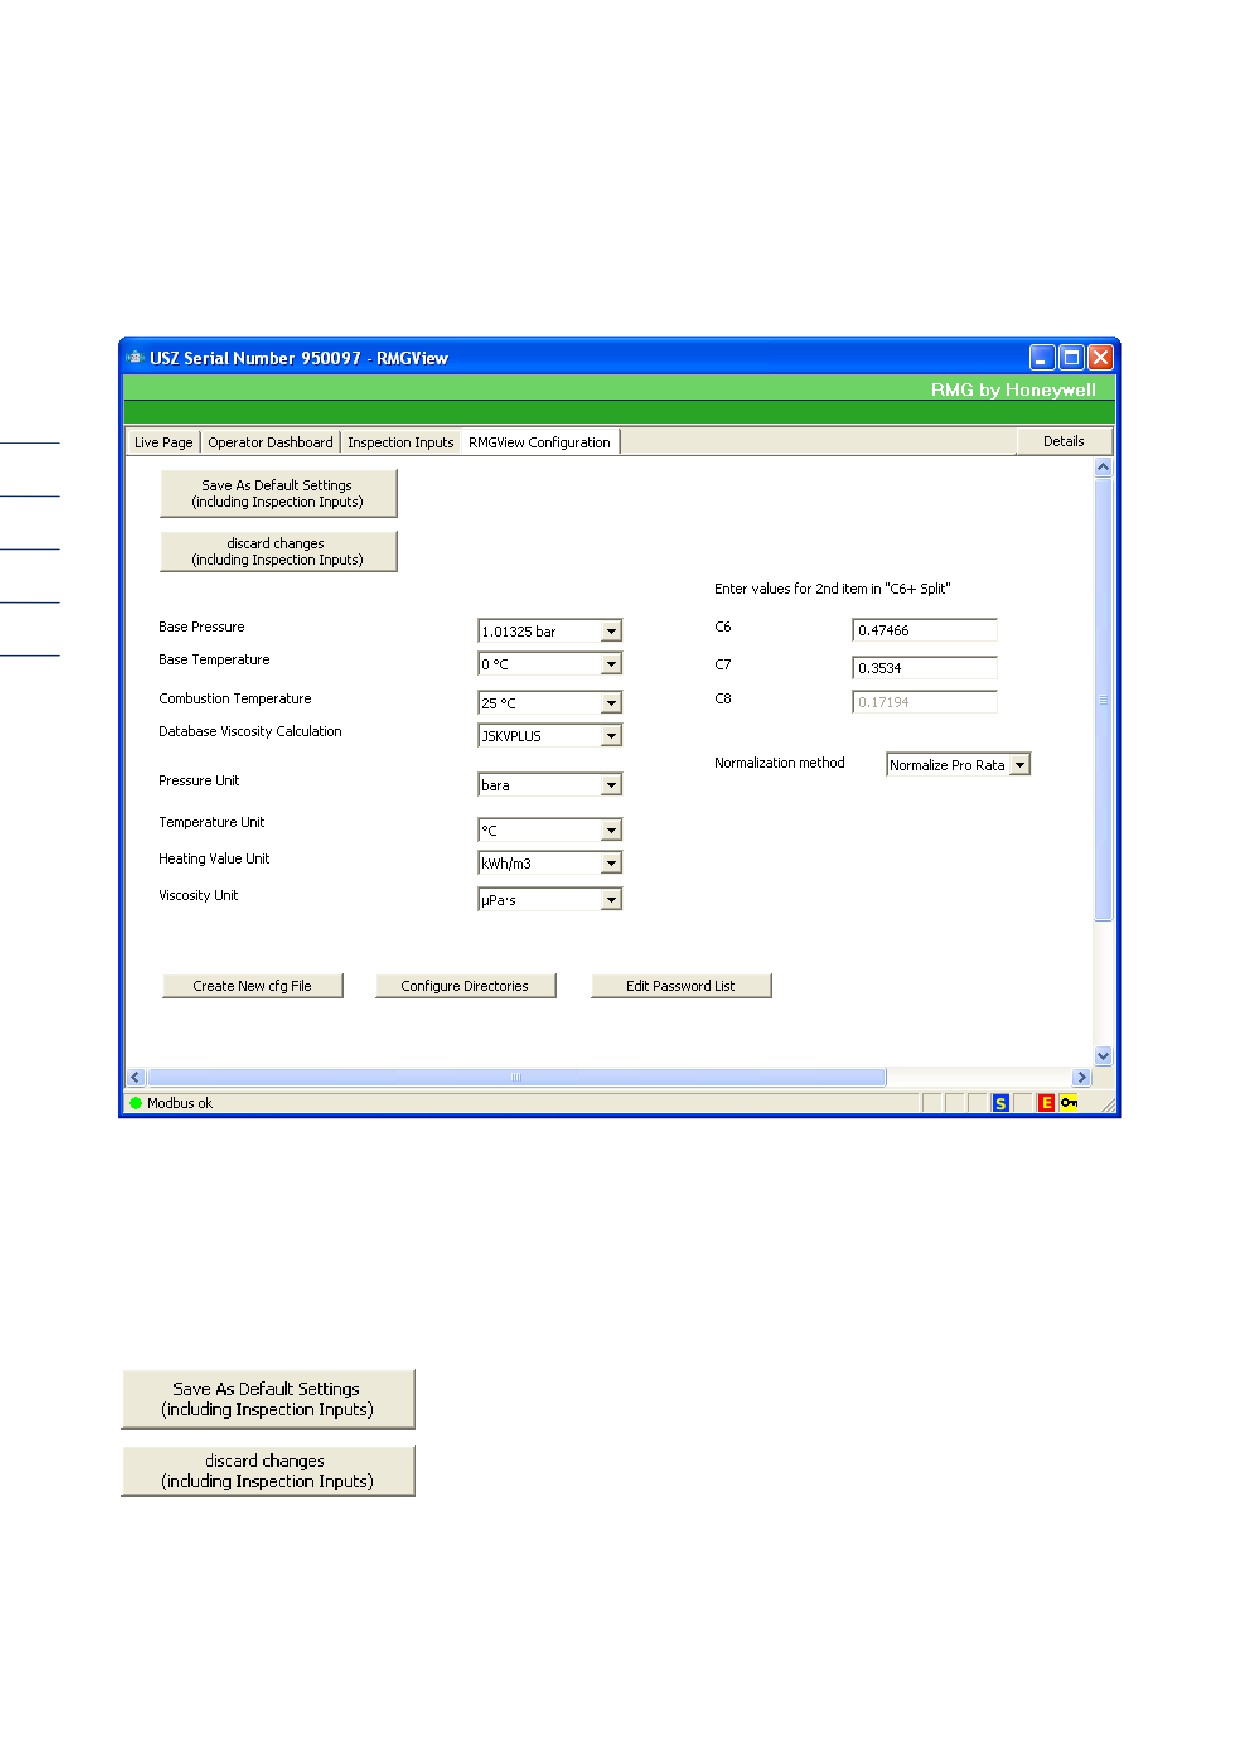
H) Flow profiles
53
Figure 62: Test protocol, profiles section
Figure 63: Test protocol, profiles section
At the top right of the test protocol there are two graphics regarding average axial speed and
average tangential speed. The three levels are depicted respectively in color (blue, green and dark
red).
6 RMGVIEW CONFIGURATION
6 RMGView configuration
54
Figure 64: RMGView configuration mask
You can set the basic parameters in this window. Several values or units are available to choose
from in each instance.
The AGA 8 calculation tables only exist for the selectable standard pressure and standard
temperature values. Standard pressure and standard temperature cannot therefore be selected
progressively.
The two buttons "Save as default values" and "Discard
changes" relate to the saving or amendment of the inputted
values.
Figure 65: Buttons for default values
6 RMGVIEW CONFIGURATION
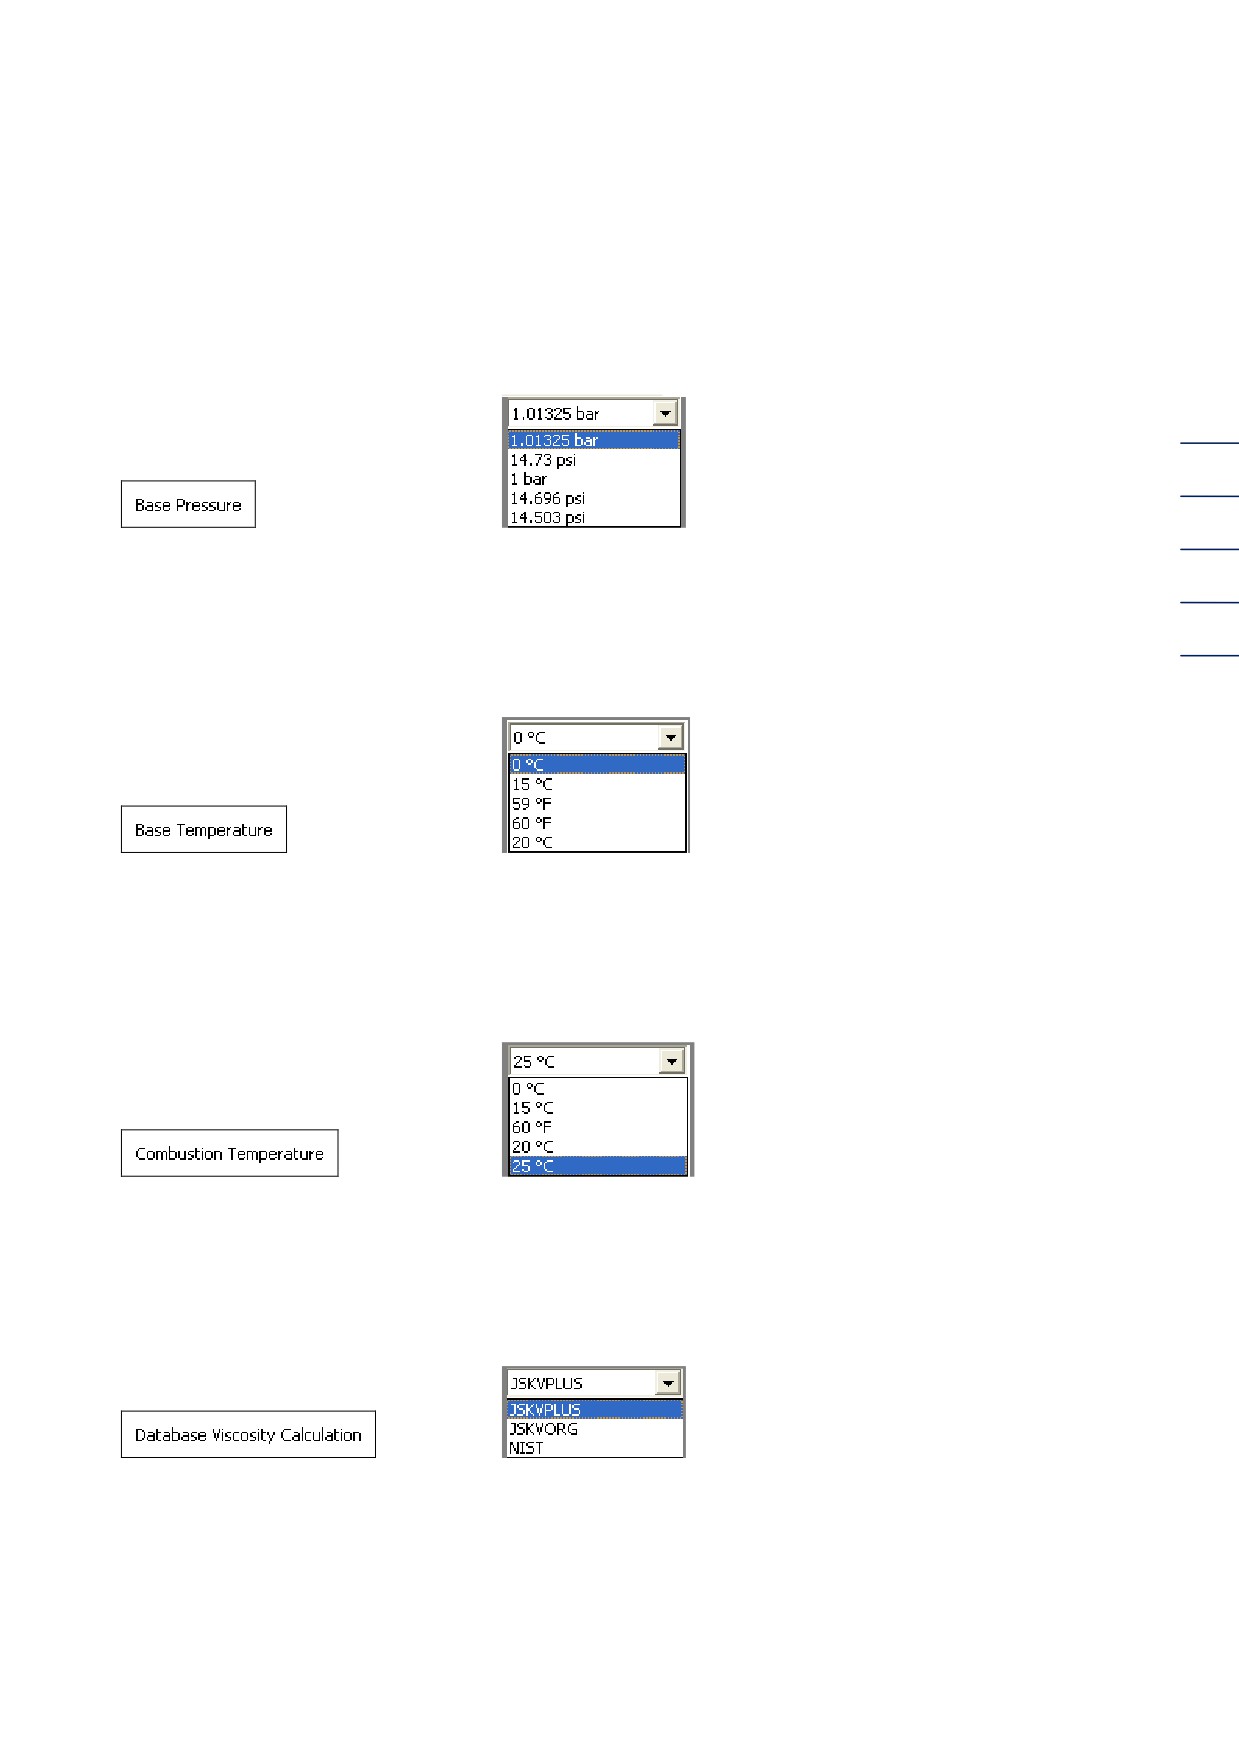
The adjustable parameters:
The name is in the left box and the adjustable parameters in the right box.
A) Standard pressure
55
Figure 66: Standard pressure selection list
B) Standard temperature
Figure 67: Standard temperature selection list
C) Combustion temperature
Figure 68: Combustion temperature selection list
D) Data basis viscosity calculation
Figure 69: Data basis viscosity calculation selection list
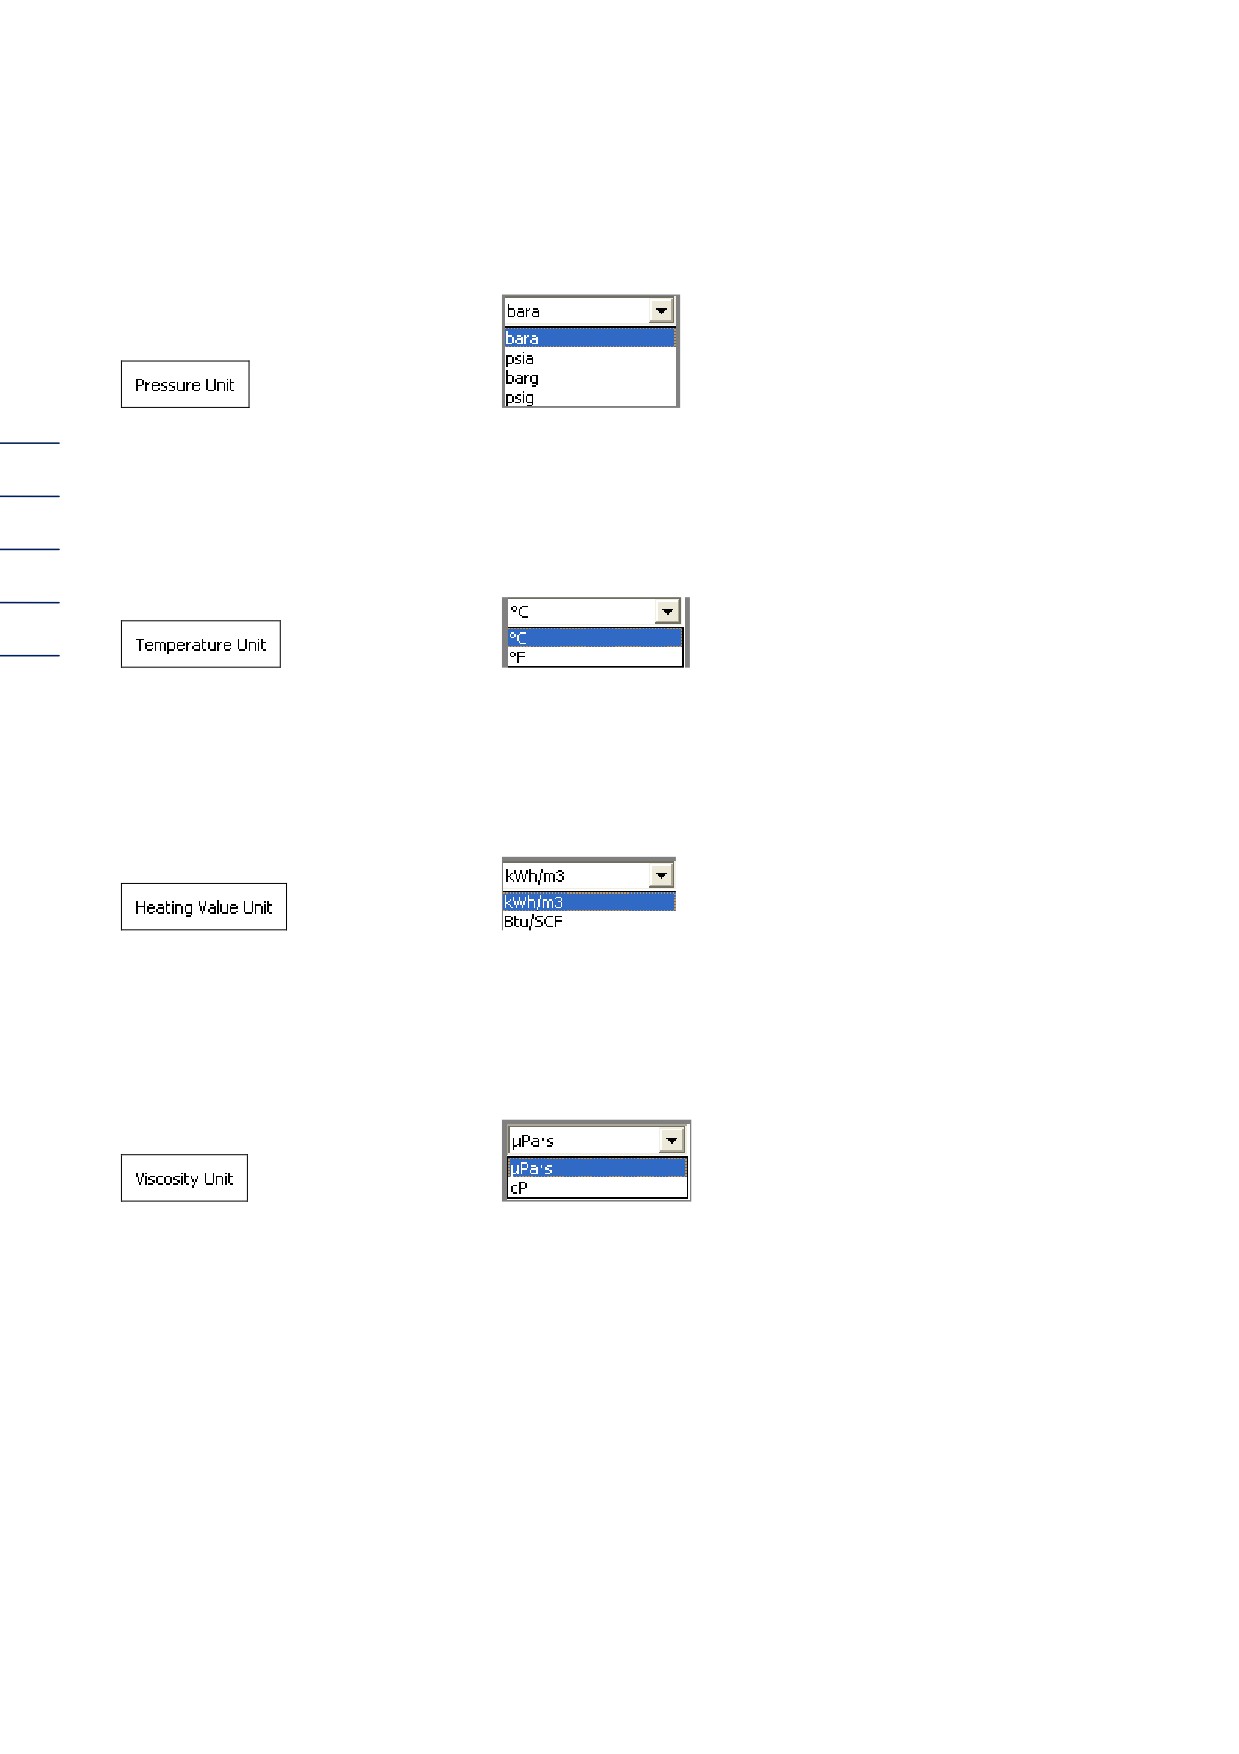
6 RMGVIEW CONFIGURATION
E) Pressure unit
Figure 70: Pressure unit selection list
56
F) Temperature unit
Figure 71: Temperature unit selection list
G) Combustion value unit
Figure 72: Combustion value unit selection list
H) Viscosity unit
Figure 73: Viscosity unit selection list
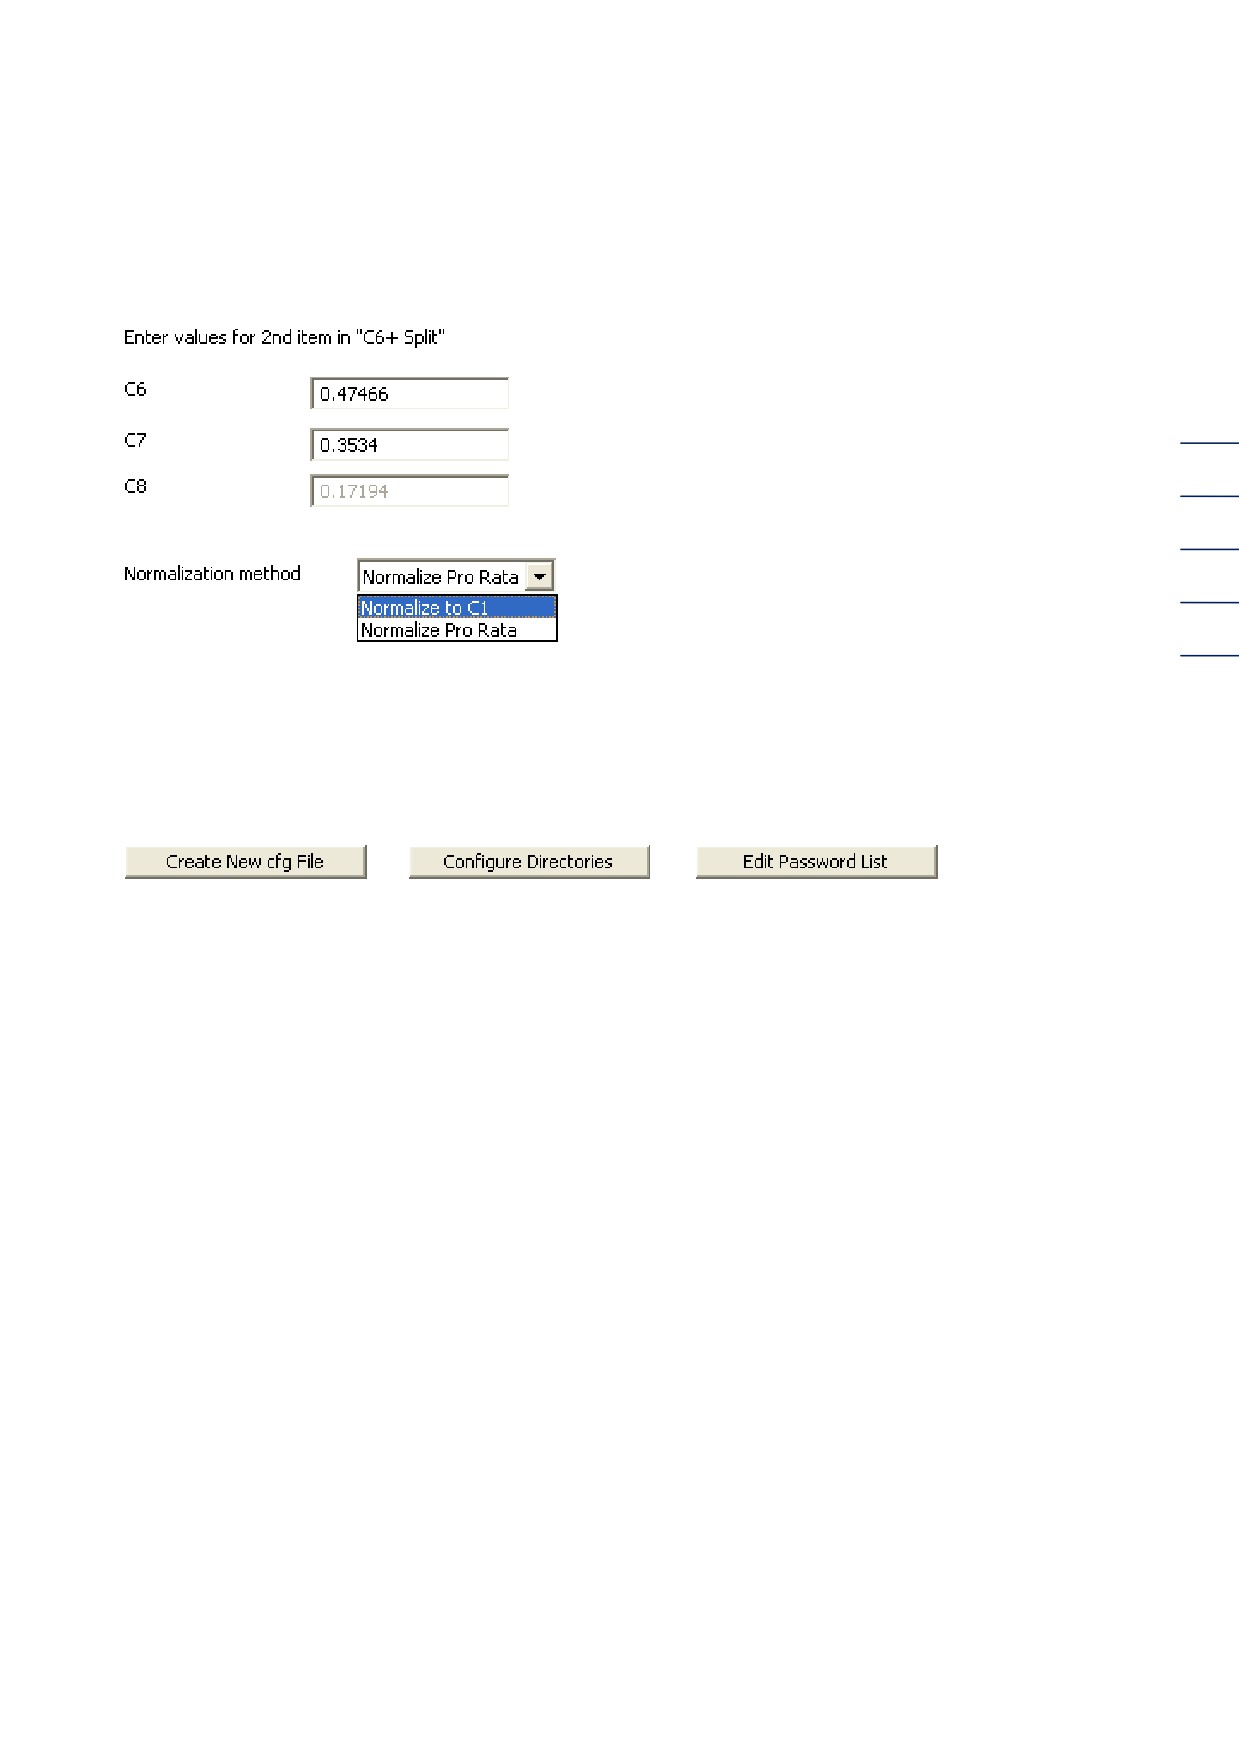
6 RMGVIEW CONFIGURATION
You can find the following configuration options on the right:
57
Figure 74: Other input options
Three other buttons are available:
Figure 75: Other buttons
6.1 "Generate new cfg-file" button
A configuration file of the meter is required for the generation of the USM 08 test protocol with
which current configuration is compared. This should usually reproduce the delivery state or the
data set of calibration or commissioning. A new configuration file can be read out from the meter
electronics with the aid of the "Generate new cfg-file" button and filed in the RMGView "cfg"
subfolder. If data sets need to be provided by external bodies (e.g. high-pressure test benches)
they also need to be stored in the cfg-folder to compare parameters as part of the USM 08 test
protocol generation.
6 RMGVIEW CONFIGURATION
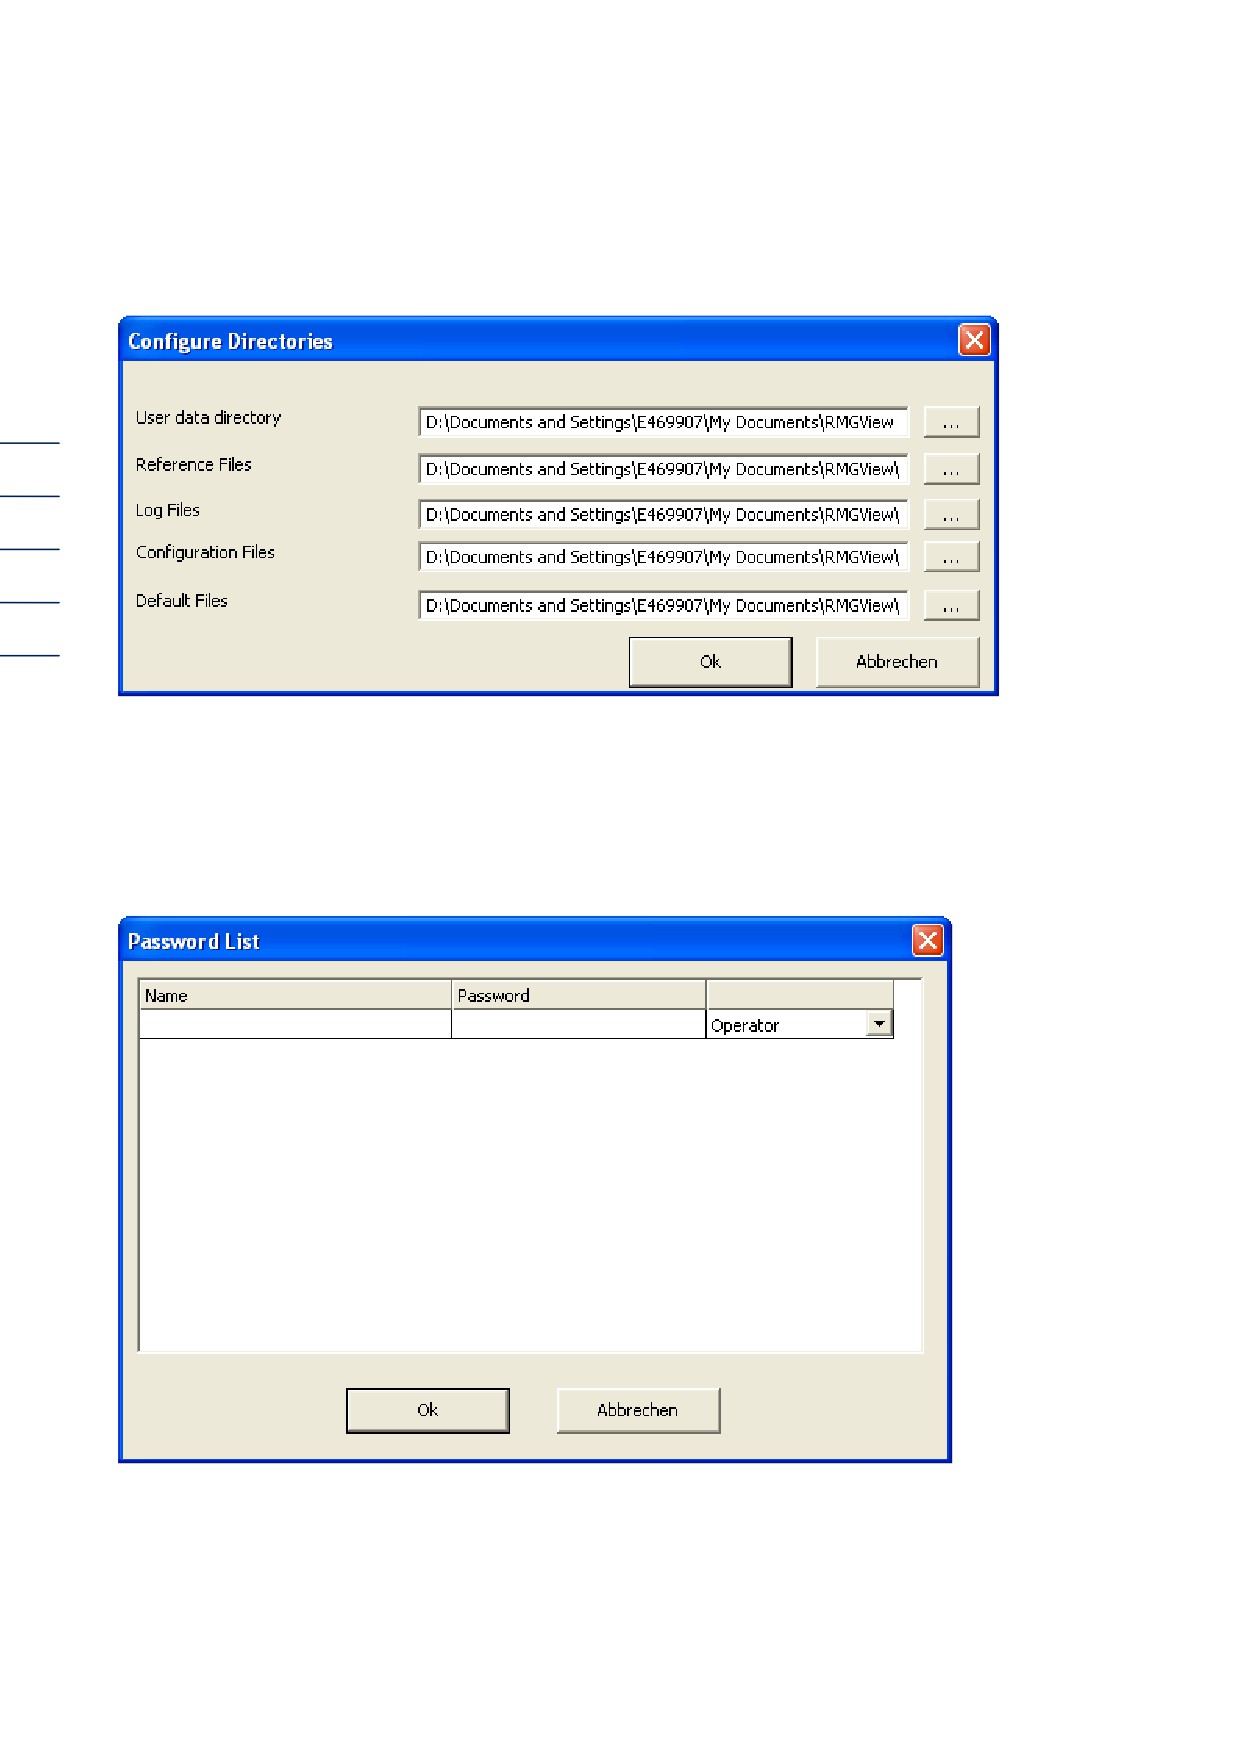
6.2 "Configure Directories" button
58
Figure 76: "Configure directories" mask.
Directories can be configured or changed here.
6.3 "Edit password list" button
Figure 77: "Edit password list" mask
You can enter the name of the employee together with the stored password and mode in this
mask. You can change this information at any time.
7 TROUBLESHOOTING
7 Troubleshooting
7.1 Reference file is absent
It may happen that RMGView cannot find the reference file the next time it opens due to changes
to units, for example (from ft/s to m/s) and is therefore unable to load.
The reference file is saved in the determined folder under RMGView-K configuration->Configure
59
folder and can be deleted there.
Log in as the configurator (password).
Click on "Run Inspection" in the "Test values" window.
Ignore an invalid reference file notification.
A log file is created.
Then determine a file name, click on ok and the USM test protocol appears.
Check it.
You are asked whether you want to add the log results to reference files.
Click on "Yes."
It now appears in green writing in the very first line that the reference file was loaded as series
number.ref.
Repeat this procedure for different practice-oriented gas speeds.
The reference file contains the following values for different Vwk:
- C0-C5 (path speed for speed of sound ratio
- AgcUp0…AgcUp5, AgcDown0…AgcDown5: AGC-Level for AGC ratio
- Ve0…2: Level speed for speed ratio
The anticipated value (live values AGC status display, test protocol) is interpolated using Vwk.
The file can also be edited manually by authorized personnel.
7.2 cfg-file is absent
The cfg file should be filed in the cfg folder determined during installation and should also be able
to be called up again from there.
7 TROUBLESHOOTING
7.3 Connection to the meter is disrupted
The notification appears: "You have just removed COM5."
Please check the USB cable connections from the device to the computer. An inadequate USB
plug connection could be responsible for the time out. It could also be caused by an excessively
long or poorly shielded cable. Please only use twisted and shielded cables up to a maximum length
of 500 m. The LiYCX 2 x 2 x 0.75 mm2 type is recommended. The green status LED at the bottom
left shows whether communication is error-free.
60
7.4 "RMGView is already running..." display
The notification appears: "RMGView is already running on COM5."
This means that an instance of RMGView is already running. It cannot be launched a second time
on the same interface.
Troubleshooting: Exit RMGView or, if that is not possible, exit the RMGView.exe process in the
Processes tab in Windows Task Manager (right button on Windows start bar > launch Task
Manager).
However, if connections are desired from the same computer to several ultrasonic gas meters, you
must first change over to the second connected COM port in the already open RMGView before
RMGView can be relaunched on the standard COM port.
7.5 Display "The file USE_112c.rmx …
… was not found. Contact RMG to obtain an appropriate USE_xxx.rmx-file for your USM09."
Obtain the relevant rmx.file for the firmware of your USM09. Disconnect your USM09. Launch
RMGView. Select the menu point.
Open Tools->RMGView APPDATA folder. Copy the .rmx-File into the displayed folder.
Close RMGView. Reconnect your USM09. Launch RMGView.